12-15 Opening Update: Grains Begin the Week Mixed


- Corn futures are trading mixed to slightly lower to begin the week. March ’26 futures are 1/2 cent lower at $4.40-1/2. December ’26 futures are unchanged at $4.62.
- Strong corn exports continue to underpin futures, highlighted by two consecutive flash sales last week that reinforced the supportive demand tone.
- The U.S. dollar has weakened sharply following the Fed’s rate cut, and any further softness would likely provide added support to export demand.
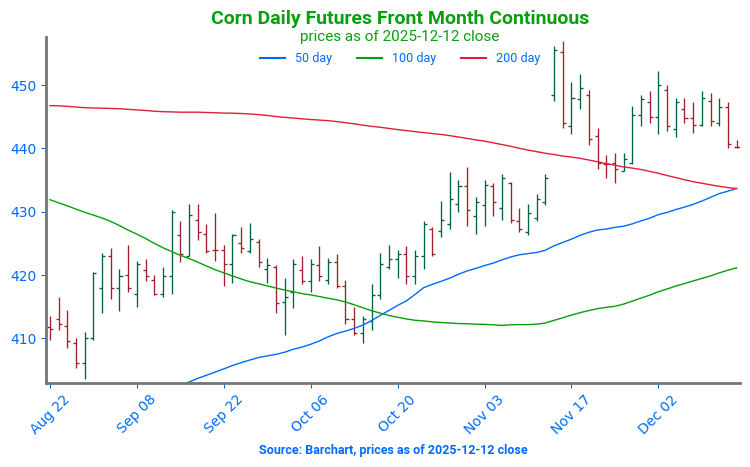
Corn Futures Find Support: Corn futures retested technical support at the 200-day moving average following contract rollover. This support level held, and prices have rallied a small amount since. Support continues to be offered at the 200-day moving average, near 434. Structural resistance can be found near 465.

- Soybean futures are mixed, but mostly lower to begin the week. January ’26 futures are 1 cent higher at $10.77-3/4. March ’26 futures are 1/4 cent lower at $10.86-1/2. November ’26 futures are 1/2 cent lower at $10.87-3/4.
- U.S. soybean shipments to China are picking up, and Sinograin is clearing space for arrivals, but purchases remain well short of the 12 million tons U.S. officials said China would buy by year-end.
- U.S. exports remain well behind last year’s pace, with traders expecting further slowing as Brazil begins harvesting a likely record crop.
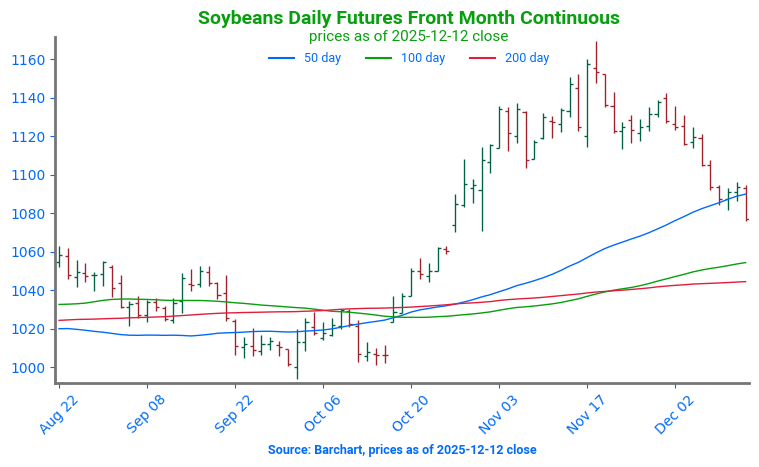
Soybeans Break Lower, Test Support: Soybean futures broke below key psychological support at 1100 and technical support near 1089. The next point of support can be found at the 100-day moving average, near 1054. The 50-day moving average will now serve as technical resistance, near 1089.

- Chicago and Kansas City wheat have both started the week lower, while MIAX wheat is unchanged. March ’26 Chicago futures are 3-1/2 cents lower at $5.25-3/4. Kansas City is 3-1/4 cents lower at $5.14-1/2. MIAX wheat is unchanged at $5.76.
- Argentina is harvesting a record wheat crop and has begun loading its first bulk shipment to China, opening a new export route between the two countries, according to COFCO International.
- China’s statistics bureau said total 2025 grain production rose 1.2% year over year to 714.9 mmt, while the wheat crop was unchanged at 140.1 mmt, in line with the USDA.
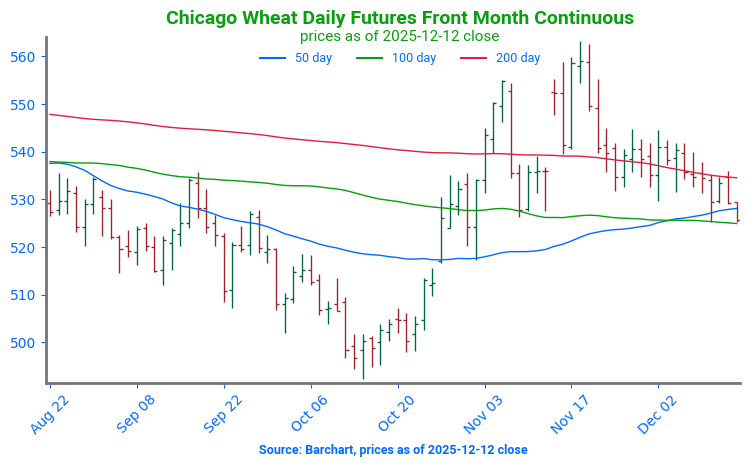
Chicago Wheat Tests Support: Wheat futures have started to retest technical support at the 200-day moving average, near 534. Should this support break, a secondary point of support can be found at a band of moving averages near 525. Resistance can be found at the most recent high, near 561.
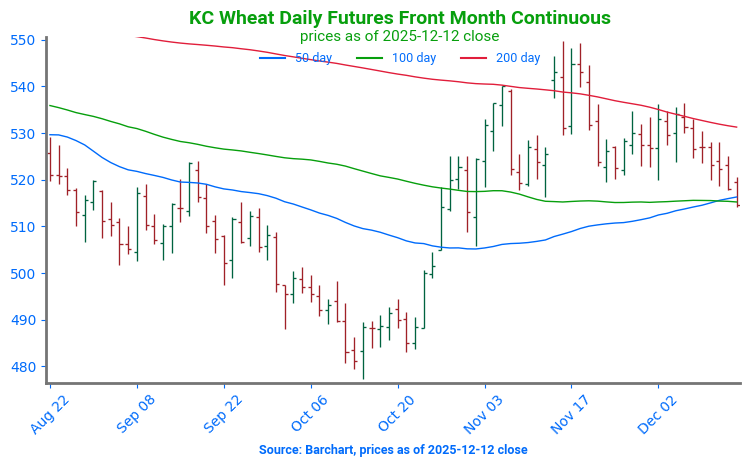
KC Wheat Consolidates: KC wheat has started a consolidation phase after breaking below technical support at the 200-day moving average. The 200-day moving average now serves as resistance, near 533. Support can be found at a band of moving averages, near 514.
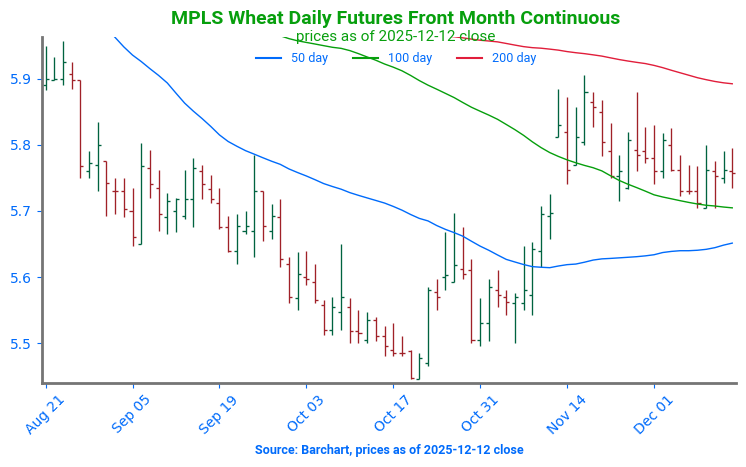
Spring Wheat Consolidates Spring wheat futures have started a consolidation phase after contract rollover propelled prices above the 100-day moving average. The 100-day moving average now serves as support, near 571. Resistance can be found at the 200-day moving average, near 590.
Grain Market Insider is provided by Stewart-Peterson Inc., a publishing company.
Futures and options trading involve significant risk of loss and may not be suitable for everyone. Therefore, carefully consider whether such trading is suitable for you in light of your financial condition. The data contained herein is believed to be drawn from reliable sources but cannot be guaranteed. This material has been prepared by a sales or trading employee or agent of Total Farm Marketing by Stewart-Peterson and is, or is in the nature of, a solicitation. Any decisions you may make to buy, sell or hold a futures or options position on such research are entirely your own and not in any way deemed to be endorsed by or attributed to Stewart-Peterson Inc. Reproduction of this information without prior written permission is prohibited. Hypothetical performance results have many inherent limitations. No representation is being made that any account will or is likely to achieve profits or losses similar to those shown. The data contained herein is believed to be drawn from reliable sources but cannot be guaranteed. Reproduction and distribution of this information without prior written permission is prohibited. This material has been prepared by a sales or trading employee or agent of Total Farm Marketing and is, or is in the nature of, a solicitation. Any decisions you may make to buy, sell or hold a position on such research are entirely your own and not in any way deemed to be endorsed by or attributed to Total Farm Marketing.
Stewart-Peterson Inc., Stewart-Peterson Group Inc., and SP Risk Services LLC are each part of the family of companies within Total Farm Marketing (TFM). Stewart-Peterson Inc. is a publishing company. Stewart-Peterson Group Inc. is registered with the Commodity Futures Trading Commission (CFTC) as an introducing broker and is a member of National Futures Association. SP Risk Services LLC is an insurance agency. A customer may have relationships with any or all three companies.