Marketing Strategies in a Directionless Market

A few years ago, a farmer told me about his successful two-step approach to marketing:

  1. Listen to what farmers are saying and feeling about the markets.
  2. When he hears they are getting really excited about where prices are going, he sells because he figures prices are close to the top.

That’s it. That is his plan. And it works for him. He doesn’t care if he gets the best price. He simply wants a good price and figures that is better than the stress of attempting to get (and missing) the top price.

Is this a good approach? In many ways, brilliant. He makes solid, unemotional, and disciplined decisions when the market is in his favor rather than waiting too long. In contrast, many farmers miss opportunities by allowing the emotions of the market to sway them into making the wrong decisions at the wrong time.

Let’s take a look at the chart below to see how our emotions influence our marketing decisions. When the market is hot (in phase A), market participants get excited and delay making a sale in the hunt for a better price. Many people keep betting the market will rise, until suddenly it stalls and begins to fall (phase B). Some people sell to garner some of the gains, and many people wait for prices to return closer to the high. However, as more and more people start selling and the market becomes more saturated with grain, farmers are suddenly considering sales with prices far from the peak (phase C).  At this point, anxiety and fear set in as prices fall and bills come due. It’s at this point where many sales are made in desperation – at the bottom of the market. Right around then, prices start rising again, as the last remnants of grain in the market are being cleared out of the market (phase D) and we return to phase A. In general, your feelings (and, for many, your reactions) reflect where you think we are in the market cycle.

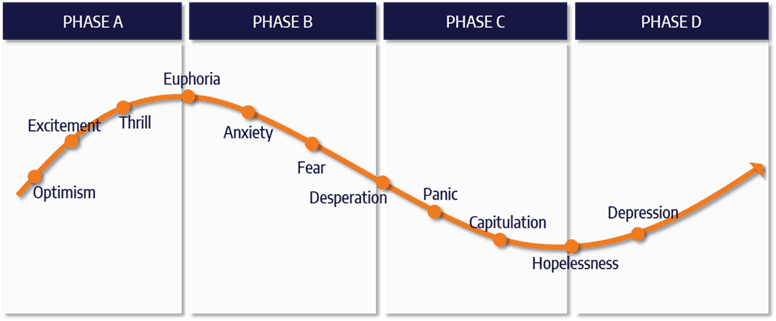
This brings us back to the farmer I was talking about. He operates primarily in phase A as he makes his marketing decisions, allowing himself to take advantage of rising prices without the pain of missing the top of the market. Is his approach one that more of us should aspire to? Before you become an acolyte of this approach, bear in mind that he demonstrates two unusual qualities that allow him to harness the emotions of the market. First, he recognizes that heightened emotions mean the market is getting hotter and hotter; second, he doesn’t get swept up in the emotions. His general mindset may be far more inclined to lock in a good price vs. temperamentally taking a bet on getting the best price. Together, these factors make it easier for him to pull the trigger than the average farmer. 

Just as importantly, however, while his approach works for him in a rising market, it really doesn’t help address what to do in a falling or flat market. How do you make a decision when the market is weak for extended time periods and bills are coming due? What if the market really does continue to rise or fall in spite of rather unrealistic market chatter? This calls for a more rigorous approach to work in a number of market environments.

It’s Hard to Tell if Prices Are Headed Up, Down, or Nowhere

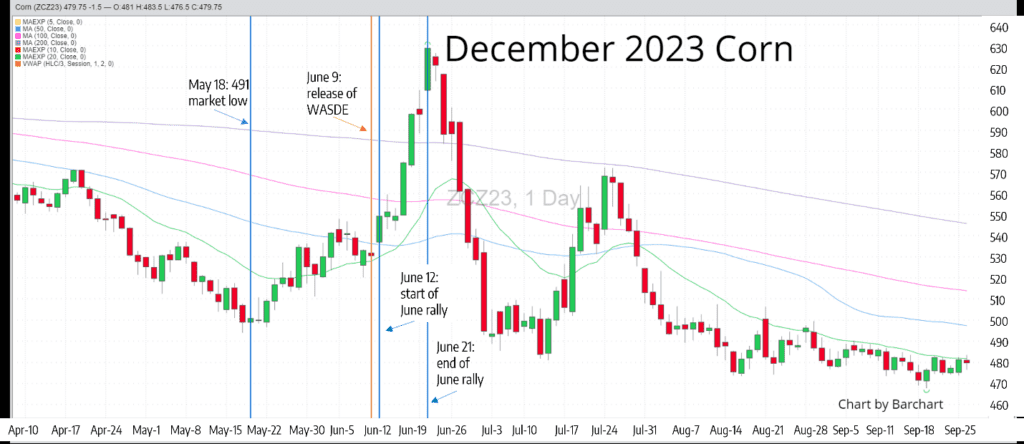
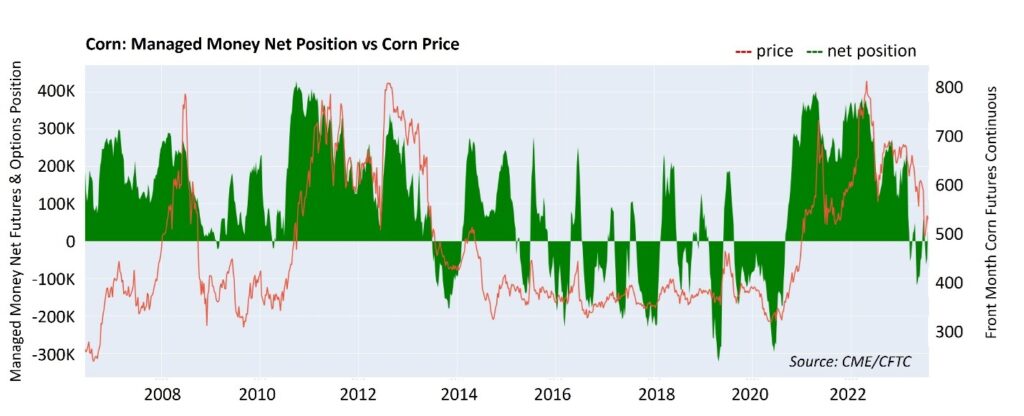
On that note, now is (sadly) a good example of a time when you need to start making decisions in uncertain market conditions. On the bright side, Dec ’24 corn rallied from a low of 446 on February 26 to 496 ¾ on May 15. Is this the reversal of the downward trend you lived through between December of 2023 and the end of February 2024? If you’re on the more pessimistic side, you might feel like this is a blip in an ongoing downward market and you might be inclined to sell, potentially at a market bottom (echoing phase C of the chart above). More optimistically, you might be inclined to sit tight, thinking that the recent rally is the beginning of an upward trend (echoing phase D in the chart above). This, of course, puts you at risk if prices go down.

What is going on that can help us determine where the market may be headed?

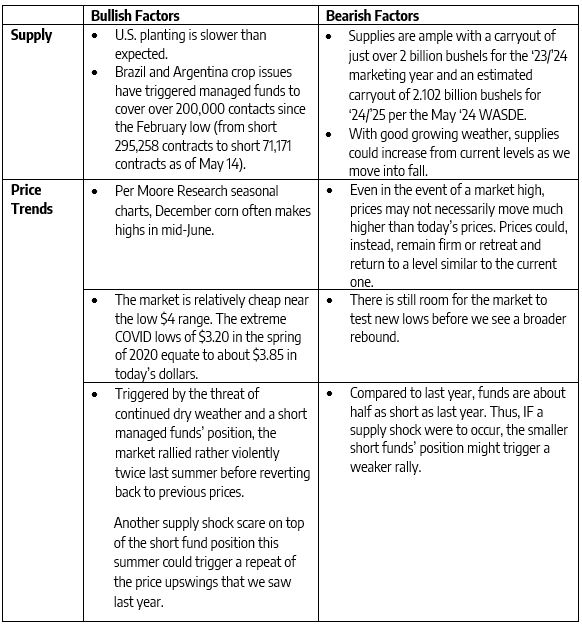
Bottom line, prices are soft and have every potential to remain soft. Or not. Under our current conditions, it’s hard to say how prices will move and for how long. 

You Need to Plan to Make Sales Regardless of What the Market Is Doing

Selling your crop by the seat of your pants or with the idea of “I only sell when I need the money” can absolutely lead to profitable sales at times.  However, it can also have you selling at less advantageous times that could be avoided with some planning. Think about the specific times of the year when you will need extra cash flow for things like machinery payments, rent payments, seed, and chemicals. Also consider when grain needs to be moved to cone down your bins or make room for fall’s harvest:

  • Prior to the time you need the cash, plan to make sales as the market presents opportunities.

    • When it comes to old crop: identify the drop-dead date that the bins need to be emptied.
    • When it comes to new crop: identify how much grain you can store on farm versus what needs to be delivered at harvest. Consider making new crop sales ahead of harvest in lieu of paying commercial storage and selling post-harvest.

  • Pay attention to the opportunities seasonality often offers.

    • While seasonal tendencies don’t occur 100% of the time, prices tend to be more advantageous during the late spring and into early summer, then again in mid to late winter.
    • Note that both old AND new crop sales can be quite advantageous in the late spring and early summer. Soybeans often offer solid opportunities through mid-summer.

  • Set up an approach that allows you to take bites out of rising and falling markets.

    • As the market moves higher, you price more and more of your grain closer to the top. Similarly, as the market moves lower, you garner value before the price falls too far below the high.
    • A stop strategy can help in this approach.

The key is to make plans when you are in control. The last thing you want to do is wait to make a worst-case decision because you don’t have the time or flexibility to make a better decision.

Grain Market Insider can help

For almost 40 years, Grain Market Insider has helped farmers be successful in any market condition. We can help you set up a plan that prepares you for whatever the market does rather than on what you hope it will do.

Give us a call at 800.334.9779 to learn more.

The Risks of Good (and Bad) Intentions

By this time of the year, most of you have moved from crop planning to execution. In all likelihood, you have adjusted your crop mix, have purchased your seed, and have begun or are close to beginning planting. Unless you have a field here or there that you haven’t fully planned around, it’s increasingly unlikely that you want to spend the capital to change your crop mix in any meaningful way.

If you’re like most farmers, you’re also starting to look at ways to manage the price you’ve begun setting with your crop mix decision. And because farmers are in the thick of planting, the first opportunity farmers often look to is the March Planting Intentions report and anticipated market movement when the June Planted Acres report drops. Of course, this all begs the question: how much opportunity is really there?

Acres Generally Do Not Change that Much

As you and every other farmer move from planting intentions to planting, you make adjustments to your crop mix. You may decide to pull back on corn and put more of your mix in soybeans, and a farmer the town over might make the opposite decision. Bear in mind that if you (along with your friends and relatives) are going heavier in one direction, you may think your sentiment will be reflected in June actuals. The data, however, shows that the actuals in aggregate don’t really move that much from intentions. Data over the past 20 years (2003-2023) bears out that acreage changes by less than 2%, on average, for both corn and soybeans.

Corn acreage tends to increase more than decrease.

  • • Corn acres have deviated from March intentions to June actuals by an average 1.4% or about 1.2 million acres.
  • • For fifteen of those twenty years, acres planted outpaced planting intentions by an average 1.1 million.
  • • Acres planted underperformed planting intentions by an average 1.5 million for the other five years.

Soybean acreage change is slightly more meaningful, and it’s a 50/50 shot which way it will move.

  • • Soybean acres have deviated from March intentions to June actuals by an average 1.8% or about 1.5 million acres.
  • • For ten of those twenty years, acres planted outpaced planting intentions by an average 1.1 million.
  • • Acres planted underperformed planting intentions by an average 1.9 million for the remaining ten years.

This makes sense. By March, you need to have a plan in action to buy seed and other inputs, and a major change in direction can mean real money. The market and the math need to be compelling to make up for the dollars already spent. Bottom line, on its own, don’t expect changes from the March to June report to have a significant impact absent other market shifts.

Expect Bigger Acreage Changes When the Market Demands a Change

As mentioned, the math needs to be compelling to make a crop mix change, in terms of a significant increase in demand or price or a significant protection in the costs of production. The chart below outlines the difference in actual June acres vs. March planting intentions over the past 20 years. Note that many of the biggest changes in acreage correspond to a major market shock in terms of demand, supply, price, or weather.

Let’s look at a few of the years with the biggest changes between intentions in March and actuals in June:

Bottom line, acreage changes were driven primarily by market conditions, and not a bet on the direction of a report.

Takeaways for Your Marketing Strategy

When it comes to data over the past twenty years, the years where a change in acreage made an impact were also years when the market already offered farmers compelling financial reasons to anticipate an acreage change. A bet on acreage numbers alone without other fundamental shifts, on balance, do not seem to be advantageous to marketing decisions.

Instead of trying to guess where the market is going, it’s better to plan for wherever the market might go. That means making a plan that is flexible and adjusts as the market changes. Build a plan that helps you protect your price in the event the market goes up – or down. And be prepared to capture market opportunity as it comes to you rather than hoping to hit the top of the market.

Grain Market Insider can help, as we’ve helped farmers for almost 40 years.

Have questions about how you can build a plan to help you in any market environment, or questions about your plan?

Call us at 800.334.9779.

When It Comes to Wheat, It’s a Russian Bear

A recurring theme that we’ve examined in the past is that the futures price of a commodity doesn’t always seem to connect to the fundamentals. Shouldn’t prices go up when ending stocks go down? And down when ending stocks go up? While U.S. current and anticipated ending stocks often have a significant influence on price for a wide variety of agriculture commodities, the story is quite different for wheat. Namely, competing fundamentals (especially the interplay between domestic and global fundamentals) can drive prices in an unanticipated direction. Let’s take a look at what’s been happening with Russia and the strength of the U.S. dollar to understand how fundamentals have come together to drive down wheat prices.

Supply – and price – continues to be weak for wheat

Between the 21/22 and the 22/23 crop years, U.S. ending stocks dropped 15.4% from 674 mb in 21/22 to an estimated 570 mb in 22/23. (Translated to global metrics, U.S. supply fell from 18.3 million metric tonnes [mmt] to 15.5 mmt.) In contrast, Russia’s 92 mmt bumper crop for the 22/23 season (equating to 3.38 billion bushels) dwarfed U.S. production. Furthermore, the Russian increase in exports from 21/22 to 22/23 was 14.5 mmt, or around 533 mb. In other words, Russia’s increased exports alone between 21/22 and 22/23 were almost as large as the U.S. 22/23 ending stocks of 570 MB.

Nonetheless, world supply (less China) experienced a net decrease, shrinking by 3.71 mmt from 136.0 mmt to 132.3 mmt. With that decrease, anyone could be forgiven if they expected an increase in prices, or at the very least steady prices. However, prices fell instead, and rather sharply. Take a look at the chart below, focusing on the line representing the change in prices for Chicago wheat since October 25, 2021. Since around May of 2022, prices have fallen almost a net 30% from the price offered in November of 2021 after rising between February and around June of 2022. This begs the question – what’s the driving force behind the drop in prices?

Source for chart above and other ending stock estimates in this report: March 2024 WASDE report

The weakness of the ruble has a significant impact on the price of wheat

The U.S. dollar is the global currency to buy and sell wheat, and it’s logical to assume it has a significant influence on the price of wheat. By extension, it makes sense to ask whether the U.S. dollar strengthened relative to world currencies to such an extent that U.S. wheat became overpriced, especially as global supply declined in 22/23. To answer that, take another look at the chart above which shows (in red) the percent change in the price of Chicago wheat compared to the U.S. dollar index (in green), as measured against a basket of currencies. Contrary to an anticipated change in the strength of the U.S. dollar index in the face of wheat declines, the index held fairly steady. This lends fuel to the thought that the strength of the U.S. dollar alone has not influenced the big decline in wheat price.

What, then, has influenced the decline in price? Because Russia is a huge exporter of grain, it’s more important to look at how the U.S. dollar has fared specifically against the Russian ruble. For context, take a step back and think about what’s been happening to Russian exports since the invasion of Ukraine in February of 2022. The U.S., the E.U., and the U.K. along with countries such as Japan, Australia and Canada have imposed over 16,500 sanctions against Russia, including freezing assets and restricting imports and exports. As a result, the demand for rubles has continued to decrease because there are fewer items being purchased from or sold to Russia. Accordingly, the U.S. dollar has strengthened in comparison (that is, you can buy more and more rubles with a U.S. dollar). At the same time, wheat is one of the few exports from Russia that has not been sanctioned, so Russia has a huge incentive to export more wheat to expand their economy. Bottom line, Russia is exporting more and more wheat, accelerated by the low relative cost of the ruble.

The chart below demonstrates just how much influence the price of the ruble has on the price of grain. Note the inverse relationship between the price of Chicago wheat and the weakness of the ruble against the U.S. dollar. As the number of Russian rubles per U.S. dollar rises (that is, as the ruble weakens), we see the price of wheat decline. That relationship is especially evident between the two purple vertical lines between the dates 9/25/2023 and 1/22/2024. As rubles to the dollar rises, the price of wheat declines. Similarly, as rubles to the dollar falls, the price of wheat rises. For reference, the blue vertical line on 2/21/2022 marks the first day of the invasion of Ukraine.

A notable point in this chart is where the ruble and wheat converge on the chart (circled). Just prior to the circled area, the ruble began to devalue relative to the dollar and the price of wheat continued to fall. As of 3/04/2024, the ruble has lost about 29% of its buying power and Chicago wheat has lost about 27% of its prewar value. You can also see in this chart that the U.S. dollar index is relatively stable. Therefore, if we are to compare the relative influence of the U.S. dollar index to that of the value of wheat, the value of the Russian ruble relative to the U.S. dollar has apparently far more influence on the price of wheat.

A major recovery in wheat prices does not seem imminent – plan accordingly

What do we have for the 23/24 crop year? In the U.S., wheat ending stocks per the March WASDE are estimated to return to 21/22 levels of 673 mb (vs. 674 in 21/22 and 590 in 22/23). Russia is also estimated to increase exports to a whopping 51 mmt. On the other hand, the 23/24 WASDE global estimates (less China) is forecasting another decline in supply from 132.3 mmt to 126.8 mmt. In the meantime, the war continues, and sanctions have only increased as Ukraine allies continue to apply more pressure to Russia. Has this changed market expectations, and therefore could it trigger a change in prices? It’s hard to tell. However, unless something occurs to change expectations, wheat prices appear to be weak for some time to come.

It’s worth emphasizing again and again – prices change when expectations change, and those changes are nearly impossible to fully anticipate. Fundamentals might lead you to think a market is going in one direction. If you miss one fundamental that overwhelms the other factors, suddenly the market is going off in another direction, leaving you behind. And it’s always easy to explain the fundamentals after a market shifts direction. It’s quite difficult to adequately anticipate all the fundamentals before a shift in direction.

Instead of trying to guess where the market is going, it’s better to plan for wherever the market might go. That means making a plan that is flexible and adjusts as the market changes. Build a plan that helps you protect your price in the event the market goes up – or down. And be prepared to capture market opportunity as it comes to you rather than hoping to hit the top of the market.

Grain Market Insider can help, as we’ve helped farmers for almost 40 years.

Have questions about how you can build a plan to help you in any market environment, or questions about your plan?

Call us at 800.334.9779.

Time to Sharpen Your Pencils on Your Breakeven

Over the past three years, farmers have enjoyed elevated commodity prices and relatively strong profit margins. This financial cushion has allowed many farmers to relax when it comes to a rigorous examination of breakeven prices for corn and soybean production. However, the USDA cautions in their February 2024 Farm Report on Farm Business Income that farm income is forecast to fall about 27% relative to 2023 in non-inflation adjusted terms. Clearly, it’s time to dig into the specifics of your anticipated input costs. After all, input costs and revenue-driving price are the two historically biggest influencers of your breakeven. This is why it is crucial to fully understand those factors for decision-making in the short term and to ensure the longevity of your operation. Let’s look at where farm costs and revenues are headed DIRECTIONALLY and why this underscores how critical it is to take a more specific look at your costs.

Price

Unfortunately, the prices for corn and soybeans have been on a downward slide since the summer of 2022. Record U.S. agricultural exports to China in the 2022 marketing year eased in 2023 and are expected to retract further in 2024. As reported in the January 2024 WASDE, a record national corn yield in 2023 compounded the pressure on commodity prices, as front month corn and soybean futures traded down to their lowest levels since late 2020. As prices go against you, it’s crucial to make sure you have a firm grasp on your costs.

Input Costs

On the positive side, it looks like you can anticipate that some of your costs – unlike crop prices – may be flat or even headed in your favor. However, remember that a slight decrease in input costs cannot offset a large decrease in price. In addition, regardless of general cost trends, all input costs do not affect each farm equally. You need to consider which costs tend to fluctuate more locally or nationally to get a better handle on your personal cost structure.

Cash Rents: Generally, Your Biggest Input Cost

Land remains the biggest input cost that farmers need to account for in calculating your breakeven. If you own your land, your annual costs tend to be steady, and you likely understand that cost structure quite well. In contrast, rental costs are more variable in nature regarding their impact on breakeven. Take 2023, for instance. Last year, the National Agricultural Statistics Service August of 2023 farmer survey showed that 2023 cash rents moved higher compared to 2022, and the magnitude of that change is aligned closely with your location. If you lived in Illinois, for instance, the cost impact of land rents on your breakeven was greater than if you lived in another state. Indeed, according to a September 5 farmdocDaily report, nine of the ten most expensive cash rent counties in the U.S. were in Illinois, and the average cash rent reported for Illinois in 2023 was a record high $259 per acre, up $16 per acre from 2022.

What will be in the impact in 2024? This remains to be seen, and the impact will vary by area. On a consolidated basis, early results from outside surveys suggest cash rents may decline slightly in 2024, although results from this NASS survey will not be available until late in 2024. At an individual level, you will understand the direction rentals are headed in your area.

That leaves you to examine much more closely the costs that are more variable in nature every year. Let’s start with the second biggest cost for most farmers, fertilizer expenses.

Fertilizer: Generally, Your Second Biggest Input Cost

On a positive note, the USDA and the University of Illinois expect the average cost of growing an acre of corn to decline in 2024, mostly due to lower fertilizer expenses. As of late January, UAN 32% nitrogen fertilizer had an average price of $390 per ton according to sellers surveyed by DTN. In fact, the percentage cost of all fertilizers (except one) is lower by double digits compared to a year ago:

In terms of the per-acre impact, the same report estimates that fertilizer expenses for corn will continue the 2023 reduction in cost. More specifically, prices are anticipated to drop another 17% from the average cost of $189.55 in 2023 to $156.92 per acre. This reduction in fertilizer costs should help insulate farmers from some of the drop in corn prices.

Other Costs

Similar to fertilizer costs, fuel costs are expected to decline from 2023.  Pesticide costs are also expected to decline slightly from last year (according to the University of Illinois 2024 crop budget for an acre of corn on Highly Productive Farmland in Central Illinois). All other input costs are forecast to rise slightly or stay steady compared to 2023. 

Building YOUR Breakeven

As you calculate your breakeven (that is, total anticipated costs/total anticipated bushels), it’s important that you take your unique situation into account. Add up all your costs (real and your best estimates of anticipated costs) and calculate your estimated bushels based on anticipated acres planted and yield based on historical yield. How does this compare to current prices? Does it make sense to lock in any prices? How does this information help you make decisions about investments in your operation? Bear in mind that, while many people like to include household expenses in their breakeven, we recommend using only farm-related costs. This will allow you to have a true metric of the financial situation of your operation alone, which will aid you in assessing the health of your operation vs. other operations.

With that in mind, here’s a starting point for your comparison to other farm breakevens.  The University of Illinois’ 2024 crop budgets suggest farmers on Highly Productive Farmland in Central Illinois selling corn near current fall of 2024 prices at $4.50 can anticipate a return on corn of -$154 per acre in 2024, a continued decrease from the 2023 forecast of -$100 per acre. With yields at trend level, breakeven prices are above $5.00 per bushel for corn. For soybean producers, the same crop budgets suggest that these same farmers selling soybeans near current fall of 2024 prices at $11.50 can anticipate a return on corn of -$52 per acre in 2024, versus the 2023 forecast of +$15 per acre. With yields at trend level, breakeven prices are above $12.00 per bushel for soybeans.

Let’s translate this into farm incomes. In 2021 and 2022, for instance, Illinois average farm income increased from a healthy $400,000 in 2021 to an even healthier $500,000 in 2022. Incomes are estimated to drop drastically for the 2023 and 2024 crop years back near the $100,000 level. This would be a similar net farm income seen from 2014 to 2019 when corn and soybean prices stayed in a relatively tight range with limited upside opportunities.

The Right Way to Use Your Breakeven (hint: not for marketing)

Knowing your cost of production will help you make the right decisions about investments and how to manage costs when you can. It can help you make the right determination about how to grow your business and how you can use your resources the most effectively. When it comes to marketing, however, remember that the market won’t always give you your breakeven. For those who choose to sit tight until they reach their breakeven, they may find that the market never gives them the opportunity to make that breakeven sale. Instead, waiting may force them to make a sale when price is the least advantageous.

Your job is to capitalize on the market when it offers the most opportunity and build a price in the market you’re given. We at Grain Market Insider can help. Having an actionable marketing plan can be highly beneficial in times of tighter margins for grain operations. Talk to us about how we can help you make the most of any market environment.

Call us at 800.334.9779.

The Potential Costs of Lower Inflation

When it comes to inflation and capturing pricing opportunities, remember that, in some ways, it’s business as usual. Think about selling when prices are rising. Don’t wait too long to sell as prices start to recede. However, bear in mind that inflation can amplify the price of commodities, both upward and downward. Furthermore, commodity prices are generally the first to be affected by inflation, so you need to act more quickly than other industries.

How closely do inflation and prices align? Consider the chart below, which tracks inflation and the price of corn, demonstrating how you can generally expect better crop prices as inflation increases, and lower crop prices as inflation pulls back. For example, in April 2022, old crop corn hit a high of $8.245 (July 2022 contract) as annualized inflation (Consumer Price Index) topped out at about 7%. Current inflation is essentially halved at an annualized 3.4%, and the price for old crop corn (March 2024) is also cut almost in half at $4.4625.

What are the implications if inflation continues to fall? Everything else being equal, there is more potential for prices to continue to fall, which means it’s possible that prices right now are high compared to what they could be in the future. Unfortunately, unlike falling prices in a stable inflation environment, you still have to manage the potential fallout of raised inflation, including a higher imbedded cost structure, higher interest rates, and a greater risk for a recession. All of these factors, of course, have huge implications for on-farm profitability. Let’s discuss the continuing potential and real costs of inflation and how that could influence your strategies.

1.  Increased costs of production due to inflation are most likely permanently imbedded in your cost structure.

Ever since inflation spiked, the costs for everything on average have gone up fairly substantially. Still, many people are frustrated that costs haven’t returned to normal as inflation has receded. In other words, it feels like this supposed decrease in inflation isn’t real. That’s because, contrary to popular belief, prices are not receding – they’re continuing to increase in spite of the decrease in the rate of inflation. Here’s why:

  • A decrease in inflation means that the costs for goods and services rise more slowly than they do under a higher inflation rate – it doesn’t mean that overall prices return to where they were. To put it more bluntly, in a growth (non-recessionary) economy, the costs today are now the normal costs.
  • Take a look at the chart below, which shows the past 10 years of annualized inflation rates. Rates prior to 2021 ranged from a low of 0.7% to 2.3% – we’re talking more than 100 basis points between the high end of that range and today’s annualized inflation rate of 3.4%. If it feels like prices haven’t settled, it’s because they continue to rise at a rate higher than we had been used to pre-2021 inflation.

    • The compounding effect of inflation on prices accelerates the pain of rising costs. Let’s use the numbers in the chart above to highlight that on a theoretical good costing $100 at the end of 2012.

    Year Annualized Inflation Rate Impact of Inflation on Cost
    2012   $100
    2013 1.5% $102
    2014 0.8% $102
    2015 0.7% $103
    2016 2.1% $105
    2017 2.1% $107
    2018 1.9% $109
    2019 2.3% $112
    2020 1.4% $114
    2021 7.0% $121
    2022 6.5% $129
    2023 3.4% $134

    Take a look at the rise in cost from 2012 to 2020. Over that 8-year period, the cost (rounded to the nearest dollar) would have risen $14. In contrast, the cost from 2020 to 2023 would have risen $20, where $5 of that increase happened in 2023 in spite of the lower rate of inflation. This is because of the compounding effect of the large jumps in price in 2021 and 2022. In other words, we continue to pay for previous jumps in inflation even in relatively low inflation environments. The lower you can get inflation, the less pain on top of pain.

    • Wishing for lower input costs is the same as wishing for even more pain, especially if the price of your grain falls at a faster pace than any reduction in the cost of your inputs. That’s because a reduction in the price of goods and services across the economy generally translates into deflation and a recession. The potential net result to you? Lower worldwide demand without a clear, substantially meaningful change to your cost structure.

    2.  Fed action to control inflation affects the interest rates you pay

    Speaking of the risk of recession, let’s revisit the consumer price index/inflation rate of 3.4%. Again, this rate is substantially better than the 7% high. Nonetheless, it’s still 1.4 percentage points above the Fed’s target rate of 2.0%, which would generally return us to pre-2021 inflation rates. The Fed has limited tools to try to get inflation further under control, and any action still has potential for some negative impact on your cost structure.

    • They can maintain or even increase the cost of lending. The market has indicated it expects a drop in rates in 2024. Before that happens, the Fed would theoretically want to spur a slowdown in economic activity, including slower demand and growth, and higher unemployment.
    • A higher interest rate impacts your cost of borrowing, which will offset any decrease in inflation on the costs of production to some unknown extent.
    • More broadly, the danger is the Fed overplaying its hand and flipping the soft economic landing that has been lauded to a harder recession. While this would likely help your (non-borrowing) cost structure, it could have a big downward effect on commodity prices, especially if weak economic activity in the U.S. spurred a larger weakening worldwide.

    3.  In a higher interest rate environment, some strategies are riskier than they were in the past

    As always, the intersection between fundamental factors like inflation and interest rates, and your strategies, is expected yield – both yours and globally. Right now, weather patterns have improved in South America and conditions have improved in the Plains for wheat. In the January USDA WASDE update, the USDA put the national 2023/2024 corn yield at a record 177.3 bpa, in dry weather! All of this speaks to the potential for ample stock, downward pressure on prices and a bigger spread between interest rates (cost of carry!) and price.

    Case in point, the cost of carry to keep your grain in storage is higher than it was before. For instance, on an operating loan of 8%, the cost to carry $4.50 corn is 3 cents per month. Be mindful in this environment where U.S. carryout is increasing, and South America is (possibly) improving. It may take more for the market to rally to make up for the increased cost of money. Do you want to speculate? Can you afford to speculate?  If you lock in carry on a sale (for May) are you getting an extra 12 cents (four months of carry) for your corn?

    • If you’re self-financed, looking for a rate of return equal to the 30-day T-bill rate, that equals about 1.625 cents/mo. (4.5%)
    • Add in the cost of storage, commercial or self-owned, and the carry required increases.

    Remember, when there are ample supplies, the market tends to price a carry in the market (as end users have plenty for now). Typically, this happens as funds sell the front months more aggressively than the deferred, keeping a lid on prices and rallies.

    4.  It’s not all doom and gloom

    We’ve laid out the potential negative impact of inflation on economic health to make sure that you prepare and weather a negative economic scenario brought on by inflation. However, there is also just as good a possibility that the U.S. will finish its soft economic landing and be in the position to reduce interest rates. If that does occur, we believe this scenario would be supportive of commodity prices.

    Have a Plan – and Be Prepared to Take Action in Falling Prices

    One of the worst feelings in the world is selling on a down day in the market. However, remember that a down day today might be the best day to sell if the market continues to decline. Given market conditions, you need to have a plan in place in the event of increased interest rates or market contraction as the economy continues to fight the aftermath of high inflation. As always, no one has a crystal ball on what the market will do. Build a plan to make sure you are positioned to capture price in any market environment. As we’ve discussed before, this includes:

    • Sell ahead of your crop if prices look good. Many farmers are concerned about selling a crop that’s not yet in the ground. Get beyond this by making some very conservative estimates and sell accordingly. Look at your production history over time and use the lowest number as a base for determining how much you can comfortably sell.
    • Use open sell orders at incremental predetermined levels that represent resistance (congestion) areas that are beneficial to your bottom line. (Don’t get greedy! This often leads to poor decision-making.)
    • Use stop orders and adjust them accordingly as the market rallies. This will help maximize profitability by minimizing missed sales opportunities.
    • Puts typically gain value as prices move lower. Buy put options to give yourself some downside coverage without the commitment of a sale (futures or cash).
    • Calls typically gain value as prices move higher. If the market is particularly violent and volatile, use call options to protect existing sales from higher prices and gain confidence to sell more bushels at higher prices. (This strategy can be used in conjunction with owning put options because the level of uncertainty can make either one pay off – sometimes both.)

    Grain Market Insider Can Help

    At Grain Market Insider, our consultants spend 100% of the day focused on the market, allowing farmers like you to focus on the job of farming. Talk to us about setting up a plan that can help you capture the highs, avoid the lows, and build a strong weighted average price.

    Call us at 800.334.9779.

    Don’t Let a Good Opportunity Pass You By

    We hope you all had a wonderful holiday season! As we all enjoyed our post-Christmas glow, we started wondering how much time marketers like you have to relax post-holiday before gearing up for market opportunities. We looked back at the corn market over the past 20 years post-Christmas through the first half of each year, roughly through the busy days of planting. We also looked specifically for rallies that hit 10% or more. And what do you think we found out? The markets don’t tend to take a break, and we all need to be prepared for potential market action.  For instance:

    • In 18 of the last 20 years, the markets have offered one (and only one) rally of 10% or more through the first half of the year.
    • Six of those 18 rallies—a full one third—started before the end of March.
    • Of those six, one started up right after Christmas.

    In other words, we don’t have the luxury of waiting to start planning for 2024 pricing opportunities. This begs the question—what’s your plan to capture a planting season rally in 2024? Or to rephrase that, how are you going to methodically approach the opportunities the market offers vs. letting the emotions of the market steer you? 

    Consideration 1: Rallies can start and end before you know it.

    Based on data back to 2004, there are only about 33 trading days, on average, from the bottom of the market rally to the top, with a range of 3 days to 72 days. (The averages referenced here do not include 2012, which we’ve excluded from our calculations as an anomaly.) Does that seem like a lot of time to make smart sales? Perhaps, yes, if you’re watching the markets all the time. However, think about what you’re doing the first half of the year. You’ve moved on to all that is planting. Also, it’s important to bear in mind that you often don’t know a rally has begun until we’re well into it. The market could be rising slowly over a long period of time and then suddenly fall apart, leaving you flat-footed.

    Take a look at the chart below, which outlines the time it takes to get to a market high (in blue) and the time it takes to then return to the original low (in orange) by year. Let’s focus first on the blue—the rallies. As the chart details, the number of trading days to the high have ranged from 3 (!!) to 72 days. Regrettably, there’s no formula that can tell you how long that rally is going to last, and you need to be alert for those instances where the rally is short and steep.

    Consider 2023, for example. The 28% rally started on May 18 and ended 22 trading days later. What were you doing during that time? Did you have a lot of capacity to stay on top of the market, given what you needed to do in the field? Also, bear in mind that this was a decent-size rally. Were you tempted to wait and see if you could capture more, or even the top of the market, then missed the rally altogether?

    Consideration 2: The return to the low can be even faster.

    For argument’s sake, let’s say you missed a rally. Unfortunately, the average sell-off back to the original low is only 22 trading days, and a range of 6 days to 70 days. To that point, take a look at the chart referenced above by focusing on the orange bars representing the number of trading days from the high back to the original rally low. You’ll note that in about two out of three times, the rallies were longer than the decline back to the original low. This makes sense. You may recall this past August when we talked about selling behaviors of farmers (in Managed Money Part 1: What Has It Done for You Lately? August 2023). Farmers, as a whole, tend to sell in a rising market (often slowing down a rise in price) and also tend to sell in a falling market (accelerating a decline in price). Thus, prices tend to rise more slowly than they fall.

    What does this mean to you? You usually have even less time to capture opportunity on the way down than the way up. You need to be alert or have a plan in place for those times that life doesn’t allow you to pay attention to the market.

    Let’s go back to the 2023 example we just discussed. The market moved up in 22 days and back down in 8 days. Eight trading days is only a week and a half. Think how easy it is to rationalize why you should wait vs. sell during that time. Maybe you were still in the field, and you simply couldn’t tend to marketing during that timeframe. Perhaps you just wanted to see prices edge back up a little bit before you made a sale. Perhaps you thought you simply had more time. Whatever the case, the market didn’t give you a lot of time to take action.

    Consideration 3: Sometimes, it pays to be patient.

    Yes, rallies can be quick, and they can also be slow. Take one last look at the chart we’ve been referencing above and note how long some of the cycles took from market low to high and back to the original low. The year 2004 stands out with a 72-trading day rally and a 70-trading day decline. More recently in 2022, there were 55 days to the top and another 33 days down.

    As much as we caution you from not taking action quickly enough, we also need to caution you to take care not to sell too much too quickly and miss the bulk of a rise in price. The last thing you want to do is to sell your grain early and then watch prices rise without a plan in place to protect your sales.

    Consideration 4: Fundamentals are great at explaining what happened; less good at forecasting what will happen.

    In our recent discussion on the impact of expectations on price (In Search of Great Expectations, December 2023), we discussed how the market reflects expectations of players in the market. The players have to make decisions based on known information, and the market only reacts, on balance, to new information that CHANGES expectations. The types of information that might trigger a rally or decline include geopolitical disruptions, weather in the U.S. or South America, or unforeseen supply or demand changes by the USDA.

    Let’s revisit Ukraine as an example, this time in context of corn. In this case, it’s important to bear in mind that wheat and corn markets are often inter-spread. Thus, extreme movements in one market often spread to the other. This makes sense, as each serves as a substitute for the other. As one gets too expensive, buyers tend to switch to the other. Back to Ukraine: in 2022, prior to the Russian invasion, the global market had already absorbed the expected wheat production from Ukraine. Post-invasion, it was unknown whether any supply from Ukraine would be available. Wheat prices soared as grain merchants needed to meet existing sales commitments, and players in the market turned to corn as an alternative. As a result, corn rose 33% over 55 days.

    This explosive change happened because the new information meant that players in the market had to change strategies already set in motion. Merchants had to meet obligations. Buyers had to find wheat substitutes. Corn was suddenly in higher demand. The Ukraine invasion upset plans and the market reacted accordingly. Yet, how long did it then take corn to return to the original low? Only 33 days during an ongoing war. Again, it took only 33 days for the market to absorb the information—now old news—into ongoing expectations. Anyone holding out because they thought the ongoing war mattered lost their chance to capitalize on the opportunity.

    What, then, are you supposed to do?

    Make sales like a hedge fund.

    At this point, you’ve seen that you really can’t anticipate the behaviors of a rally and decline. You may be frustrated, wondering what you can do. Think about using an approach that removes emotions from your decision-making and instead relies on a systematic approach, much like how a hedge fund approaches its own buying and selling decisions.

    The mentality of a hedge fund is simple—methodically reap profits without taking on too much risk. They don’t spend a lot of time speculating on market news. Instead, they set buy and sell targets and use market data to adjust their targets accordingly. Let’s outline how this can work for you with tools at your disposal.

    • Use open sell orders at incremental predetermined levels that represent resistance (congestion) areas that are beneficial to your bottom line. (Don’t get greedy! This often leads to poor decision-making.)
    • Use stop orders and adjust them accordingly as the market rallies. This will help maximize profitability by minimizing missed sales opportunities.
    • Puts typically gain value as prices move lower. Buy put options to give yourself some downside coverage without the commitment of a sale (futures or cash).
    • Calls typically gain value as prices move higher. If the market is particularly violent and volatile, use call options to protect existing cash sales from higher prices and gain confidence to sell more bushels at higher prices. (This strategy can be used in conjunction with owning put options because the level of uncertainty can cause either one to pay off—sometimes both.)

    For more information on stop orders and how they can be an integral part of your strategy, see Selling When Prices are Down, February 2023.

    We Can Help.

    At Grain Market Insider, our consultants spend 100% of the day focused on the market, allowing farmers like you to focus on the job of farming. Talk to us about setting up a plan that can help you capture the highs, avoid the lows, and build a strong weighted average price.

    Call us at 800.334.9779.

    In Search of Great Expectations

    In everyday conversations, producers are often frustrated by the market’s reaction to new information, like the USDA supply and demand reports or changes in weather expectations. Why, on seemingly price-friendly news, do we sometimes see a ho-hum market reaction or even a decline in price? Or, on the other hand, a rally on news that seems detrimental to better prices? It all has to do with the collision of market expectations vs. reality.

    USDA Supply/Demand Reports as an Example of Expectations vs. Reality

    Let’s examine this market phenomenon using the USDA supply/demand reports. As marketers, often long before the USDA releases those reports, you need to make decisions on pricing your grain. Because you don’t know yet exactly how big any crop will be, you are forced to act on educated guesses as to whether the market is fairly valued, over-valued, or under-valued. Will the crop year be a bust or boom for U.S. agriculture? Will weather events have long-term impact on yield? How might non-U.S. production impact the global price for your crop? Bear in mind that it’s not just you making pricing decisions. Purchasers of your commodity are also making decisions based on forecasts and snippets of information, side by side with managed money players making both long and short bets on the market. Your perspective on the market drives your personal pricing decisions, which may include doing nothing at all.

    By the time the USDA supply/demand reports come out, pricing strategies among all market participants have long been set in motion via trades in the market. In other words, market expectations of supply and demand have already been built into the market price. The release of the USDA reports, in contrast, represents the official snapshot of reality in real time. Whether you love or hate the USDA, their reports serve as the “real” state of supply and demand, and signal to market participants whether their bets on market direction were accurate, or if their strategies need to be adjusted. If expectations and reality are close to each other, the market remains fairly steady, as strategies align with the current, measured state of supply and demand. However, if there are surprises upon the release of the report, the market is going to react, as participants in the market adjust their bets with a more fact-based set of data.

    Why Prices Might Go in a Direction You Don’t Expect

    Let’s think about how this might play out. Say the July supply/demand report confirms the market sentiment of low yield for the current crop. Great—you should expect a lower stocks-to-use and a rally, right? Hold on a minute. In our scenario, the projected yield—while low—is higher than expectations. As such, the estimated supply is greater (i.e., higher stocks-to-use) than had been previously anticipated and built into the market price. Participants in the market will likely, on balance, go shorter and trade lower as they pull back on long strategies that had been based on lower yield and ending stock expectations—possibly for an extended time. In other words, prices will likely decrease as the market corrects the pre-release sentiment.

    Recognize that the time around the release of the USDA reports may offer insight and opportunity as the market reacts to the reports. For instance, in the example above, farmers may have an opportunity to take advantage of still decent prices before they fall too much.

    An important side note: like sentiment prior to the release of USDA reports, weather forecasts are also baked into anticipated ending stocks (based on production and anticipated demand) and market price. When forecasts break with actual weather events, expect an impact on the market.

    Ukraine: An Extreme Example of Expectations vs. Reality

    It’s not just new data or weather changes that can swing prices with existing imbedded expectations. Sadly, disruptions to supply from situations like wars have a big impact on the market. Take Ukraine, for example. Prior to the Russian invasion, the global market had already absorbed the expected production from Ukraine. Post invasion, it was unknown whether any supply from Ukraine would be available. At a minimum, the market needed to do two things:

    1. Meet existing sales commitments either by buying back sales that were to be supplied with Ukrainian grain and/or securing grain from another region (such as the U.S.) as a replacement.  
    2. Price in a premium to account for less supply from the region until proven otherwise.

    Just to hammer the point, grain merchants left with uncovered sales commitments (and looming unquantifiable risk) needed to buy back their positions in the face of dramatically decreased global stock and increasing price. For instance, many elevators short on paper and long on physical cash grain may have been subject to margin requirements they couldn’t make. Others may have had hedged Ukraine purchases without sales on the books, which left them naked short on paper. Still others may have made physical cash grain sales, based on procured Ukrainian grain, leaving them naked short physical grain. All in all, the only viable choice for all these short speculators was to buy back hedges. Painfully, they were squeezed by speculators or merchants with unhedged long positions, who slowly (relatively speaking) let the shorts out of their positions—after being well-compensated, of course.

    Considerations as You Set Your Strategy in the Face of Uncertainty

    1. Remember that the market’s sentiment is a collective of individual participants’ long or short positions at any time. With that in mind, set your strategy based on your sentiment vs. blindly following market sentiment.
    2. Separate your sentiment for the futures vs. basis portion of your cash contracts. While you have a great perspective on the conditions impacting basis, the futures portion of the price you receive from a cash grain contract is set globally. Grain contracts traded on the Chicago Board of Trade carry worldwide influence and are traded by participants worldwide. In other words, the conditions locally do not necessarily correlate to the futures price.
    3. As big, planned events occur (like the release of the USDA reports), be available to your advisor so that you can react nimbly to whatever the market brings.
    4. Nobody really knows where the market will go, so consider strategies that position you for whatever happens to price as expectations meet reality.

    We’re here to help.

    Do you have questions about managed money, key market indicators or our recommendations? We’re here to help. Give Grain Market Insider a call at 800.334.9779.

    Managed Money Part 3: Then How Do You Explain June?

    Over the past two articles, we’ve talked about managed money (also referred to as “hedge funds” or “the funds”) and its impact on upward and downward movements of the market. Two key takeaways:

    • Key takeaway #1: In aggregate, managed money tends to buy into a rising market and sell into a falling market while farmers, in aggregate, are net sellers in both rising and falling markets. This helps explain why markets tend to rise slowly (as farmer sales offset hedge fund demand and slow upward momentum) and fall quickly (as everyone is selling, accelerating a decline). (See July 2023’s Managed Money Part 1: What Has It Done for You Lately?)
    • Key takeaway #2: When the funds, in aggregate, approach extreme long positions (about 300,000 to 400,000 contracts) or short positions (about 150,000 to 200,000 contracts), the market tends to be ripe for a directional change, as the funds begin looking to cement the gains in their positions. (See August 2023’s Managed Money Part 2: What Can It Do for You Now?)

    This all raises the question – what happened with June’s meteoric rise in prices? Prices took off with the velocity like they were going down instead of up, and managed money was nowhere near an extreme position. In fact, June kind of makes you wonder if these takeaways really do hold water. Short answer? There were some really unusual events in June which actually reinforce the takeaways of the articles. Long answer? Read on.

    Going back to where it all started – May of 2023

    Think back to the end of May. Dry forecasts and a general lack of rain was beginning to lift the market, as weather premium was being added (although it was still early to be too concerned about the weather). Accordingly, sellers were offered an opportunity to take advantage of a market upswing, which equated to a 40 to 50-cent increase from the 491 May 18 low. Many farmers took advantage of that respectable rally and sold much, if not most, of their remaining old crop bushels.

    Concerns about a drought started to intensify upon news from the Drought Monitor on May 30 (released June 1), warning us of increased dryness. The market rallied and sold off, likely on fund profit-taking ahead of the June 9 WASDE report.

    Heading into June 9, crop conditions continued to worsen and weather forecasts called for continued hot and dry weather. The market, focused on the upcoming WASDE data, anticipated some cut in yield. However, the report itself bucked expectations, maintaining acreage and huge yield estimates of 181.5 bpa. In the meantime, available domestic supply was tight. Old crop basis was still strong, a big inverse between July and December contracts showed the lack of easy-to-originate corn in the countryside (premium to July). As for old crop supply, remember that a lot of what was readily available was sold back in May. And the weather continued to look bad. For traders, the sudden and intense tightening of supply looked like a great opportunity regardless of what the WASDE data said.

    The market takes a sharp upturn – why, when bull markets usually rise slowly?

    Around June 12, the market took off, rising 98 cents through June 21 – in merely 7 trading days. Sadly, not many farmers could take advantage of the rally with a stocks-to-usage ratio of only 10.6% in June. Not only had farmers sold old crop in May, they were worried that they wouldn’t have a crop to sell if the drought continued, so they held back from making sales. The sharp and short rally ended on June 21 upon news that GFS and EU weather maps confirmed moisture entering the scene and an improved overall weather pattern change.

    This is a key point – unlike most rallies, farmers didn’t cool down rising prices (and the market) by feeding demand. To the contrary, farmers behaved quite differently than in most rallies because they didn’t sell into a rising market, much like hedge funds generally don’t buy in a falling market. The result was unfed demand and shooting prices. Bottom line – the rally didn’t behave like normal because farmers didn’t behave like normal.

    Why a change in market momentum given managed money’s unimpressive long position?

    Because of the tight supply, the funds only managed to increase their long positions by a rather nominal amount. Compare the weekly Commitment of Traders (COT) data release between June 13 and June 20, which encompasses all but the starting and ending days of the rally. On June 13, managed money was long by 2,145 contracts. By June 20, they had added 56,154 contracts, thus increasing their long position to 58,299 contracts. Were these additional contracts really enough on either end of the rally to trigger a directional change in the market? After all, as we talked about last month, you can anticipate a market change when the funds are in an extreme long (300,000 – 400,000 contracts) or short position (150,000 – 200,000 contracts), neither of which applied here.

    Important point here – as we talked about last month, managed money net position is only a valuable indicator in a bull or bear market when positions are extremely long or short. As demonstrated in June, all bets are off when managed money is not at an extreme position. In other words, a bull or bear market can happen at any time; you only use managed money as an indicator for a change in direction when they are in position to unload an extremely weighted position.

    Effective marketing is more than hindsight

    When it comes to marketing, oftentimes we spend a fair amount of time explaining what already happened by isolating one or two indicators and discussing how they shaped what happened last week or last month. This helps us learn what affects the market for insight into future situations. Nonetheless, while we focused on a few indicators in this discussion, it’s important to know that you can’t anticipate the market in a vacuum by only looking at one or two indicators. Certainly, the explosive rally in June wouldn’t have made sense at the moment if you only focused on managed money without also noting other indicators like stocks-to-use ratio or the impact of the weather. To put it simply, it’s the interplay of the indicators that can help you make decisions about marketing; paying attention to only one or two is a recipe for going astray.

    At Grain Market Insider, every day we watch over 40 key indicators that we believe have the most bearing on the market – including historical and current patterns – to make sure that we are looking holistically at the marketing recommendations we make for you.

    We’re here to help.

    Do you have questions about managed money, key market indicators or our recommendations? We’re here to help. Give Grain Market Insider a call at 800.334.9779.

    Managed Money Part 2: What Can It Do For You Now?

    Last month we talked about the influence of hedge funds on the price of commodities. A key takeaway? Hedge funds are simply opportunistic, based on their perception of how to turn a profit in any market condition. Unlike farmers that are always net sellers, hedge funds are net buyers when the market is in favor of buyers and net sellers when the market is in favor of sellers. With the combined volume of contracts bought and sold through them, hedge funds have the capability to quickly turn a bear market into a bull market – and a bull market into a bear market. (See July 2023’s Managed Money Part 1: What Has It Done for You Lately?)

    The question, of course, is how to use information about hedge funds to your advantage. Luckily, because hedge funds are (loosely) regulated, they are required to report positions (referenced as Commitment of Traders or COT data) on a daily basis.  This information is then released to the public every Friday afternoon by the Commodity Futures Trading Commission.  As a result, you have access to historical and real-time information on the funds that you can use as you make your marketing decisions.

    Movement within Limits

    Let’s take a look at a COT chart for corn, which is an easy way to assess how funds are positioned. The green represents daily net hedge fund positions for corn since 2006. Net long positions are above the line and net short positions are below the line. Overlaid in red is price over the same period of time, including the impact of rolled contracts.

    In general, you can see that, directionally, price and fund’s net positions move together, which is a good indicator of the fund’s influence on price. Despite this correlation, bear in mind that the charts can’t help you predict, generally, where positions or prices are headed. Every day, hedge funds are making decisions about whether to exit, hold, or get shorter or longer, based on their unique strategies and their reactions to the fundamentals. Trying to anticipate their movements is as fruitless as predicting the market.

    However…

    … as hedge funds become increasingly exposed long or short, fewer and fewer outside participants are willing to enter the market in the same direction. As a result, each hedge fund knows that the opportunity to lock in a gain is closing. It’s at this point that funds start reversing course. At extreme long or short positions, the sell-off of one fund triggers the next and then the next, and suddenly the market is changing direction. After all, hedge funds don’t want to be caught with a large position in an unfavorable market. And while the chart doesn’t promise you what prices will do, it does indicate that there’s a limit to how large a position the funds, in aggregate, are willing to take on before they start reversing their positions and influencing an often-significant market change. In other words, when the aggregate position becomes too long or short, there’s a point where the funds will only move in one direction: namely, to reverse their position, which also reverses price direction.

    How do you know if a corn market reversal is likely imminent?

    • Are funds long 300k – 400k contracts or are they short 150k – 200k or more? It appears that, once the funds reach these extremes, all they need is a trigger to set off a chain reaction of buying or selling.
    • What is going on fundamentally? The right or wrong fundamental can set off the market reaction when it doesn’t align with the currently held fund position.

    Bottom line? When the funds are extremely long, beware that the market could be near the top. Evaluate your sell strategy and make adjustments. When the funds are extremely short, practice patience before you make a sale. In both cases, a reversal is going to happen at some point. It’s just a matter of what sets it off.

    Let’s zoom into the chart to look at some examples:

    1. In 2013, the funds were long by around 300k contracts before the market reversed. What triggered the change? It appears prices were too high to be affordable, combined with a return to production and weather normalcy.
    2. In early 2019, funds were short by almost 300k contracts. Funds exited their short positions and went long as prices rallied, likely on the news of late planting due to flooded fields and the flooding of the Mississippi and Missouri rivers.
    3. In early 2020, funds increased their shorts from about 80k to almost 300k during the start of COVID, and then exploded into a long position of around 400k contracts, likely triggered by a shortage of corn and increased demand from China. Prices rallied by more than $4.00.

    What don’t you see? Any significant outlier in short or long positions that might cause you to wait to see if the movement would maintain direction.

    Keep in Mind

    It’s never a good idea to try to second guess or anticipate fund activity. Although they may act like pack animals at the extremes, within those limits they are unique entities managing strategies that probably don’t make any sense to outsiders.

    Instead, make sure you have a solid marketing strategy that prepares you for whatever the market may do, whether bull or bear, big or small. Make sure it includes incremental sales to help you capture bite-sized pieces of the market and to avoid missing out on a rally or waiting too long. Of utmost importance, build in ongoing analysis and flexibility to respond to market changes.

    Finally, work with your preferred farm marketing advisor to ensure that your plan aligns with the needs of your operation.

    Questions?

    Give Grain Market Insider a call at 800.334.9779

    Managed Money Part 1: What Has It Done for You Lately?

    We get it when farmers tell us how much they dislike commodity hedge funds (aka managed money) and their outsized influence on the market. It seems like the funds buy little by little, slowing down the rise of prices, and then they suddenly dump all their long positions at once, causing prices to plummet. Unlike other market participants who enter the market to turn your production into valuable products, it feels like hedge funds are just speculators trying to make a fast buck off your hard work. We’re not going to argue this with anyone, because, big picture, it’s true (and, really, aren’t we all in this to make money?). Although some of you have been wishing managed money away, we’re going to give you insight into how hedge funds and farmers interact, how that can affect prices, and the role they play in getting you a better price.

    How Hedge Funds Might Be Financing Your Forward Sales in a Favorable Market

    Let’s say prices look decent, and you think it’s a good time to make a sale on your grain in the field. You approach your co-op and enter into an agreement to sell grain based on the futures price and basis. To avoid market risk, your co-op doesn’t hold the futures portions on their books. Instead, they turn around and sell it immediately – and odds are good – to a hedge fund. Yes, a hedge fund. One of the reasons you could make the sale you wanted to make at a price that looked good is because a hedge fund was there to buy your position.

    While that’s good, why do prices seem to rise slowly in an up market? Both hedge funds AND farmers play a role in that. Let’s dive into farmer and hedge fund behaviors that support this phenomenon.

    1. The availability of hedge fund participation in the market makes it more likely for a buyer to be available when you want to make a sale (more liquidity!!).
    2. More potential buyers when hedge funds are seeing upside potential translates to continued higher prices.

    In this example, the number of buyers in the market is up. Why don’t we see a quick run-up in price? The quick answer is the built-in brake that slows down price increases.

    1. Managed money is interested in leveraging the perceived value of a particular grain – both upwards and downwards, and thus holds both long and short positions. Clearly, in a rising market, you can expect managed money to be net buyers and long to take advantage of rising markets. The key word here is “net”. While many funds go long (that is, are buyers), other funds might sell to exit existing long positions and lock in gains or even take a short position on a bet the market might fall. This means that hedge funds, as a whole, are potentially offsetting some of their buys in the market with sales in the market.
    2. Farmers collectively don’t hold everything until prices rise to a certain level (which would, in essence, put more upward pressure on prices) and then sell all at once. They do it little by little, and prices rise at a pace that tends to match the slow discovery of people able or willing to sell.  

    To sum it up, farmers benefit from hedge fund participation in the market because they make it easier for you to make the sales you want at a better price. However, between that participation and the pace of farmer sales, you can also expect a measured ramp-up of prices. So what’s going on in a down market and why does it feel as if prices fall like a brick?

    How Hedge Funds and Farmers Might Accelerate Price Declines in a Down Market

    Now let’s say the market is peaking. What sorts of behaviors can you expect?

    1. Remember how hedge funds were net buyers in a rising market? When the market turns, so do hedge funds as they become net sellers to lock in gains and go short to capitalize on a falling market. This puts downward pressure on prices, as the number of buyers decreases while the number of sellers increases. Depending on sentiment, this downward pressure can accelerate quickly if the relatively small number of hedge funds decide to go short rapidly.
    2. In contrast, remember how farmers are net sellers in a rising market? When the market turns, grain farmers continue to be net sellers, either by sitting tight or selling off inventory. Unlike hedge funds, they simply don’t play both sides of a transaction to influence the liquidity on the exchange as both a seller and a buyer.

    Take a moment to think about this in a rising market, hedge funds are buying what farmers are selling. In a down market, everyone is selling. This, in a nutshell, is why the market tends to go upwards slowly and downwards quickly. It has everything to do with a vastly unequal number of buyers in a down market vs. an up market, and the reality that farmers can collectively slow down a rising market, but not a falling market.

    Be Aware of How These Behaviors Affect Your Own Marketing Decisions

    Hedge funds create liquidity that help you garner better prices by increasing the number of buyers in the market. All in all, this allows you to capitalize on market potential that would be less readily available in a less liquid environment. However, with that advantage comes the need to adjust your own strategies accordingly. Some key elements to consider:

    • Make incremental sales in a rising market. If you sell too much too quickly, you will lose the chance to garner a better price as the market rises. However, we know hedge fund participation can contribute to fast price declines, so you don’t want to make a bet on hitting the top of the market.
    • Pay attention to extreme short or long managed money positions. They are both indicators that funds may want to start harvesting unrealized gains.
    • If your analysis shows that you are close to the top of a market on unsold grain, yet aren’t quite ready to sell, consider buying puts to protect yourself from downside risk.

    Next Month: Deep Dive into Reading Managed Money Charts

    Now that we’ve talked about how managed money and farmers interact to affect market prices, the next step is to understand how you can track the movement of managed money as you set your own pricing strategy. Next month we’ll take a look at the charts and discuss how to use the information to your advantage.

    In the meantime, if you have any questions about managed money or the markets in general, contact the Grain Market Insider team at 800.334.9779. We look forward to discussing that and how we can help you set a pricing strategy suited to the needs of your operation.

    ©August 2023.