Decision-Making for Unsold Bushels at Harvest – Weighing the Potential Costs and Benefits

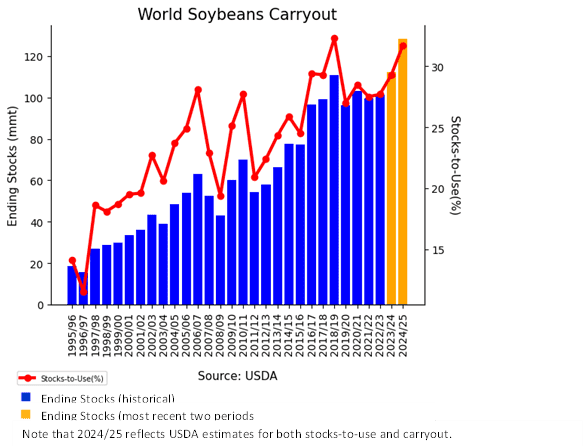
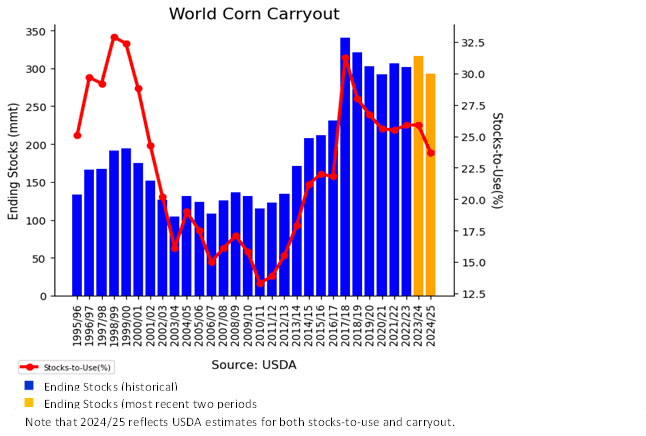
This year’s corn crop is on pace to be the largest ever in the U.S. While total U.S. soybean production is down due to fewer planted acres, the yield for farmers has been forecast to increase by an estimated 2.9 bushels/acre to 53.6 bushels per acre. You would hardly be alone if you were facing unsold bushels, inadequate on-farm storage, and the potential for heavily depressed prices at harvest. How can you try to sell the extra bushels you won’t be storing on farm at (hopefully) a better price in later 2025 or 2026? We will look at the pros and cons of four common solutions for delivering grain at harvest while retaining the ability to set the final price well after harvest:

  • Commercial storage
  • Delayed price (DP) contracts
  • Minimum price contracts
  • Basis only contracts

What Are the Costs of Waiting?

Keep in mind as you read this article that seasonals and historical price movements are not guaranteed, and may not be likely to occur in any particular year.

In general, we encourage farmers to make cash sales strategically and aggressively earlier in the crop year. Seasonality for both the futures price and basis tends to favor farmers who make sales closer to planting and earlier. In contrast, sales at harvest are generally less lucrative. Seasonality tends to go against farmers close to harvest, especially in years with ample supply. Importantly, monthly post-harvest costs for unsold inventory are not unsubstantial. It is imperative that you calculate the opportunity and out-of-pocket costs you would incur by month as you consider which solutions might make sense and for how long. 

Opportunity costs to you:

  • What are your scheduled cash flow requirements against cash on hand, including dates and dollars needed? How many months can you meet commitments before you need to cash out unsold bushels?
  • What is the opportunity cost to you of NOT selling, money that otherwise could have been used to pay off debt or earn income? As a proxy, calculate lost interest income by multiplying the futures price by the interest rate divided by 12. This equates to the monthly interest cost per bushel owned that should be included as an out-of-pocket cost in assessing your alternatives. 

Potential out-of-pocket costs and gains to you:

NOTE: The basis levels in the following examples are used for illustration purposes only and considered accurate as of August 2025. Your local basis may be different.

  • What is the typical rebound pattern for basis in your area, historically speaking? This can give you guidance on how long you might need to wait for basis to recover before selling. Here’s why this is important:

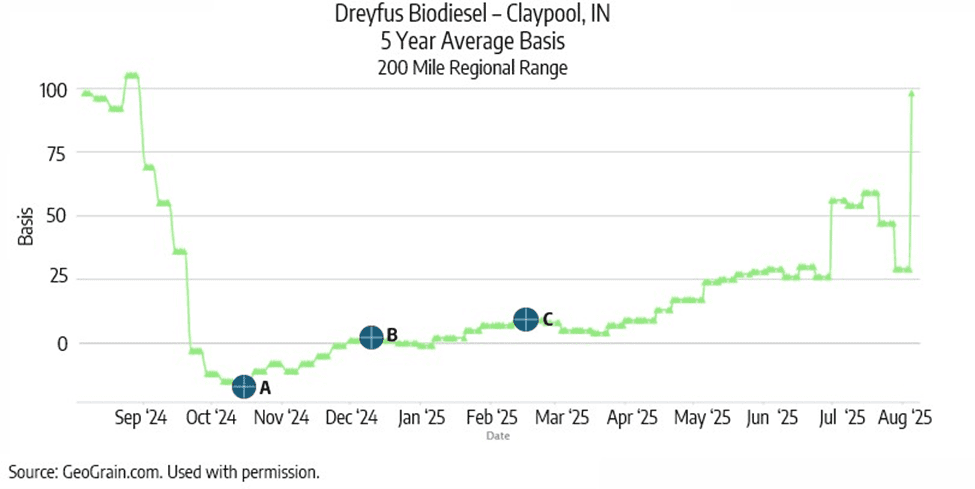
Let’s take a look at Dreyfus Biodiesel in Claypool, Indiana, the largest biodiesel plant in the U.S. The average 5-year basis at harvest is ‑0.17 November (point A in the chart below and 17 cents below the November futures price at the peak of harvest in October), moving up to +0.01 January (point B below and 1 cent over the January futures price) by December and then to +0.07 March in February (at point C below and a 24 cent rebound only 4 months post-harvest). This gives you an idea of how much you historically could have gained in basis by waiting just a few months to sell before considering any potential gains or losses in the corresponding futures prices.

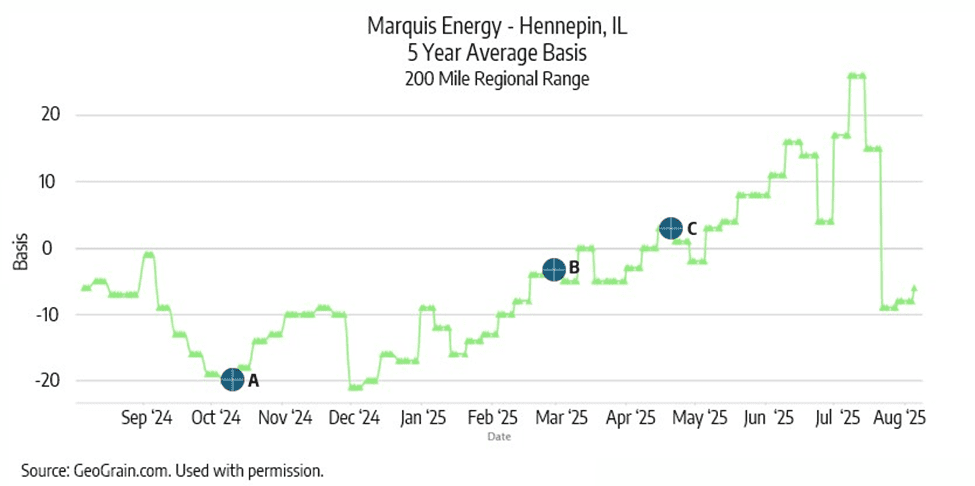
In contrast, let’s take a look at Marquis Energy, the largest corn ethanol plant in the Midwest out of Hennepin, Illinois. A five-year basis average shows the historical average swing from ‑0.20 December at harvest (point A in the chart below) to ‑0.04 March in (late) February (point B below and a 16 cent gain from harvest) to +0.08 July in May (point C below and a 28 cent gain). In this case, the potential payoff, historically speaking, takes longer than with Dreyfus. This means you may need to wait longer to sell, an important consideration as you consider which post-harvest strategy makes sense.

  • What is the market carry (the price difference between the nearby and deferred futures contracts), both now and (as you need to continuously watch) later? If the prices on deferred futures contracts are MORE than the nearby contract, this would indicate an oversaturation of supply in the spot market and the potential to make more in the future by waiting to sell.
  • What are the monthly commercial storage or delayed price charges you would be charged for stored grain at your elevator or buyer? What are the shrinkage charges, and is there higher moisture shrink for stored grain (corn discounted to 14.5% instead of 15.0% for example)?

Post-Harvest Solutions – Which Might Be Appropriate for You?

Outlining your cash flow requirements and potential monthly storage outlays will help you determine how long you can realistically hold onto the grain, and which, if any, of the following solutions are appropriate for you. The most important consideration is how long it will take for any improvement in prices to outpace the cost of waiting to sell. Here’s a simplified example of what we mean.

Say it costs $0.10/bushel/month to execute a post-harvest solution. What if basis historically takes five months to rebound for a total anticipated improvement between harvest in October and March of $0.27/bushel? That sounds great, except that you spent $0.50/bushel across all your incremental costs on that strategy from October through March. You need futures prices to also increase – by more than 23 cents – to cover your costs. You can continue to wait in hopes of better prices, but your costs will continue to eat away at gains. And don’t forget history doesn’t give you guarantees – basis and/or futures prices could get worse. In the meantime, remember you will need to make a sale at some point, most likely for cash flow. If you need it before prices rebound, your costs may outweigh any return. The more time you have, the better your opportunity to make waiting work in your favor.

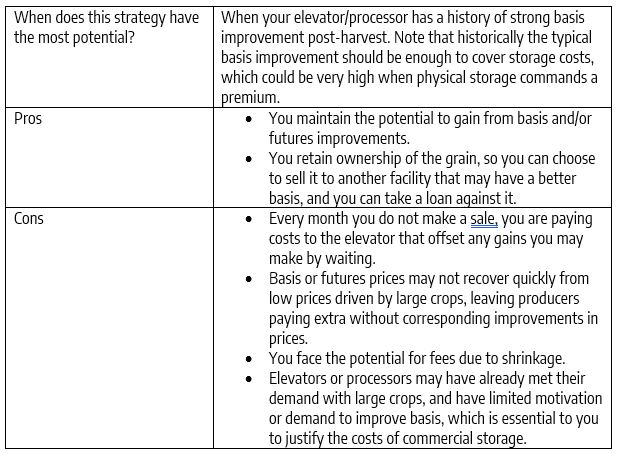
Alternative 1: Commercial storage through an elevator or processor

When you store grain commercially, you pay a monthly fee to your chosen elevator to store the grain. You retain ownership, may obtain a loan with a warehouse receipt, and can price the grain at the elevator when ready to sell or – if you choose – haul it to another facility. Do note that at sale, you may also be subject to additional fees due to moisture shrink.

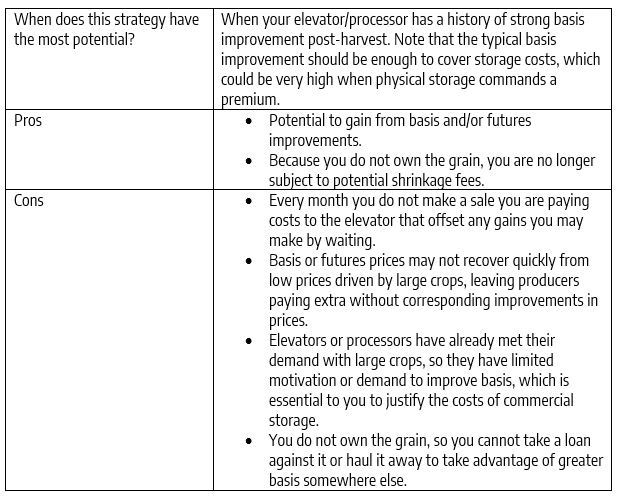
Alternative 2: Delayed price (DP) contract through an elevator or processor

A delayed price (DP) contract through an elevator or processor (also called a no price established [NPE] contract) is functionally similar to storing grain commercially. You pay a monthly fee to the elevator/processor until you set price. Unlike commercial storage, however, the elevator or processor takes control of the grain. They own it, and you have no ability to haul it away or take a loan against it. Essentially, you pay a fee until you set the price.  

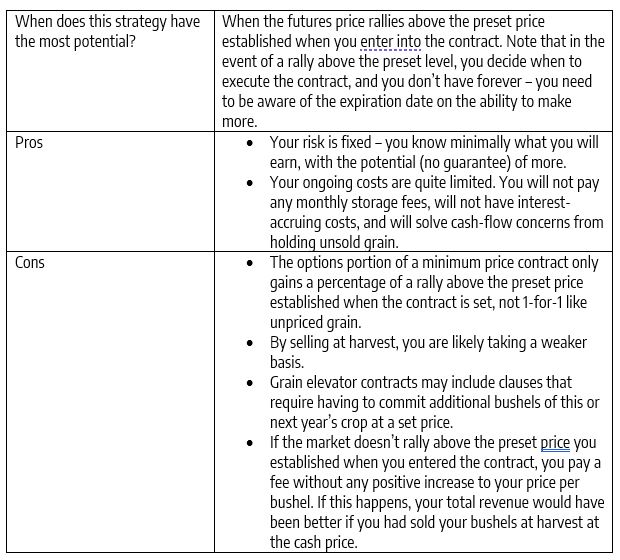
Alternative 3: Minimum price contracts through an elevator or processor (and, in some cases, your broker)

For a fee, many elevators offer a minimum price contract that establishes a minimum price for your grain with the potential to earn more if the market rallies later – specifically, the potential difference between a higher market price and a preset price when you enter the contract. You can also create your own minimum price contract by making a cash sale and buying a call option(s) with your broker.

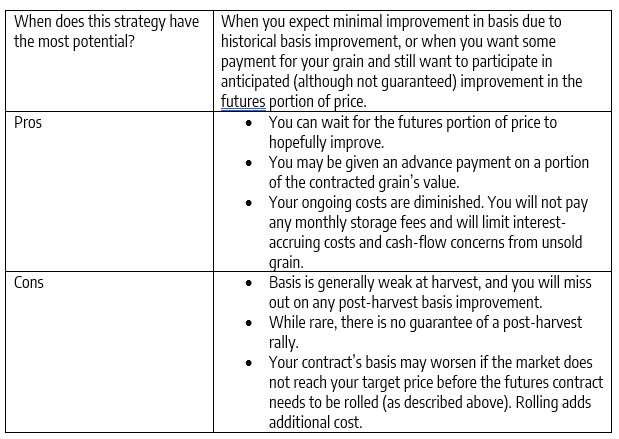
Alternative 4: Basis only contract

With a basis only contract, you set the basis portion of the price for your grain at harvest, and then you establish the futures price later. Note that when you enter into a basis only contract, you need to lock in the futures price before the futures month that the contract was written against expires or the contract is rolled into the next futures month. December corn futures will typically need to be rolled to March (or beyond) by Thanksgiving. November soybean futures will need to be rolled to January futures or beyond by Halloween. Sometimes the spread between these months makes it possible to initially write the contract off the deferred futures, but with big crops on the horizon, that is unlikely.

Make the Best of This Year and Prepare for Next Year

The old adage that the best defense is a good offense is especially true for producers. Though there are no guarantees, making your sales early may reduce or even eliminate your marketing costs, may improve your cash flow, and has the potential to build a better weighted average price. Ultimately, it gives you less to worry about at harvest. Emotionally, it’s hard to make decisions about all your crop when you don’t know how much production you ultimately will have, yet it’s also hard when you have too much.

So talk to us. We can help you evaluate the best decision for your unsold bushels this year, and we can help you make decisions about next year’s crop. We’ve helped farmers work through these pricing decisions for over 40 years, and we’d be honored to help you.

Taking Measure of the Market Temperature

One of the costliest misunderstandings about financial or futures markets is the belief that current prices are rational and reflect true economic value. While we all might like to believe that market prices are a straightforward reflection of supply and demand, the reality is that prices more accurately reflect where buyers and sellers speculate the value of a company or commodity to be in the future.

  • Where the price for a company keeps rising with no revenue or sales, investors may be betting the company will one day be the equivalent of a Microsoft or Google.
  • Where prices for corn keep falling in spite of tight supplies, buyers might believe that ethanol subsidies are going away or that a large crop is on the horizon.

Anyone can easily study the supply and demand fundamentals or make projections of future demand or yield estimates. In the end, that is not what determines how high prices can go or when a bull market is going to end. So what are you supposed to do, short of getting a degree in investor psychology? (Which, by the way, still won’t give your crystal ball any clarity.) Though there are no guarantees that history will repeat itself and seasonal price moves may not occur every year, here’s one straightforward shift in thinking for you:

Instead of focusing simply on price changes or supply and demand, focus on recognizing patterns, including those moments when it seems like everyone agrees the market has changed forever, for better or worse. You may want to think of it as “taking the temperature” of the market.

Study Previous Bull and Bear Markets

In order to recognize when a market may be hitting a high or low, it’s valuable to study past market extremes, paying close attention to patterns that repeat themselves. Unfortunately, despite the preference of many farmers, examining past fundamentals prior to hitting the top or bottom of a market is often too varied, inconclusive, or market-specific. Technical analysis can be key in determining when a bull or bear market is running out of momentum and possibly coming to an end.

Consider the corn market during the first two months of the year as a good example of how technical analysis can be more illuminating than fundamental analysis. A bullish WASDE report on January 10 surprised the market with a lower production estimate and tighter supplies. As a result, March corn futures rallied from a low of $4.53-1/2 on January 9 to a high of $5.04-1/2 on February 19. By March 4, the March corn contract traded to a low of 4.26-1/2, lower than it was trading before the January 10 report.

As a corn seller or speculator, how would you have known to exit the market before the rally ended? After all, from a fundamental standpoint, nothing had changed. Export demand and ethanol production remained strong, and U.S. ending stocks on the February WASDE report remained flat. One clue that the rally was possibly coming to an end was the poor close for the week of February 17, signifying a bearish reversal on a candlestick chart (as circled on the chart below). This technical pattern can be a reversal signal after a significant move up or down.  

July 2025 Corn Chart: Bearish reversal on a candlestick chart the week of February 17 hinted at the end to a rally:

Guard Against Moments of Excessive Optimism or Pessimism

During periods when the market is neither high nor low and most of us don’t have a lot of emotion around it one way or another, we are all pretty sure the market could go up or down on any given day. As marketers, you plan when to sell, and then act accordingly. The danger lies in those periods that seem unlikely to end, whether for good or bad.

To fight the emotion during extremely optimistic or pessimistic times, you may need to consistently employ a methodical, analytical approach. Every day, think about how bullish or bearish the news is on the radio or TV, or how optimistic or pessimistic the talk is in the coffee shop. At the same time, evaluate how optimistic or pessimistic you are personally feeling, and try to rate that on a scale from 1 to 10. Paying attention to when your own market sentiment is hitting extremes can help you to take action when you think the markets can only go higher and avoid selling when it seems like prices can only go lower.

In Extreme Times, It Often Pays to Be a Contrarian

When emotions are running high for farmers and analysts, prices can move to unsustainable levels, both to the upside and downside. In times like these, a key attribute of good marketers is to be able to do the opposite of the consensus. With grain marketing in particular, it can be very beneficial to keep in mind the time of year. Bull markets typically peak sometime between March and July, and bear markets typically bottom between September and December.

One of the most recent periods of excessive pessimism for the soybean market was during the month of December 2024. The March soybean contract went from a high of $9.99-1/2 on Monday, December 16 to a low of $9.47 on Thursday, December 19. The focus during that week of price contraction was on large U.S. and global ending stocks, a potentially larger Brazilian crop than the USDA was currently forecasting, and possible loss of export demand due to tariffs. Facing these issues after the sell-off, several clients asked if they should be selling soybeans before prices fell even further toward $8.00, especially since it seemed like everyone around them was selling before things got potentially worse. As always, we don’t know exactly what the market will do or when. We advised clients not to sell for a few reasons:

  1. It was December, not typically a good time to sell unless prices have recovered from the harvest lows. The market had been trending mostly sideways since August and there was still time for weather to reduce the size of the South American crop.
  2. Managed money funds were net short (although not nearly as short as they were in July and August) and the best time to sell is typically between March and July. In other words, past patterns suggested that sellers wait.
  3. Finally, we felt that maybe, just maybe, we were approaching that bottom when it felt like things could only get worse.

On Friday, December 20, March soybean futures closed at $9.79-1/4, which was 32-1/4 cents above the low on Thursday, December 19. By January 10, March soybean futures closed higher for the week and above resistance at $10.25-1/4. March soybean futures continued to rally until February 5, topping out at $10.79-3/4, which was $1.32-3/4 above the December 19 low. In this case, being the contrarian paid off.

July 2025 Soybean Chart:  Waiting out the sell-off in December benefited patient farmers

Our analytics team doesn’t just track the data — we decode it. We help you anticipate moves, understand the models, and position your marketing strategy before the rest of the market catches up. Turn uncertainty into opportunity. Tap into a partner that understands the nuances behind the reports — and leverage them.

Take the Emotions out of Marketing

Much of what happens in economies and markets doesn’t result from a mechanical process; rather, from human emotions. Also, remember that humans are very susceptible to recency bias. If the markets have been good, people tend to think they’ll always be good. If the markets have been bad, people tend to think they’ll always be bad. The reality is that the market and the emotions driving it are always in motion, and your job is to take note of the swings and take advantage whenever possible.

Resist your own emotionality. Stand apart from the crowd and its psychology; don’t join in! Taking the temperature of the market and asking yourself how you are feeling about the market on a daily basis can help you be prepared in times of extremes. Working with an advisor at Total Farm Marketing can also be a great way to avoid the dangers of your emotions when you market. We can help you understand the patterns that drive good decision-making. We can help you determine when it seems best to take action, and when it seems best to sit tight. We’re also that partner you want in any market environment – consistent, focused on you and your operation, and dedicated to your marketing success.

Capturing Price by Looking Behind the USDA Curtain

We’re entering the most critical time of the year for you as a grain farmer – generally, the time of maximum uncertainty in the market. What yield will you and every other farmer get for your crop, and how does your bottom line compare to last year? How will demand for your crops fluctuate? Will the weather favor you and your fellow farmers?  Just as you make decisions in uncertainty, so does the USDA. Initial, models-based estimates of yields influence the prices and farm income like a shockwave. As the corn season matures, so does the quality of the estimates, as the USDA turns from pure modeling to boots-on-the-ground data to generate its important monthly WASDE report.

Does this mean that the USDA data early in the season – like now – is garbage? No – USDA modeling has proved beneficial and directionally accurate in giving you and other buyers and sellers intelligence about decisions you need to make now. Nonetheless, always remember that prices early in the market are an indicator of the sentiment of the market based on where models (and people) think the market might perform vs. hard data using actual results.

Let’s be clear – it is critical for you to be on top of how the USDA’s estimates move as they turn from speculation to fact. Check out the seasonal chart below. It’s no coincidence that prices tend to be at their highest during the highest uncertainty. After all, the greater the risk, the greater the potential reward (or loss). As the USDA accumulates and utilizes more data, the markets become more certain along with those higher prices, generally speaking. Thus, it is imperative that you understand the methodologies behind the underlying estimates as the summer progresses, to prepare yourself to take action if and when opportunities arise.

USDA Corn Yield Estimates: Constructing the Basic Building Blocks

The USDA looks to two branches within its organization to build models and to acquire data in order to create the estimates and data you use from the monthly WASDE report.

  • The World Agricultural Outlook Board (WAOB) is the forecasting and policy arm of the USDA and is primarily responsible for WASDE report generation overall, in addition to the forecasting content for the May-July WASDE reports. Initially in the season, it relies on crop weather models, historical trends, and subjective judgment. Deeper into the summer, it increasingly incorporates surveyed and observed planting, yield, and weather data into its forecasts and reporting.   
  • The National Agricultural Statistics Service (NASS) produces farmer surveys and direct observations used by the WAOB, as well as for its own statistically robust estimates in its Crop Production reports used in the August-April WASDE reports.  Ultimately, the accuracy of farm data belongs to this branch.

Because the WASDE reports from May-July are only based on WAOB modeling, they drive speculation as to what the market will do and we’d expect those reports to generate more volatility. After all, people use that information to speculate where the market will go. Research by our own analytics team bears that out. Analyzing data from the past 25 years shows that the June WASDE report ranks as the second most volatile USDA report in terms of same-day market reaction. Additionally, it holds the top spot for driving market volatility over the two weeks following its release, underscoring its lasting impact on price direction. As data firms up after July, so too does price.

Key Considerations as You Evaluate the Impact of WASDE on the Market

Without question, you need to understand the big picture behind WASDE reporting, especially because of the significant market impact of the reports in June, July, and August on your potential bottom line. The table below outlines the foundational information that drives WASDE content (that is, model-driven vs. current data-driven). Here are a few things you’ll note and need to keep in mind as you review how the reports are generated:

  • The June and July WASDE reports are based solely on models, trends, and analyst judgment. As a result, they are more subjective in nature. In later reports, the WAOB relies increasingly more on actual data and accordingly less on modeling to create their monthly estimates. As a result, the information in the August and September reports is increasingly precise, and the most accurate data and reporting is available in November.
  • WAOB’s early “normal” weather assumptions may overestimate yield. This is compounded by the fact that July precipitation alone is critical in the July report, whereas later months reflect cumulative impacts.
  • The market as a whole suffers from the lack of clarity around the WAOB methodology, as well as understanding the transition from WAOB-driven reporting to the NASS-driven in August. These factor in market confusion and how the market may react to reporting.
  • The WASDE reporting is focused on the macro picture for agriculture. As a result, national estimates mask regional differences.

In a volatile market, knowledge is power – and timing can mean everything.

June and July USDA reports are among the most volatile of the year because they blend historic trends, weather models, and educated guesses. August through November reports shift to survey-driven precision, making it easier to trust the numbers. By then, many marketing opportunities may have passed.

That’s why you need Grain Market Insider in your corner.

Our analytics team doesn’t just track the data — we decode it. We help you anticipate moves, understand the models, and position your marketing strategy before the rest of the market catches up. Turn uncertainty into opportunity. Tap into a partner that understands the nuances behind the reports — and leverage them.

References:

For detailed methodology, refer to USDA’s Crop Production and WASDE reports at nass.usda.gov and www.usda.gov. See also:  https://www.nass.usda.gov/Newsroom/Executive_Briefings/ and https://www.usda.gov/world-agricultural-outlook-board

A Shifting Crop Rotation Approach in the Time of Tariffs?

It’s that time of the year when farmers are once again deciding what adjustments to make to their crop rotation. As always, many factors weigh into your decision-making, like input costs and anticipated demand. Even more unsettling, you’re facing another complication – the threat of tariffs. Obviously, memories of the negative impact of the 2018 Chinese tariffs are enough to give you heartburn at the thought of another round, and many across the ag industry share those concerns as they anticipate an aggregate two to seven-million-acre swing from soybeans to corn. As the drum beats toward a shift away from soybeans, you may feel some pressure to do the same.

Before you start executing wholesale 2025 crop decisions, however, consider that your decision may not be entirely risk-free. Say you make a shift and the tariffs never materialize – would you have made changes only to have been set up for another bad revenue year? And what is happening to the other variables that affect your crop rotation decisions in any year? Remember that one variable alone is almost never the sole predictor of what a market will do, or what makes sense for your operation. With that in mind, let’s take a close look at some of the other factors that may affect prices and your decision-making in 2025.

Increasingly More Soybeans and Less Corn

Even if tariffs weren’t looming, the world carryout for soybeans and corn would lead you to consider a shift to corn. Take a look at the World Soybeans Carryout chart below. Per the USDA, carryout rose in the 2023/24 crop year (ending August of 2024), and is estimated to hit a new high in 2024/25. Similarly, the stocks-to-use ratio also rose in 2023/24, and the USDA estimates it will rise again in 2024/25 to just below the 2018/19 high. In layman’s term, this means that the USDA estimates we will have a glut of soybeans through at least 2024/25. Furthermore, a glut in supply correlates to a flat or decreasing price.

In contrast, look at the World Carryout Chart for corn below. Although ending stocks are far greater than they were prior to 2017/18, ending stocks for 2024/25 are estimated to be roughly flat from the previous number of years. More telling, the stocks-to-use ratio continues to decline, telling us that the amount left over every year is decreasing as a percent of demand. All things being equal, this is an indicator of a stronger price trend. From an apples-to-apples comparison (or to put it more bluntly, even absent a trade war), the two charts together imply stronger performance for corn vs. soybeans from a more global perspective.

Does It Make Sense to Make a Big Shift at the Farm Level?

Potential revenue, of course, is only one half of the equation when you’re deciding the best economic strategy for your operation. You also need to consider expenses pertinent to your operation as well as factors such as yields, land rent, and basis, aligned to your location. The 2025 University of Illinois farmdocDaily Corn and Soybean Budgets for Northern, Central, and Southern Illinois (table below) illustrates just how much of a farm’s profitability is affected by the crop rotation choices made.

Very quickly, note that the analysis done by University of Illinois pays attention to comparing corn and soybeans across variables such as yield per crop, direct costs, power costs, overhead costs, and land costs. This is something you can do to help you determine how much your revenue and costs are affected by the choices you make concerning the portion of your acreage devoted to each crop.

Keeping in mind all that’s above, let’s take a longer look at the last line in the table, called Corn minus Soybean Return. University of Illinois estimates that soybeans in northern Illinois will yield $15 more per acre than corn, while in southern Illinois corn yields $13 more per acre than soybeans yield. That’s an incredibly large differential in profitability per acre from the top of the state to the bottom of the state based on the crop. As you head toward the middle of the state, prices tend to even out a little bit, being a bit more suited to soybeans more northerly and more suited to corn more southernly.

The implications from the information above means that, for more northern farms, any movement away from soybeans would be more risky because the farming environment is so biased toward soybeans vs. corn in spite of any potential price advantage for corn. Alternatively, as you move more to the center of the state, a shift in mix away from soybeans toward corn would be a safer crop rotation, as the corn minus soybean return is closer to 0.

Source: Revised 2025 Crop Budgets – farmdoc daily

What Should You Do?

Living with unhappy memories like those from 2018 has the immediate impact of wanting to do something different when the same situation arises; the most logical step seems like it should be changing your crop rotation. This urge is supported by expectations of acreage shifts to corn at the macro level and anticipated price changes. However, it’s also important to make sure that any shift coincides with the economics and realities of YOUR operation. To help you make a decision, make sure you consider the following:

  1. Put together a budget that borrows from the good work of University of Illinois. Make sure you understand the economics of your operation from the production of both corn and soybeans.
  2. If your return per acre of corn vs. soybeans are roughly the same, consider some shift in acreage, especially if you think that tariffs will indeed occur.
  3. Regardless, remember that a well-designed marketing strategy can help protect you in case of adverse market movements. In other words, use hedging tools to protect your price vs. major shifts in the way you make your rotation decisions. This will help you maintain a comfort level with your farming strategy while your marketing strategy works to protect price.

At Grain Market Insider, we help farmers like you make informed marketing decisions every day. Furthermore, we will advise you in a manner that best fits you. That may be one decision at a time or within the context of a multi-year, flexible plan for every commodity on your farm.

The Danger of Making Sales with the Biggest Segment of the Market

In our August 2024 Insight, we discussed the apparent shift from a September to August seasonal low. As you might recall, a major contributor to this shift appears to be the large increase in on-farm storage. The many farmers who fail to move their grain throughout the year have found themselves with bins full of grain as they head into harvest, forcing them to offload grain at the end of summer.

Take a second to think about the implications of this seasonality change. To all appearances, new behavior across a large bloc of producers has literally changed seasonality expectations. Unlike relatively smaller segments like processors, exporters, or managed funds, farmers (via the sheer volume of supply they bring to market) have an enormous – if not the biggest – impact on prices among market participants.

Taking this a step further, this means that if you market when most other farmers are marketing, you’re going to be primarily a price taker as the influx in supply drives prices downward. From your point of view, it is potentially far more lucrative to take a more contrarian view and make your marketing decisions strategically and methodically, mindful of how group selling behavior can help you make decisions beneficial to you. Furthermore, bear in mind that other market participants pay close attention to how farmers are marketing as a whole to attempt to maximize their own profits. Let’s take a look at how managed money capitalizes on the marketing habits of farmers and then think about the implications for you.

Managed Funds Made Money This Summer with the Help of Farmers

While managed funds are a major market participant, their positions in the market are dwarfed by the collective supply delivered by farmers. In fact, their largest positions have been about the size of carryout in contrast to the entire crop delivered by farmers. Instead of thinking about the size of their position, think about how adept they are at using their knowledge of the market and collective farmer behavior to successfully speculate.

Take corn this past summer, for example. Managed funds saw that farmers as a whole had a significant volume of grain in on-farm storage. On June 1, 2024, farmers held 3.03 billion bushels of corn in on-farm storage. Most (if not all) of this grain would likely come to market before harvest in order to clear space for new crop bushels. (See USDA June 28 Grain Stocks Report.) The opportunity for managed funds? Short the futures market, knowing that most (if not all) of that stored corn would come to market in the coming months before harvest, likely at a lower price.

Let’s take a look at how managed funds behaved with the knowledge of collective farmer behavior.

Shorting the Market in a Falling Market (see chart below table for price chart for Dec 24 corn)

It’s easy to see this short strategy as a success for managed funds. They saw that the farming segment held more bushels to sell than what the market was prepared to absorb. They developed an approach to capitalize on this knowledge by selling contracts at a higher price with the objective to buy them back later at a lower price. Did their short positions dampen prices earlier in the season? Possibly, and only because they counted on the sales of stored grain, and prices to fall accordingly. In the end, the managed funds’ strategy only worked because farmers held onto huge stocks of grain as harvest approached.

What Does This Imply for Individual Farmers?

Every segment in the market needs to set a strategy centered around their own unique needs and situation. Unlike managed money, who at any moment can be long or short, grain farmers are almost entirely short the market – always having grain to sell and not looking to buy. As a result, the strategies taken by managed money is different from what we would advise a farmer.
The big takeaway is this: If you sell at exactly the same time as most farmers, your price will be driven by the huge impact farmers have on supply. Instead, work toward being strategic, methodical, and somewhat contrarian:

  • Remember that those storing more and more of your grain are in search of a higher price. If you hold out until harvest (as many do), you are simply paying to store grain only to sell at the harvest low. Instead, design a plan to sell your grain throughout the year.
  • Consider making periodic sales throughout the year at advantageous times so that you can take advantage when the demand is higher and the supply is less readily available.
  • Seek advice from professionals like the consultants at Total Farm Marketing. At Total Farm Marketing, we help you make solid decisions that take the emotions out of marketing so that you can make decisions based on math and solid analysis.

Are You Missing Out on Higher Prices?

The other day I heard a group of GenZers throwing around the term FOMO – fear of missing out. It’s a newish term for an overwhelming apprehension that friends and acquaintances are having rewarding experiences that you aren’t part of, triggered by doomscrolling on social media.

This might sound a little familiar to a farmer. Many suffer from their own form of FOMO year after year. It goes something like this:

  • Read conflicting market news and reports without consistently clear direction (because, really, you can’t predict the market with any certainty).
  • Sit tight on making sales because you worry that, unlike fellow farmers, you might miss out on higher prices.
  • End up missing out on better prices for the most part and instead selling at a lower price on average.

In other words, FOMO for farmers can actually cause their fear to become their reality, especially if you look at average revenue over time.

Can You Really Reduce FOMO and Increase Your Average Price Potential?

It’s very possible to increase your revenue potential over time: stop chasing the highest price and instead make sales on a consistent basis when, historically, the odds are in your favor. Yes, yes, yes, it sounds boring and even risky (after all, you’re giving up on the idea of getting the BEST price), yet the math shows that this lower stress approach may offer you a potentially better average price over time. To illustrate what we’re talking about, let’s do the math on two hypothetical farmers, FOMO Freddy and Steady Eddie.

FOMO Freddy’s marketing strategy

FOMO Freddy is very focused on getting the best price. He likes to make sure he allows for sales throughout the year, because he knows that high prices can happen at any time based on different events.

  • Bear in mind, he does need to make sure he generates enough revenue with sales to keep operating the farm, and as a result makes sales when necessary. In other words, in order to maintain the potential for the highest sale, he also (from time to time) might need to make sales at seasonally lower prices to generate needed revenue.
  • This approach has the potential for incredible marketing years if the timing is right. However, bear in mind that this approach is a bit like gambling. How many years in a row can you beat the House? (Or in this case, the average return of the market.)

Steady Eddie’s marketing strategy

Steady Eddie, on the other hand, sticks to his plan religiously. He knows by the historical price charts and experience that prices tend to be historically higher between March 1 and June 30 (see the historical pattern chart below). As a result, every year prior to harvest, he incrementally sells 50% of his crop between March 1 and June 30. He sells the remaining 50% incrementally the next year, again between March 1 and June 30. With this approach, he is never boxed into selling his crop near the harvest low.

  • Bridging sales between years can make a big difference on your average price, even in years with a large projected yield. To be sure, anticipated supply rises and prices fall accordingly heading into what might be an expectedly large harvest, and early sales may be less advantageous in the end when supplies shrink and prices rise. However, they can be averaged with the better prices attained with later sales the following year.
  • Steady Eddie avoids leftover inventory and not enough new crop sold heading into harvest and the post-harvest part of the marketing year.
  • In return for the consistency and reliability of this approach, he forgoes the potential to make sales during any high price period outside of the window of his plan.

Looking at the Math

In order to illustrate the potential of Steady Eddie vs. FOMO Freddy over time, we’re going to look at how their strategies play out, on average. We’ll do that by pricing out their returns based on daily averages from 1988 through 2003.

  • Both Steady Eddy and FOMO Freddy have a crop size of 100,000 bushels on 500 acres (or 200 bu/acre)
  • Steady Eddy sticks to his plan and sells 50% incrementally between March 1 and June 30 pre-harvest and then again between March 1 and June 30 pre-harvest the following year.
  • FOMO Freddy only sells 10% of his crop between March 1 and June 30 in the hopes of better prices later in the year. To generate a revenue comparable to Steady Eddie by year end, he sells slightly more than 40% of his crop between September 1 and November 30. He follows the same approach the following year with less than half his crop.

Pricing assumptions:

  • The Mar-June average price for pre-harvest sales made in spring is the average daily price for that time period for the years 1988-2023 using the December futures contract.
  • The Sep-Nov average price for the harvest sales for old crop and new crop is the average daily price for that time period for the years 1988-2023 using the December futures contract.
  • The Mar-June average price for spring to sell the second half of the previous year’s crop is the average daily price for that time period for the years 1988-2023 using the July futures contract.
  • Basis levels are typically weaker at harvest. In this case, we assume a 10 cent weaker basis for the bushels sold just before or during harvest than the bushels sold between March 1 and June 30. This isn’t always the case. In rare cases, such as this year in some areas, basis levels can be 20-30 cents lower at harvest than other times of the year.
  • We are not accounting for the costs of commercial storage, DP charges, or interest.

Under this scenario, Steady Eddie could potentially make $58.40 MORE per acre than FOMO Freddie. That equates to $29,200 more per year on 500 acres or $58,400 on 1,000, or $730,000 and $1.46 million, respectively, over 25 years!

There may be some among you rolling your eyes a little at the scenario above. After all, who would really behave like FOMO Freddie year after year? The advantage to his approach is the flexibility to adjust when sales are made year after year to account for opportunity. In this scenario, FOMO Freddy will sell grain more evenly at the run-up of prices in spring and then close to harvest. Let’s take a look at what happens:

    • Both Steady Eddy and FOMO Freddy again have a crop size of 100,000 bushels on 500 acres (or 200 bu/acre)
    • As in the first scenario, Steady Eddy sticks to his plan and sells 50% incrementally between March 1 and June 30 pre-harvest and then again between March 1 and June 30 pre-harvest the following year.
    • FOMO Freddy sells 25% of his crop between March 1 and June 30 (up from 10% in the previous scenario) in the hopes of better prices later in the year. To generate a revenue comparable to Steady Eddie by year end, he sells 27,000 bushels of his crop (2,000 more than in the spring) between September 1 and November 30. The following year he sells half his remaining crop (24,000 bushels) between March 1 and June 30 and then the rest of it between September 1 and November 30.

    Pricing assumptions: same as Scenario 1

    Under this scenario, Steady Eddie could potentially make $37.38 more per acre than FOMO Freddie. That equates to $18,690 more per year on 500 acres or $37,380 on 1,000, or $467,250 and $934,500, respectively, over 25 years. Again, saving sales for historically lower prices in the hopes of higher prices sets you up for lower average prices.

    Now, realistically, these are hypothetical numbers. Consider the assumptions that got us to this hypothetical revenue differential and remember that it’s MUCH easier to replicate a more accurate number for a consistent approach than one that changes year over year. And then think about how often you beat the averages with the approach you generally take, especially if your approach is more like FOMO Freddy’s. Realistically, for many, the consistent approach is more reliable and offers greater potential return even if – especially if – you marketing isn’t focused on hitting the high.

    The Bottom Line

    At the end of the day, it’s all about the bottom line. However, it’s more than that.

    • It’s about your peace of mind and knowing that, over the long term, your best bet to get the best average price lies in consistently pricing your crop during timeframes that offer the best chances of offering the best prices.
    • It’s about more consistent income, especially in years of low prices, which allows you to expand your operation every year, not only when prices are abnormally high.
    • It’s about the potential to lower overall interest costs. As money comes in on a more regular basis, it can help reduce any interest paid with smaller earlier payments versus later and larger payments.
    • Consistent marketing helps with cash flow … always having grain sold prevents having cash flow issues and again, the need to sell at inopportune times.
    • Finally, consistent marketing helps you avoid expensive commercial storage or delayed pricing fees by having enough sold ahead of harvest.

    At Grain Market Insider, we’re close to celebrating 40 years of helping farmers make smart, consistent decisions about their marketing. Talk to us about how we can help you eliminate your FOMO.

    Why Has August Been Feeling So Low?

    Much like death and taxes, producers have always been able to anticipate that the seasonal low for corn would likely happen during harvest. After all, farmers without storage have needed to sell their grain at harvest, thus infusing a huge supply of grain into the market and driving down prices. And although seasonal lows can occur any time around harvest, on average over the past 30 years, the seasonal low has favored a later seasonal low of October 2.

    Yet, as you can see in the historical chart below, over the last five years the seasonal low for December corn has shifted quite early to the 20th of August. This implies that the bulk of corn sold based on December futures has been occurring closer to the very end of the summer.

    This begs the question – what has systemically changed? And how does this impact how you market your grain?

    What Could Account for the Shift in Seasonal Lows?

    If you’re thinking back over the past five years on events that could have shifted the average seasonal low date so significantly, you’re likely thinking of big weather events like the Midwest Derecho of August 2020. This storm and its major damage to corn and corn storage sent futures on a multi-month rally that plays a significant role in the last five years of price action for corn. Clearly, these sorts of major events affect averages. Nonetheless, weather events occur regularly, and their impacts have always been represented in the averages. Thus, weather events play some role, but perhaps not the entire role in the change to the 5-year harvest low average.

    Nonetheless, weather events occur regularly, and their impacts have always been represented in the averages. Thus, weather events play some role, but perhaps not the entire role in the change to the 5-year harvest low average.

    The next consideration is a consistent decrease in the demand for corn late in summer. While demand always fluctuates, we could not identify any permanent change in demand affecting the timing of a seasonal low.

    Finally, the last consideration is a consistent increase in supply. While actual supply hasn’t changed, we realize a change in how farmers choose to release their supplies, and significantly. More specifically, over the last twenty years, many farmers have made the strategic decision to invest in grain storage infrastructure. This allows them the flexibility to improve harvest logistics and better time marketing decisions.

    How much have storage capabilities grown? Between 2003 and 2023, U.S. farmers expanded on-farm storage nearly 20% from about 11 billion (page 27, 2003 NASS Grain Stocks) to 13.6 billion bushels (page 30, 2003 NASS Grain Stocks), primarily in the Corn Belt states of the U.S. In 2023, Iowa was estimated to have 2.05 billion bushels of on-farm grain storage, a 400 million bushel jump from 2003. Illinois added an estimated 300 million bushels of grain storage capacity over the last two decades while Minnesota added 350 million of storage during this same time period.

    Still, could this increase in storage really shift the seasonal low window forward? This undoubtedly could have an effect if farmers are selling a majority of their newly stored grain in August in anticipation of filling their storage again with new crop at harvest. This “tin can marketing” essentially floods the market in August vs. at harvest, contributing to a new timeframe for seasonal lows.

    Strategic Marketing Is Even More Important If You’re Storing Grain

    Storing grain offers you advantages as a marketer and comes with additional costs and resulting risk. To be sure, on-site storage offers you the ability to sell on-hand grain throughout the year at hopefully advantageous times. However, you need to make a financial investment upfront to build the infrastructure. Don’t lose sight of the fact that storing grain adds incremental costs annually to your business in the form of drying and managing your stored grain. While maintenance costs might seem insignificant, the costs to maintain the quality of your grain can really add up over time. With this in mind, the very last thing you want to do is to keep holding your grain in storage and then selling the bulk of it at the seasonal low in order to empty the bin. You need to be prepared to act and to sell your grain throughout the year with the goal of building the best possible average price.

    At Grain Market Insider, we take a strategic approach to farm marketing. We have helped farmers market their grain for almost forty years focusing on both cash and futures decisions for grain already harvested, grain yet to be harvested, and grain not yet planted. We can help you set up a plan that prepares you for whatever the market does rather than on what you hope it will do, and to do it before the seasonal low comes around again.

    Call us at 800.334.9779 to learn more.

    “Just Do It” Isn’t Good Enough

    When it comes to marketing, how many times have you told yourself to just do it and you just…don’t? Even when you feel like you really should. Here’s an analogy which might help you relate to why it’s so hard to take action:

    Recently a friend went to the orthopedist for a nagging injury. The doctor took a look at her MRI, took a few minutes to tell her his diagnosis and recommended that she schedule a cortisone shot. Great, right? Except, in spite of the time the doctor took with her, my friend doesn’t really feel like she knows enough to make a solid decision.  She’s not sure what activities she should or shouldn’t be doing to avoid injuring herself further after she gets the shot. She’s wondering if a cortisone shot is the best solution given her activities. Furthermore, she’s more than a little concerned about her future prognosis. Upon her return home, she spent far too much time on Google and talking to friends, and all that conflicting “research” did was make her feel more anxious. So, yes, she’s gotten good advice, yet she doesn’t feel confident acting on it.

    My friend’s experience and frustrations echo how many farmers feel about marketing.  A marketing guru can tell you what to do, and still may feel like you don’t have a clear understanding or context for the decisions you need to make, especially with all the competing information at your fingertips. Furthermore, you may feel like you’re pretty adept at understanding HOW to make a decision (like making a sale or buying a put). Still, that doesn’t mean you’re entirely comfortable understanding why this solution is best, and why now. And let’s be honest with each other – if you’re not comfortable with why you’re making a decision that affects the financial health of your business, it’s more than likely that you won’t follow through or will constantly second-guess yourself.

    It’s Time to Get Comfortable and Curious

    One of your most important responsibilities as a business owner is to make decisions. This doesn’t mean that you need to be the expert in all the areas of your business. You do, however, need to be adept at asking educated questions and evaluating the recommendations of your employees and contractors. Whether you own or delegate an area of expertise, the ONLY way to make a decision comfortably is to build context over time to get the big picture. So, let’s help you get comfortable by outlining some simple and effective action steps to becoming a more confident marketer.

    • Ask questions – Above all else, there’s one action you can take to become a better marketer, to become more comfortable with the marketing decisions you make now and in the future. Ask your advisor why. You don’t understand how to interpret a chart put in front of you? Ask. You don’t understand why prices moved in one direction when the facts on the ground seem to point in the opposite direction? Ask. Asking is the first step to learning so that you’re ready the next time a similar situation occurs. Ask to give yourself the confidence to make a sale or to give you the reason to be a little more patient before making the next sale. Only through curiosity can we really learn. Can you think of a better reason to learn than to work toward maximizing the price you get for your hard work?
    • Create a plan – Can you imagine investing all your money in the S&P 500 and then exiting a position whenever you need to pay a bill?  Talk about adding risk to your financial outlook! And yet, many farmers treat their bin like a checking account, selling grain and taking on market risk every time they need to pay a major bill. Instead, build out a marketing plan that includes upcoming purchases and how much inventory needs to be sold by when. For instance, if you know ‘X’ amount of corn needs to be sold by April 1, note this in your plan. Make sure you revisit your plan regularly to track what’s coming up. Sell bushels accordingly ahead of time, when you see that prices are advantageous.
    • Set time aside to absorb the basics of the market – One of the best ways to feel comfortable pulling the trigger is to develop an understanding of how the market is moving and why (even though you may never learn why). More specifically:

    1. Keep track of market movements – To help you build a sense of the market, set aside just a few minutes a day or every few days to track prices. This will help you get a great sense of relative value, which in turn will help you feel more comfortable making sales according to the plan you’ve put into place.
    2. Focus on the basics of fundamental analysis – Pay attention to supply and demand and why prices are moving higher and lower. Importantly, focus on what’s happening both locally AND globally for your crop. This includes noting how the prices of one commodity like soybeans can affect prices of another (like soybean’s products, soymeal or soy oil). This will help you understand current and potential pricing changes for your crops.
    3. Focus on the basics of technical analysis – Technical patterns are often a reactive representation of the fundamental drivers, so it’s advantageous to learn and understand basic price patterns. For instance, begin with simple bar charts and candlestick charts. (While they look different upon an initial glance, they show identical information.) These charts enable you to track where prices have been and help identify current value, relative to price points in history. Identifying simple reversal patterns could also be helpful as you become ready to progress to more advanced charts.

    • Incorporate more and more basic tools into your marketing – Finally, learn and integrate basic tools into your toolkit to help you maximize marketing potential.  (Note: these are in order of priority as you move from most basic to more sophisticated.)

    1. Spot selling – You are most likely already familiar with spot selling, where you deliver on a certain day and sell at that day’s price.
    2. Forward contracting/selling – A signed contract to deliver at a time in the future (such as tomorrow, next week, or 3 months from now) at a price determined when the contract is negotiated.
    3. Stops – A highly effective pre-set order that triggers an automatic sale at a pre-determined level. You could define a stop price below or above the current price.

      • Consider incorporating this particular strategy sooner vs. later into your marketing. Anyone that has been involved in the markets in any significant way has seen the market get away from them and watched in horror thinking, “It can’t go much further! I’ll get out when it turns around!” Well, the market doesn’t always turn around. Sometimes prices blow up in your face when you should have sold a day or a week earlier, back when you had that little voice telling you “This doesn’t look good!” A simple stop strategy will go a long way to mitigate the emotional and financial stresses of those situations. (Check out Selling When Prices Are Down? Why Would You Do That? , which details the nitty gritty of how stops work.)

    4. Hedging with Futures – A contract on the exchange that allows you to set the futures portion of your price (the primary price mover) and set basis later when it is more advantageous. This is for a more seasoned marketer who understands the principle of how futures price and basis combine to determine your cash price. The use of Hedge-To-Arrive contracts and futures contracts is very similar.
    5. Purchased Puts – Essentially price insurance contracts for grain producers (sellers) to help protect against a price decline.
    6. Purchased Calls – Essentially price insurance contracts for grain producers (sellers) to help protect against a price increase.
    7. Buy backs – Using futures contracts to “re-own” your previously sold grain.

    Getting Going

    For those of you who are TFM clients, your advisor is available to answer questions and to help you every step of the way. Your advisor can help you get comfortable incorporating any of these concepts into action. If you’re not with an advisor, I invite you to talk to us and invite you to consider us as a valued resource to help with your marketing. And above all, remember – the goal is not to use the most sophisticated strategies or the most complicated (and expensive) strategies. The goal is to build the most effective weighted average price for your production by making smart, simple decisions designed to enrich only one person – you.

    Grain Market Insider can help, as we’ve helped farmers for almost 40 years.

    Have questions about how you can build a plan to help you in any market environment, or questions about your plan?

    Call us at 800.334.9779.

    Active Marketing Really Is Part of Your Job

    Grain farmers have every right to be very proud of their business acumen. Unlike farmers that produce for larger conglomerates, independent grain farmers run every gamut of their businesses. They set strategy around crop mix and capital upgrades. They do the work of acquiring seeds and fertilizer (procurement), and test new ways to increase productivity (R&D). Obviously, they plant and harvest (manufacturing), and they manage finances and people alike (finance and HR). In other words, they’re deeply involved in managing all business functions, just like any owner of a business in any industry.

    Except one thing – many farmers simply don’t think they need a sales and marketing function to try to maximize price and revenue.

    Sales and Marketing in Farming?

    To be clear, farmers try to sell their production when prices are good. Nonetheless, they just know at the end of the day that they are price takers, selling their commodity for the same price as everyone else. And it’s just common knowledge that they are one of the only industries that has to sell at wholesale prices and buy at retail prices, squeezing margins in a way other industries don’t face.

    Lenders (more interested in managing the risk of their portfolio vs. the risk farmers face) often reinforce this anti-marketing attitude. They may tell farmers to sell at breakeven points, which means you might be selling too low or waiting for a price that never comes. Or they may tell you to avoid futures and options strategies that can help you manage the price risk you face. Lenders sometimes play a role in pricing decisions that would never be contemplated in another business.

    Beneath all this is a little bit of pessimism, in that farmers are unique in having little control over price. If you have no chance at control, why would you focus on marketing? With that in mind, it’s no surprise that the actual work of price management is viewed as something extra and outside of the actual work of farming. As a matter of fact, it’s sometimes seen as a little unseemly and, frankly, kind of distracting.  

    The Myth of All Those Price Setters

    Let’s take a step back. Like any other manufacturer, you are creating a product that requires raw materials to produce your product. Like you, your suppliers AND purchasers create products and services driven by supply and demand.  Unless we’re talking about a monopoly, every business is a price taker with fluctuating financials driven by market forces. For the most part, businesses in every industry use the tools at their disposal to try to improve their price and revenue in spite of what the market offers.

    • Take the leasing industry for farm equipment. Say you want to take out a lease on new combine. The rate you are offered is directly tied to prevailing interest rates (like commodities, a very efficient market). From there, the leasing company has levers to balance their need to maximize revenue vs. taking you on as a customer. They look at your credit worthiness, length of the lease, and the condition of the equipment. You, on the other hand, are looking for the best price and conditions. Yes, the leasing company “sets” the price, and that price changes constantly based on interest rates and market forces as it tries to maximize revenue.
    • Are you looking for a retail product, like fertilizer? Fertilizer prices are stickier than commodity prices, to be sure, and still subject to market forces over time, based on demand and the price of raw inputs. And they are forced to adapt prices based on volume or competitive forces while still maintaining a margin to stay in business.
    • Even a manufacturer who sells retail products needs to make regular adjustments to price and is not in a position to simply set the same price for all transactions. For instance, if you want to sell your razor at Walmart, odds are that your margins are being squeezed in return for the greater volume Walmart can handle. The razor seller needs to carefully negotiate price based on a variety of factors, such as prevailing prices, demand for their product, pricing of competitor products, and volume.

    As a matter of fact, if you go to Google and look up “pricing analyst,” you’ll see that LinkedIn lists about 25,000 jobs.  Businesses across industries spend real money trying to manage prices. Yes, they could simply put a price out there and run with it, and in the process would endanger leaving money or customers on the table. The tools and levers each business uses to manage prices and risk (volume, credit scores, loss leader strategies, futures and options, etc.) are completely a function of their industries.

    Changing Your Perspective

    By now you see where I’m going. Managing price is not a job for only certain industries. It’s an integral part of any successful business. In the world of grain farming, your tools to managing price include making educated sales decisions based on timing and the futures market. This isn’t an extra burden on agriculture – instead, managing price is an integral business function to help manage long-term success.  

    With a change in perspective comes a change in opportunity. As you look at the world around you, farming is consolidating as individual farm size grows. Hand in hand with this change, we all observe the business caliber of farms skyrocketing. As we’ve said many times over the years, marketing remains one of the best areas for you to gain a competitive foothold. Is this an opportunity that you’re ready to take on?

    Grain Market Insider can help

    For almost 40 years, Grain Market Insider has helped farmers be successful in any market condition. We can help you set up a plan that prepares you for whatever the market does rather than on what you hope it will do.

    Give us a call at 800.334.9779 to learn more.

    Are Market Makers on the Board Really Out to Get You?

    Many farmers can’t get away from that niggling feeling that traders on the Chicago Board of Trade exists primarily as a middleman skimming fees on the backs of farmers and enabling disadvantageous hedge fund behavior.  Over the course of my career in ag, I’ve had many a conversation with farmers about how they feel about traders that only speculate on the Board. (And when I say speculators, I’m primarily talking about managed money, hedge funds, market makers, or anyone assuming the risk of the market to make money.) Many in ag feel that, bottom line, speculators always put farmers on the short end of the stick of a trade.

    Full disclosure: before becoming a TFM advisor, I was a market maker at the Board of Trade and then a merchandiser at an elevator. And, by the way, you’re right – speculators at the Board DO hope to make money off the grain you produce through each and every transaction that uses a grain contract. Yet are speculators – specifically market makers – on the Board really making money at the expense of farmers? And do they offer anything TO farmers and other market participants?

    How Does the Board Provide a Marketplace?

    For many, just knowing that speculators are trading through the Board is enough to avoid trading futures and options at all. Last July, August, and September we discussed how hedge funds and managed money benefit farmers. Does this hold true for market makers? Perspective on the role of market makers on the Board might help you feel more comfortable about making a trade.

    • For context, there are two main types of traders at the Board: hedgers and speculators. Hedgers are there to transfer risk; speculators are there to assume risk.
    • There are many types of speculators, and all provide some level of liquidity in the market. Market makers provide the most liquidity.
    • Market makers constantly buy and sell at the market price. Their objective is to make a fraction of a cent per transaction by buying the bid and selling the offer.
    • Because their biggest risks are time and market volatility, market makers do not want to sit on a long or short position for any real duration. Instead, they want to end any day neutral.
    • The role of the market makers keeps the Board efficient and provides all participants the ability to get in and out of the market.

    Because of the activities of the market makers at the Board of Trade, market prices reflective of supply and demand can be made for your production regardless of location and, within parameters, timeframe. And here’s the deal – even if you as a farmer never personally trade through the Board, your prices are still affected by the Board prices.

    It’s important to know that participants in the market – the buyers, the sellers, the processors, and everyone in between – all share similar goals of managing risk, whether it’s the risk and opportunity of prices or the risk of not having grain when they need it. To manage that risk, they need the liquidity that the market makers at the Board offer. Whether a buyer or seller, the ability to offset your Board position at a moment’s notice gives confidence and a mechanism to build a favorable price.

    How Do Market Participants Use the Board?

    As we discussed, participants in the market use it for access to product and risk management. Let’s walk through how market participants use the Board to help make smart, profitable business decisions.

    Did you notice that almost every type of market participant uses futures to manage their opportunity and risk? Like it or not, you’re already in the market with everyone else, as the Board prices are a fundamental factor in determining the cash prices. The question is whether or not you’re using the Board to manage your own opportunity and risk.

    Futures and the Futures Market Are Useful Tools (Regardless of What You Think of Traders)

    So, let’s get back to the original question. Are market makers on the Board out to get you? Would you be surprised to hear that every market participant kind of feels that way? And the answer for everyone, truly, is no. Market makers at the Board are rewarded for moving orders at prices that reflect what the market offers; they avoid taking on the real risk of market gains or losses given the amount of volume they take on. Furthermore, they don’t really think about – or know – or need to know the face of anyone initiating any transaction, including the origination of the grain or the positions someone had on before their last trade. They’re worried about filling orders, making sure the market works smoothly and efficiently, and getting back out of a position without taking on market volatility.

    With the amount of responsibility (and volume) I faced to do my job back when I traded as a market maker, I took a page from a mentor of mine: look at what was in front of you and deal with it. That approach could also apply to other participants in the market, like you.  Accept that, on balance, the Board offers opportunities that would not otherwise be there. Think about how buyers and sellers use the futures market to manage their own risk and price. Think about the clear advantages you have as a producer – you have grain in the field to cover positions you place on the Board. That puts you at a unique position that other market participants can’t enjoy.

    Yes, the futures market can feel dangerous and tricky. That doesn’t change the fact that you are in the market, whether you manage your price risk or not. With that in mind, think about your business and financial strategy and the steps you can take to manage the price you get. Work with someone trustworthy and knowledgeable like the advisors at TFM to help use the futures market to your advantage.

    Grain Market Insider can help

    For almost 40 years, Grain Market Insider has helped farmers be successful in any market condition. We can help you set up a plan that prepares you for whatever the market does rather than on what you hope it will do.

    Give us a call at 800.334.9779 to learn more.