10-21 End of Day: Grains Slip Following Mixed Trade Rhetoric
Grain Market Insider Interactive Quote Board
Grain Market Highlights
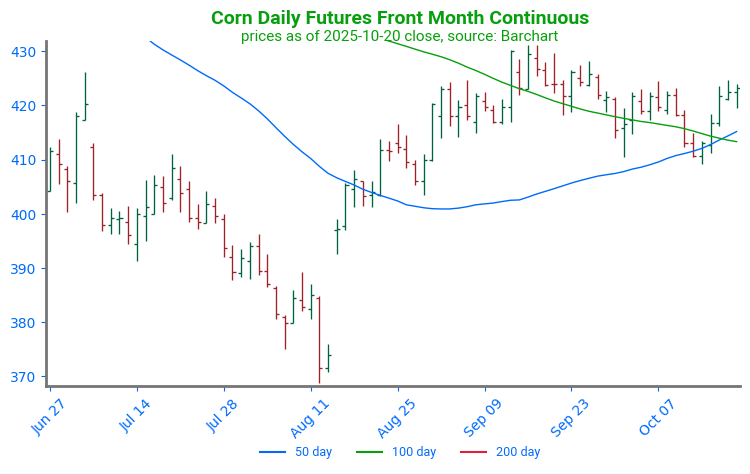
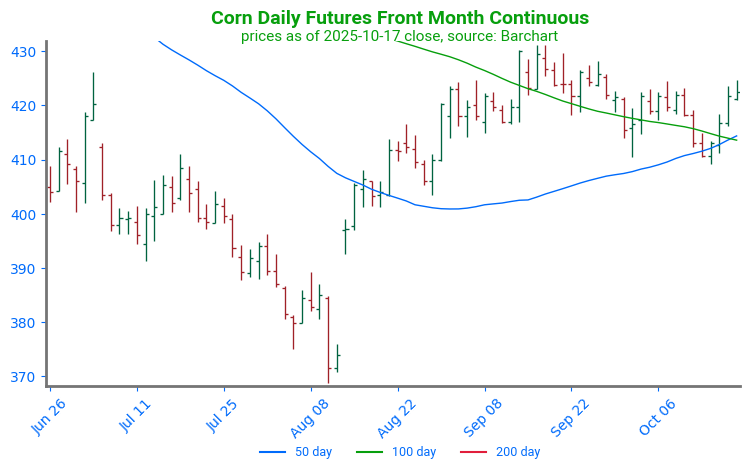
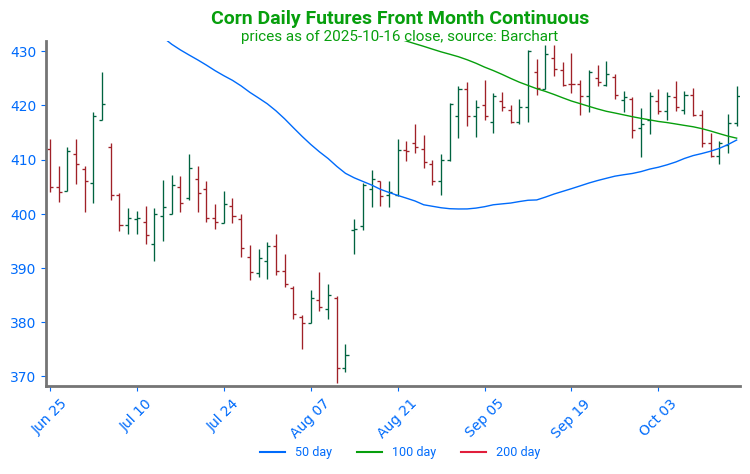
- 🌽 Corn: Corn futures failed to break overhead resistance and closed lower on the day, pressured by strength in the dollar and spillover weakness from gold.
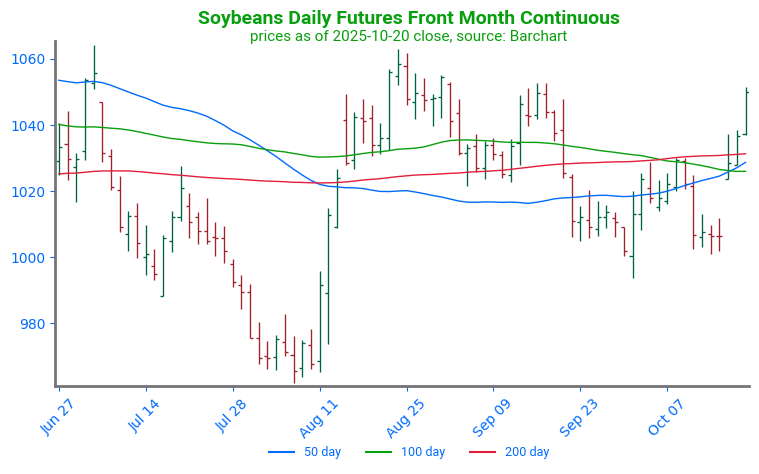
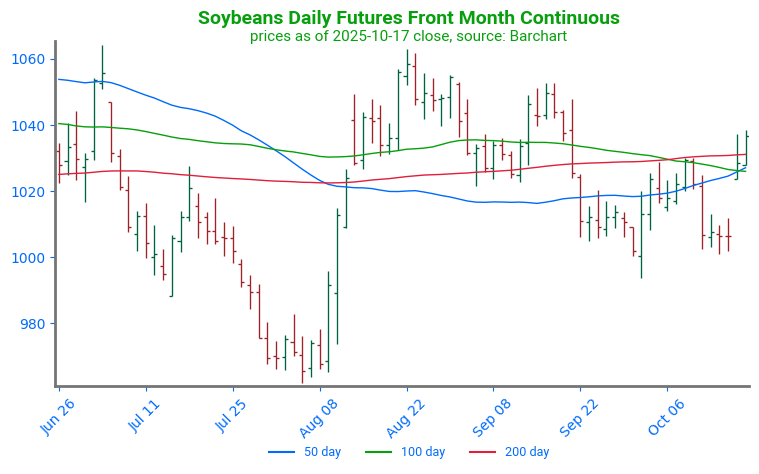
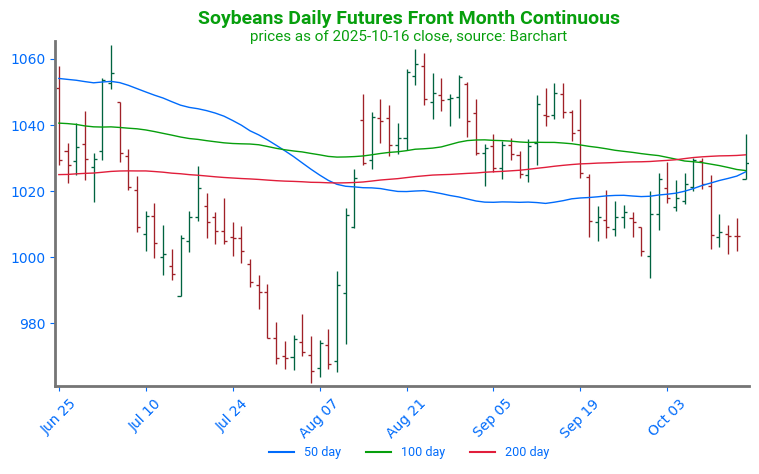
- 🌱 Soybeans: Soybeans slid lower following mixed rhetoric about the ongoing trade tensions with China.
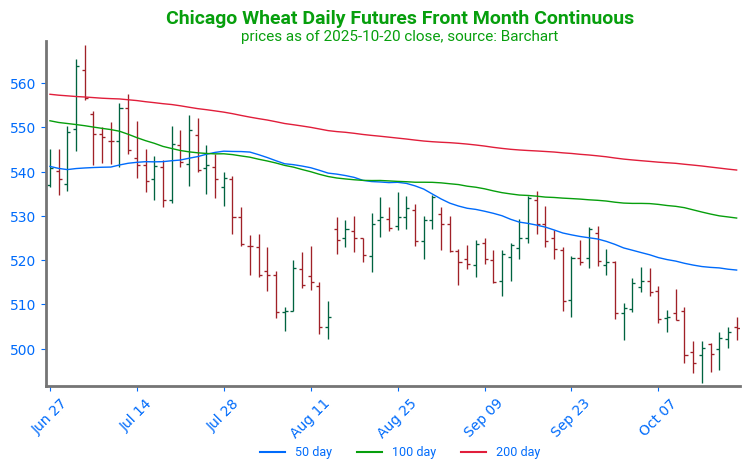
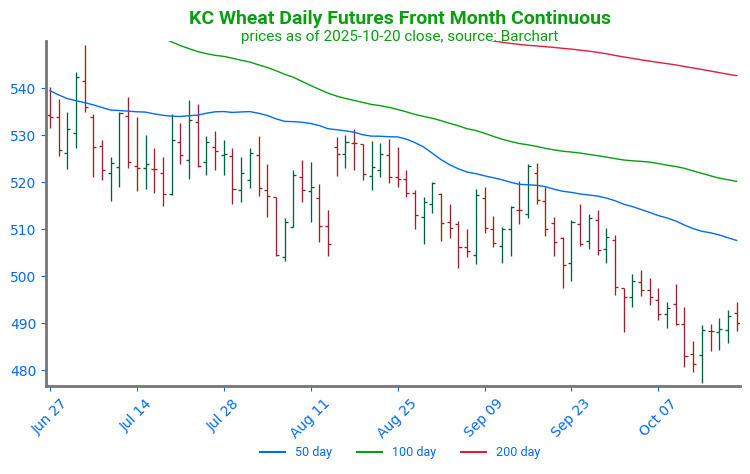
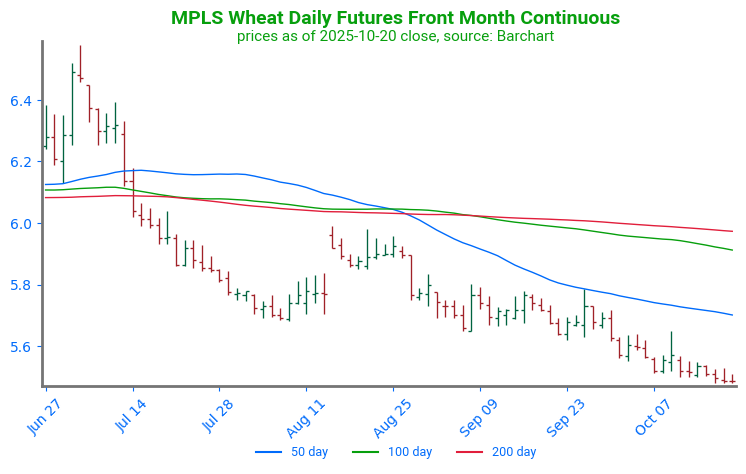
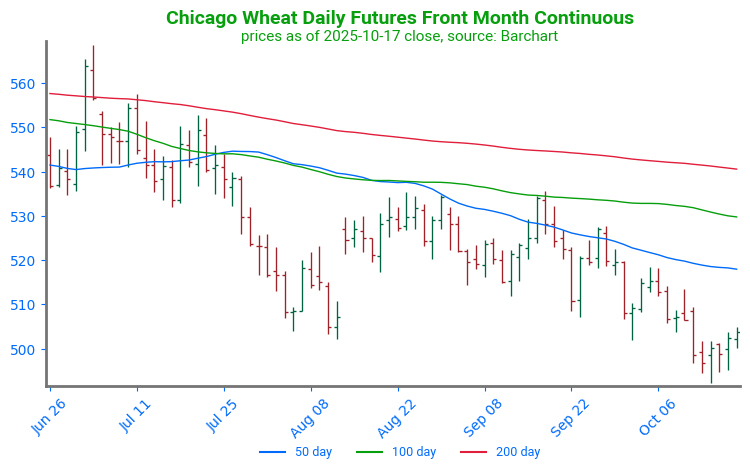
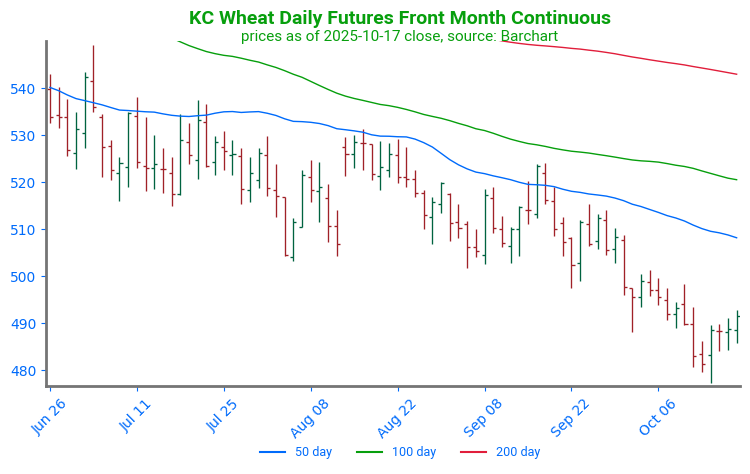
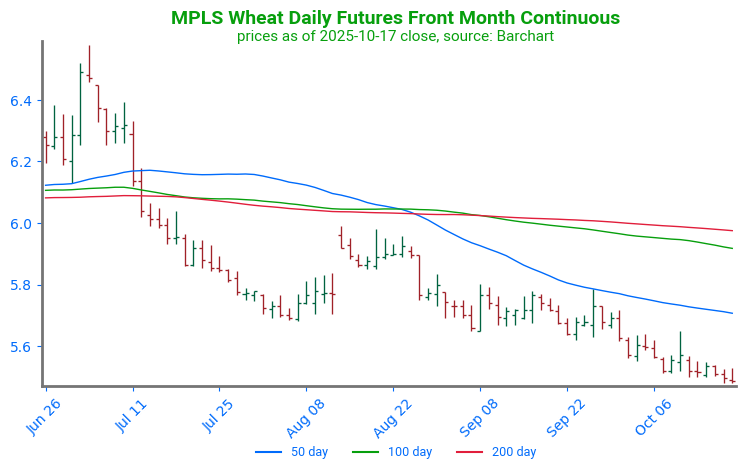
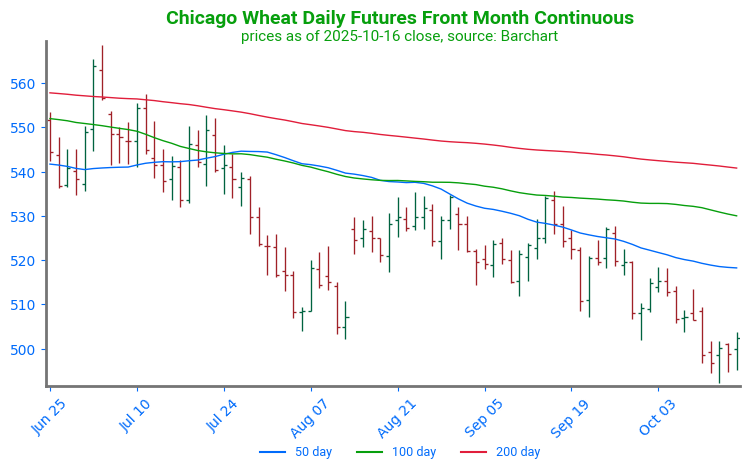
- 🌾 Wheat: Wheat futures slipped as strength in the U.S. dollar and spillover weakness from corn and soybeans weighed on the market.
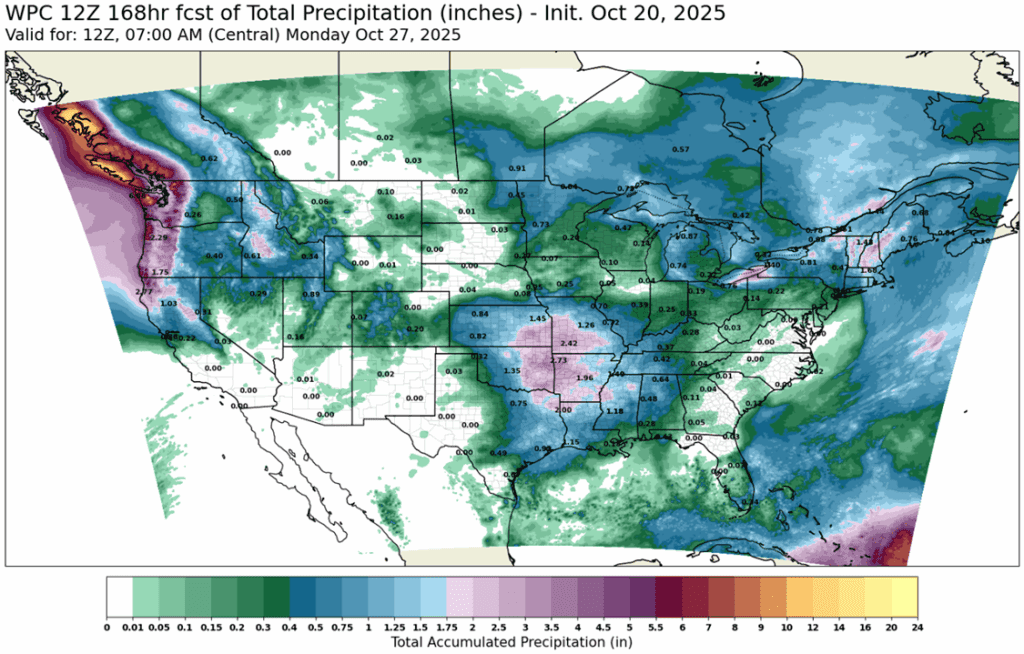
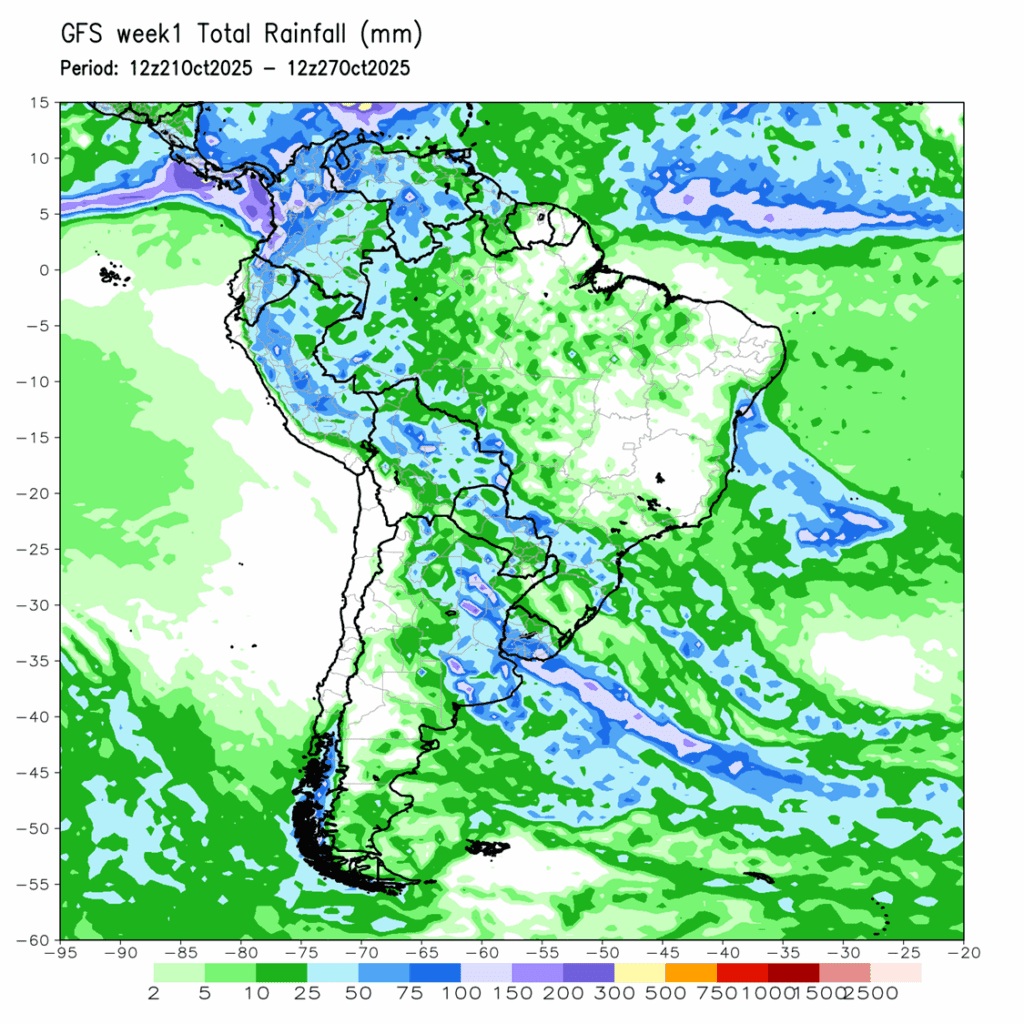
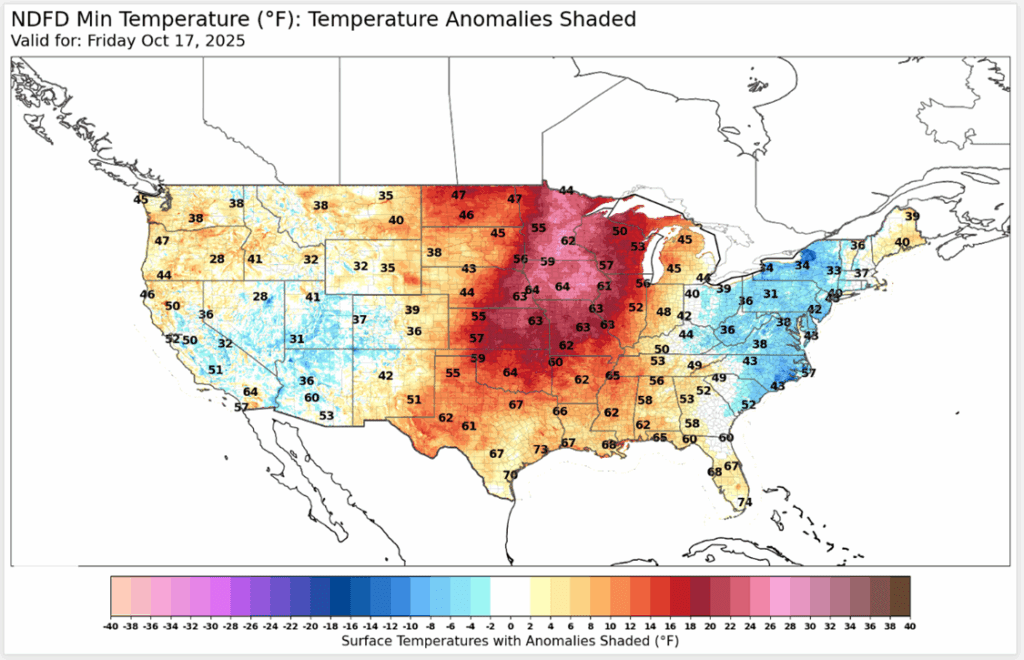
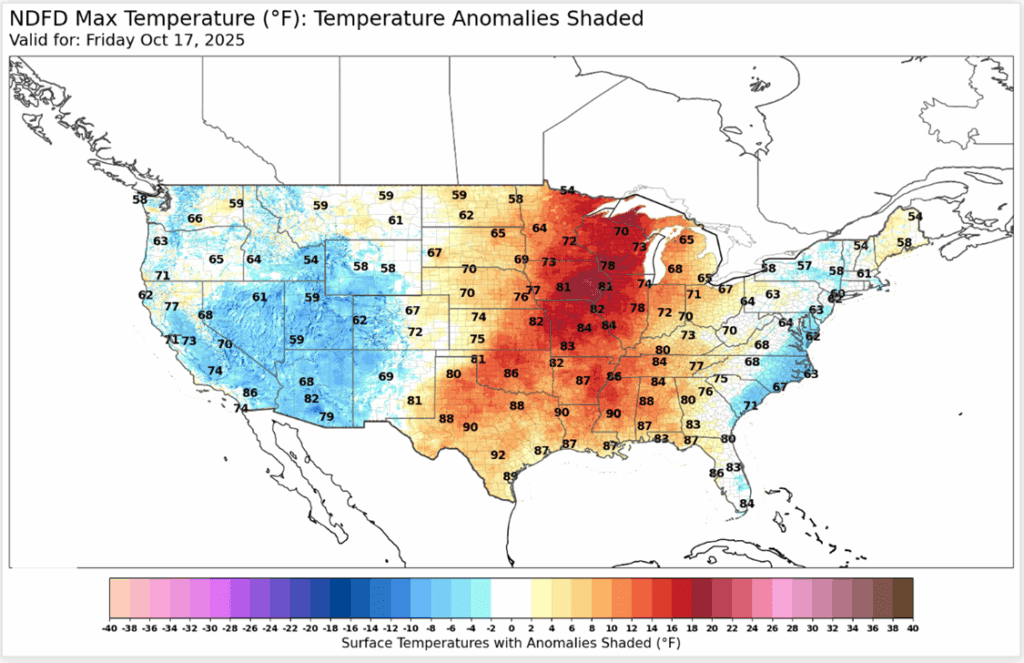
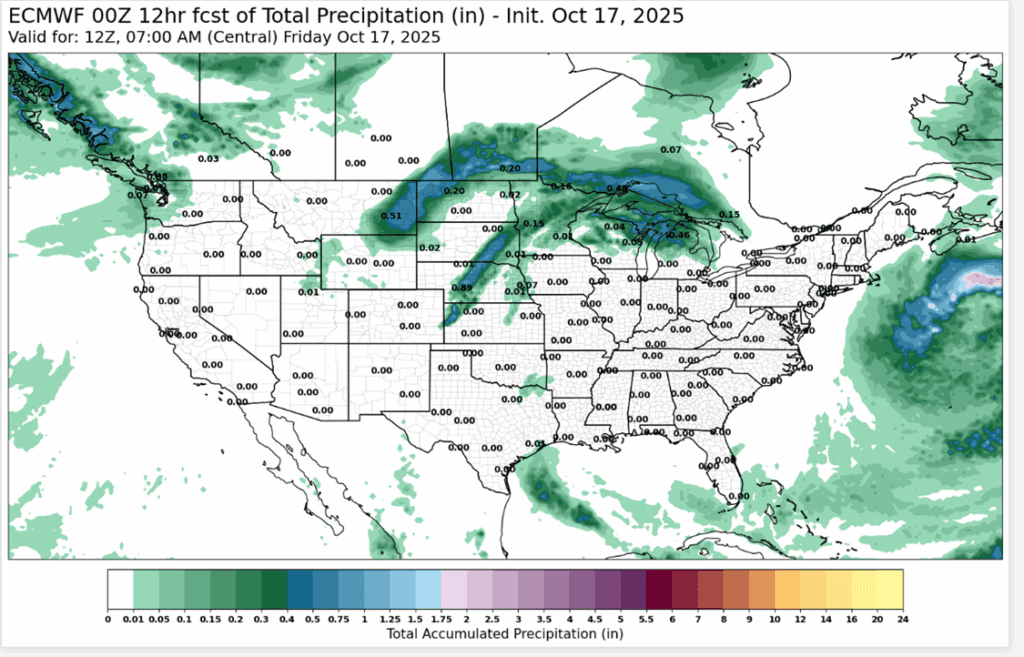
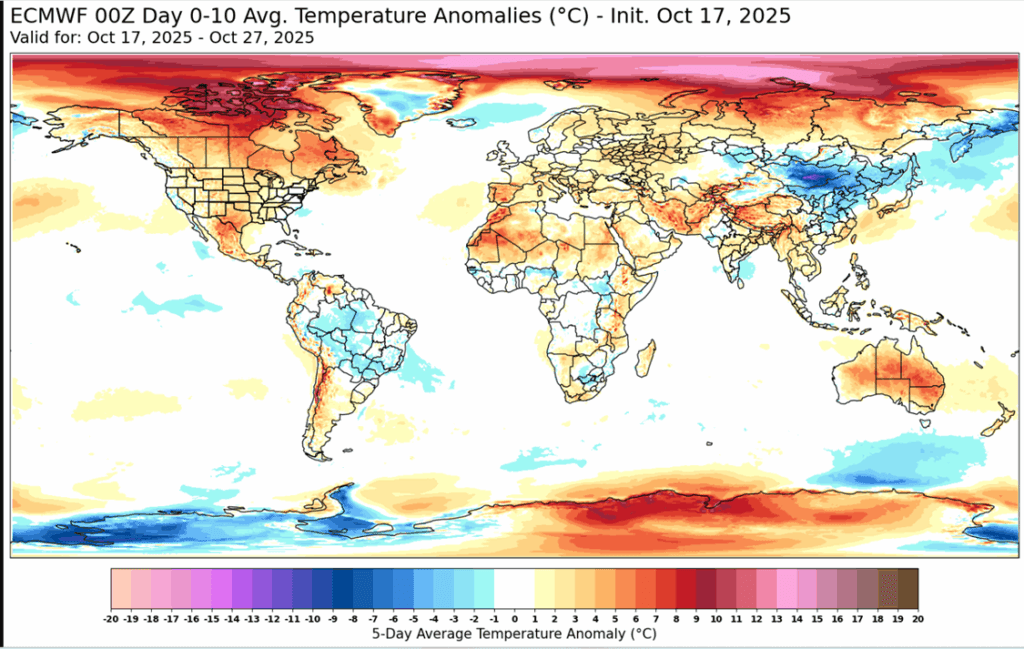
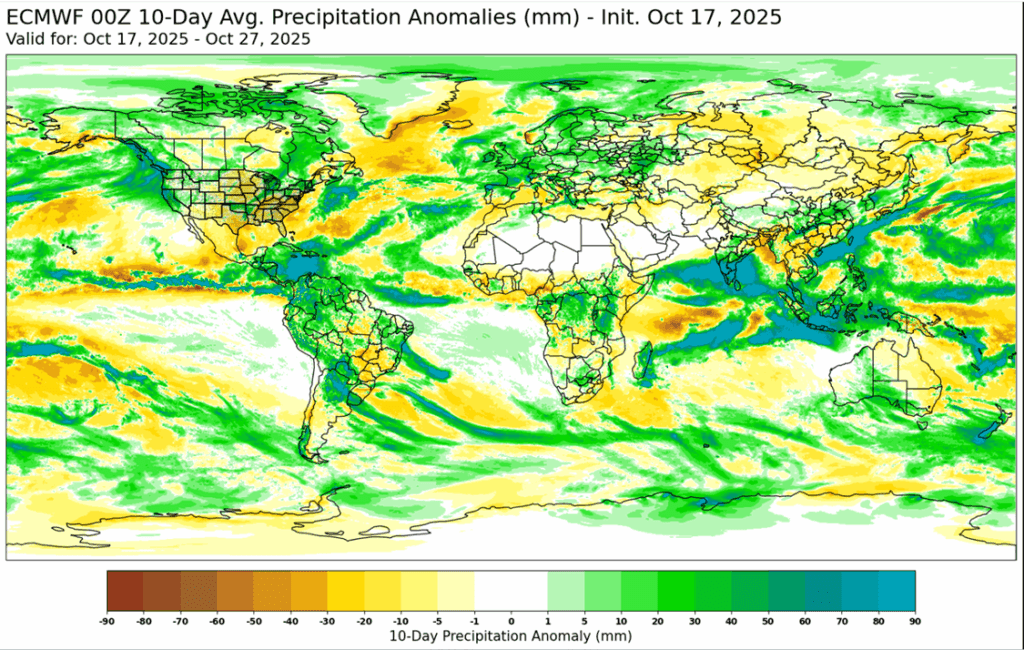
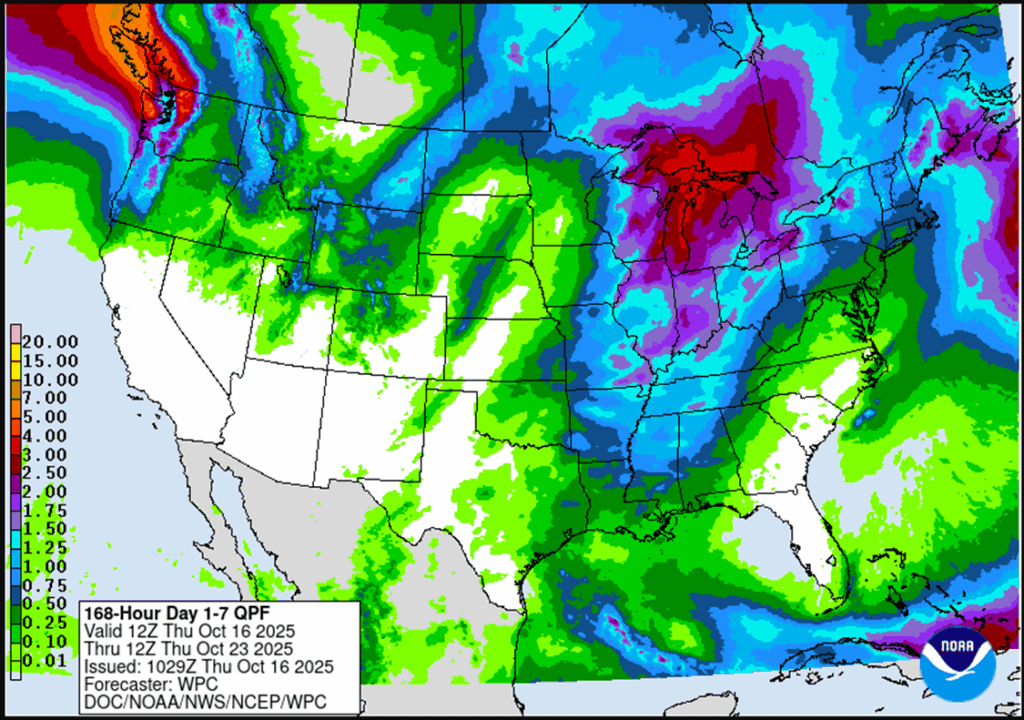
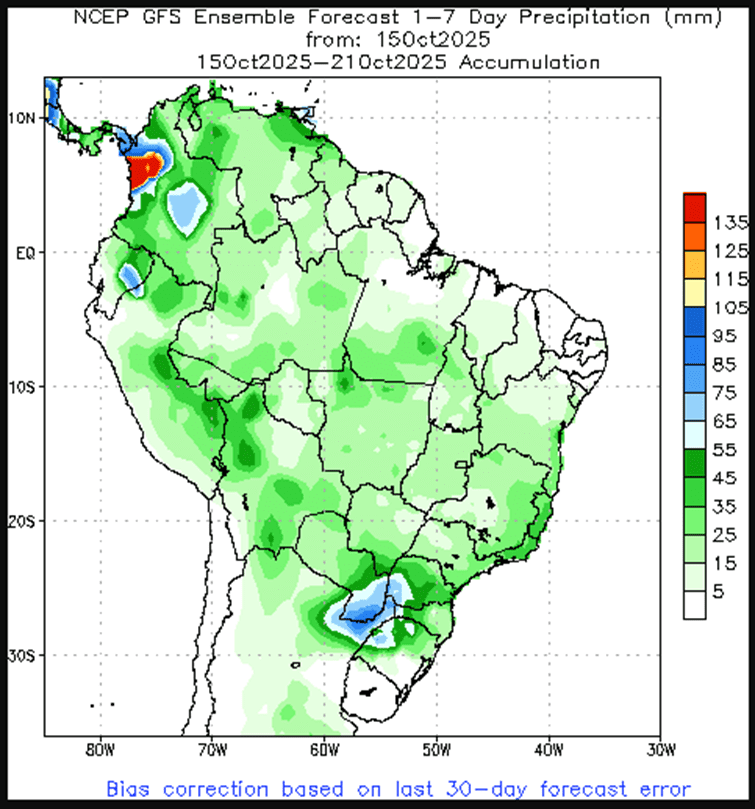
- To see updated U.S. and South America weather maps, scroll down to the other charts/weather section.
- The release of new crop progress data has been delayed as a result of the government shutdown. Updated figures will be issued following the resumption of government operations.
Note – For the best viewing experience, some Grain Market Insider content is best viewed with your phone held horizontally.
Corn
Corn Action Plan Summary
2025 Crop:
- Plan A:
- No active targets.
- Plan B:
- No active targets.
- Details:
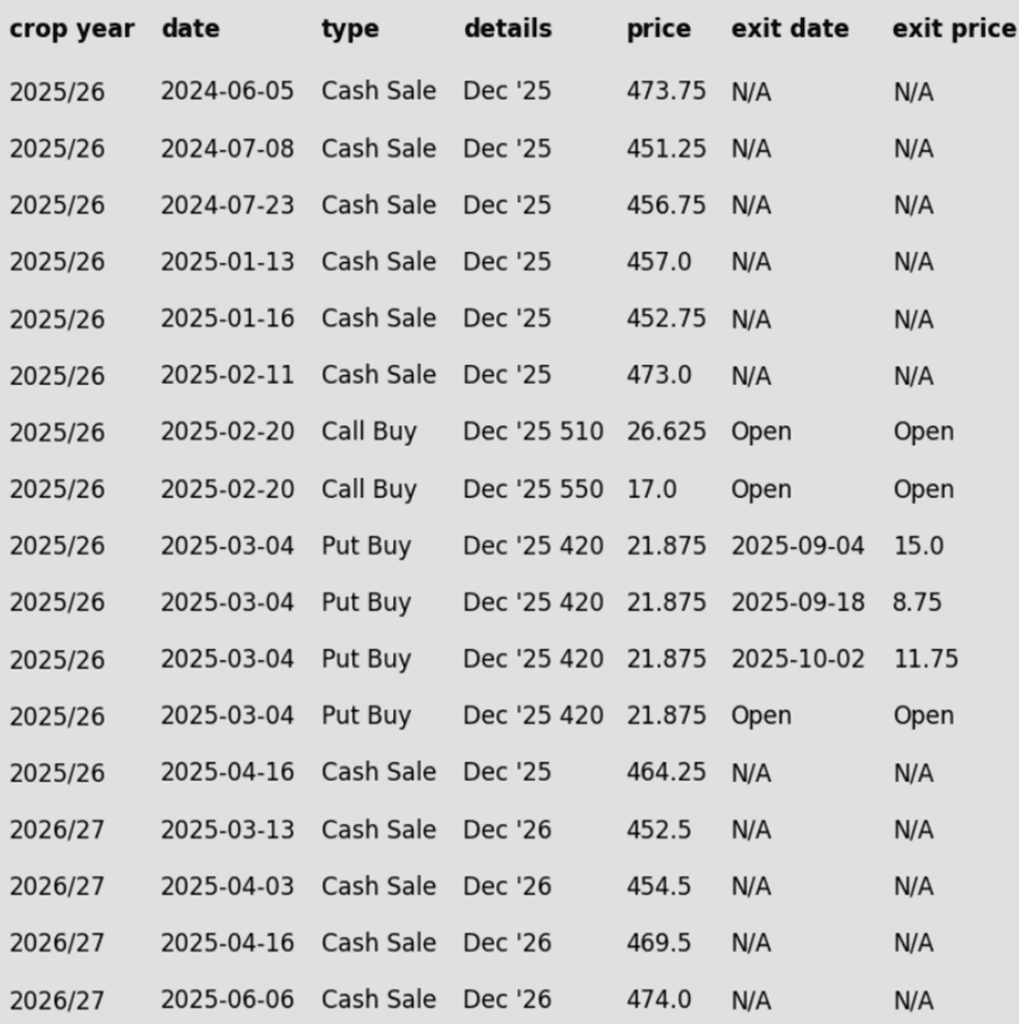
- Sales Recs: Seven sales recommendations have been made to date, with an average price of 461.25.
- Changes:
- None.
2026 Crop:
- Plan A:
- No active targets.
- Plan B:
- A close over 482 resistance vs Dec ‘26 and buy call options (strikes TBD).
- Details:
- Sales Recs: Four sales recommendations have been made to date, with an average price of 462.
- Changes:
- None
- Notes:
- Resistance for the macro trend sits at 482 vs December ’26. A close above 482 would signal a potential shift to a macro uptrend, triggering a call option purchase.
To date, Grain Market Insider has issued the following corn recommendations:
- Selling pressure hit the corn market on Tuesday as failing to push through resistance triggered some long liquidation. A firmer U.S. dollar and a drop in gold futures also triggered some selling on the session. December corn lost 3 ½ cents to 419 ¾, and March lost 3 ¼ cents to 433 ¾.
- Two out of the past three sessions, corn futures reversed at the 425 price area and traded lower off that price point. The 425 price could be triggering some farmer selling. The weak technical closes could open the corn market to some additional selling going into tomorrow’s session.
- The U.S. dollar has traded higher for the past three sessions, pressuring corn and wheat prices on Tuesday.
- The corn market stays supported by yield variability. With information limited, yield reports have supported the market regarding the size of the corn crop. The impact of late dry weather and disease pressure is still unknown in the corn market.
- The talk that the government shutdown could see resolution this week could be either positive or negative to the corn market. The start of flowing government information will shed light on harvest progress and demand for the corn market, which has been missing since the shutdown began.
Soybeans
Soybeans Action Plan Summary
2025 Crop:
- Plan A:
- Exit one-third of 1100 call options at 1085 vs November.
- Plan B:
- No active targets.
- Details:
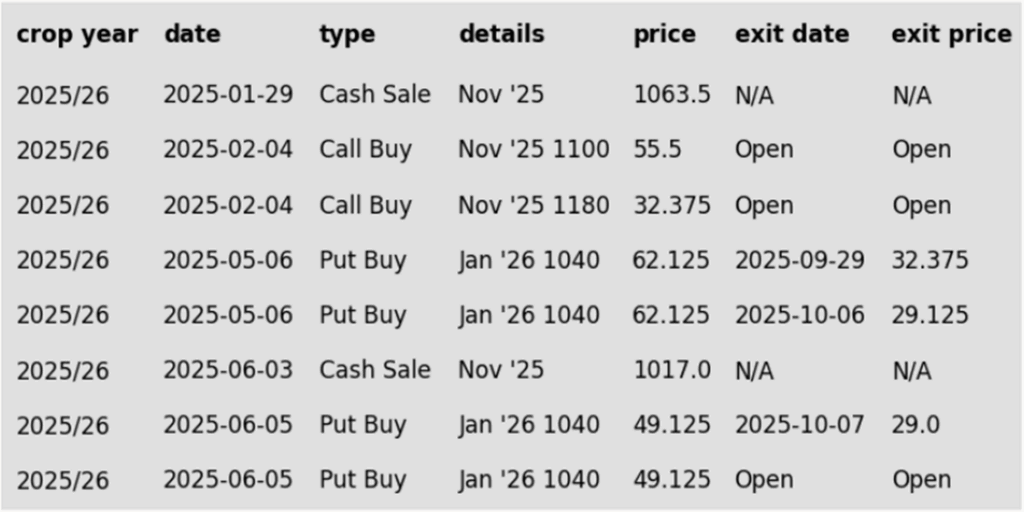
- Sales Recs: Two sales recommendations made to date, with an average price of 1040.25.
- Changes:
- None.
- Notes:
- None.
2026 Crop:
- Plan A:
- No active targets.
- Plan B:
- A close over 1161 resistance vs Nov ‘26 and buy call options (strikes TBD).
- Details:
- Sales Recs: Zero sales recommendations made so far to date.
- Changes:
- None.
- Notes:
- Resistance for the macro trend sits at 1161 vs November ‘26. A close above 1161 would signal a potential shift to a macro uptrend, triggering a call option purchase.
To date, Grain Market Insider has issued the following soybean recommendations:
- Soybeans ended the day slightly lower in quiet trade amid mixed comments by President Trump regarding a meeting with China’s Xi. November soybeans lost 1 cent to $10.30-3/4, while March lost 1-1/4 cents to $10.62-3/4. December soybean meal gained $1.90 to $286.90 and December soybean oil lost 0.66 cents to 50.65 cents despite small gains in crude.
- This week there has been a significant amount of talk by the administration of getting a trade deal ironed out with China. Yesterday, President Trump said they would attempt to close a deal by November 1 or risk increasing tariffs on Chinese goods, but today he said that the meeting with President Xi may not happen.
- The U.S. soybean harvest is estimated by Bloomberg polls to be 74% complete with a range between 61-80%. This would compare to last week’s survey guess of 60% and would compare to 81% from the USDA at this time a year ago.
- Yesterday’s export inspections saw soybean inspections at 1,474k tons which compares to 1,017k last week and 2,550k tons a year ago at this time. Export inspections are down 42.2% from a year ago. Top destinations were Mexico, Bangladesh, and Pakistan.
Wheat
Market Notes: Wheat
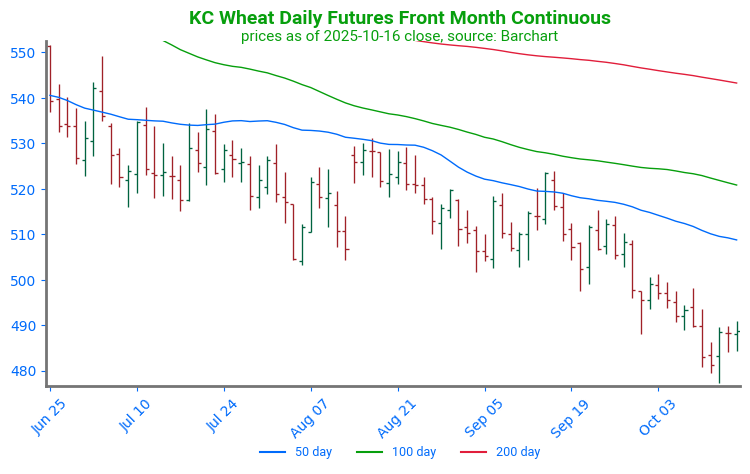
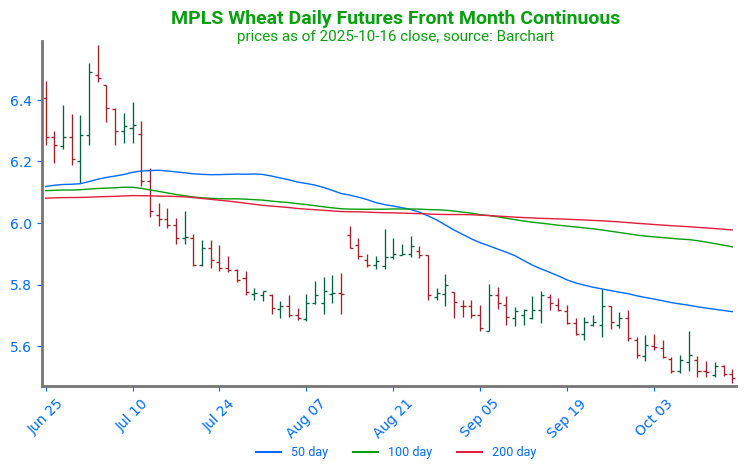
- Wheat closed lower across all three classes, pressured by the lower corn and soybean trade, a rebound in the U.S. Dollar Index, and a lower close for MATIF wheat futures. December Chi lost 4-1/2 cents to 500-1/4, KC was down 5 cents at 485, and MIAX finished the session 3-3/4 cents lower at 544-3/4.
- IKAR has once again increased their estimate of Russian wheat production, this time by 0.5 mmt to 88 mmt. The last USDA estimate in September had the crop pegged at 85 mmt.
- According to their agriculture ministry, Ukraine’s winter wheat crop is 72% planted. And despite the lack of data due to the government shutdown, U.S. winter wheat is believed to be being planted at a similar pace. A poll from Reuters suggests that U.S. plantings are 75% complete, while a Bloomberg survey indicates the crop is 76% planted.
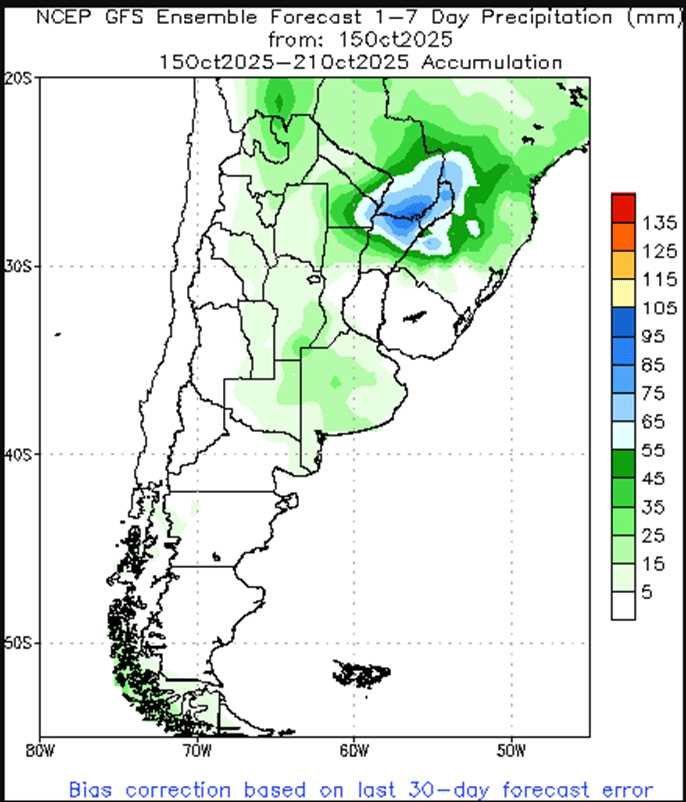
- Over the past week, it was warm and mostly dry across Argentina. Over the next five days, above-normal temperatures are expected in central and northern regions, before cooler temperatures arrive next week. Additionally, above-normal rainfall is expected in the Pampas and northeast region. If the moisture persists, it could cause some concerns for the growth and quality of the wheat crop.
2025 Crop:
- Plan A:
- Target 591.25 vs December for the next sale.
- Plan B:
- Buy call options if December closes over 594 macro resistance.
- Details:
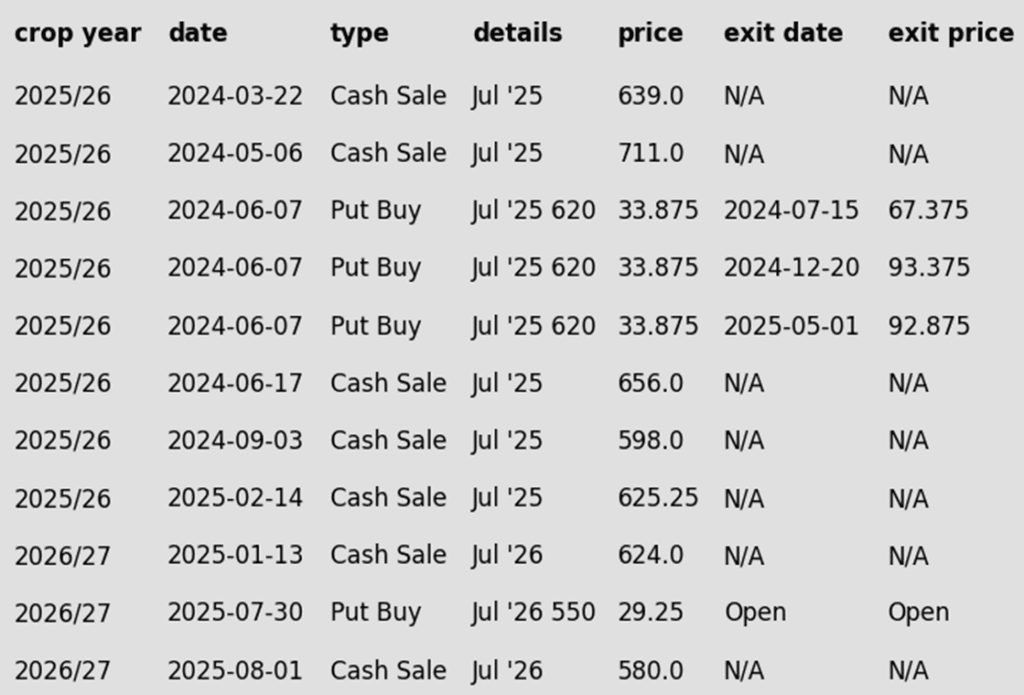
- Sales Recs: Five sales recommendations made to date, with an average price of 646.
- Changes:
- The Plan A sale target has been lowered to 591.25.
- The Plan B call option target has been lowered to 594.
- Notes:
- Resistance for the macro trend sits at 594 vs December ‘25. A close above 594 would signal a potential shift to a macro uptrend, triggering a call option purchase.
2026 Crop:
- Plan A:
- Target 591.50 vs July ‘26 for the next sale.
- Plan B:
- No active targets.
- Details:
- Sales Recs: One sales recommendation made to date at 624.
- Changes:
- The Plan A sale target has been lowered to 591.50.
2025 Crop:
- Plan A:
- Target 563 against December 2025 for the sixth sale.
- Plan B:
- Buy call options if December closes over 628.75 macro resistance.
- Details:
- Sales Recs: Five sales recommendations made to date, with an average price of 618.
- Changes:
- The Plan A sales target has been lowered from 565 to 563.
- Notes:
- Resistance for the macro trend sits at 628.75 vs December ‘25. A close above 628.75 would signal a potential shift to a macro uptrend, triggering a call option purchase.
2026 Crop:
- Plan A:
- Target 617 vs July ‘26 to make the first cash sale.
- Plan B:
- No active targets.
- Details:
- Sales Recs: Zero sales recommendations made so far to date.
- Changes:
- The Plan A target has been lowered to 617.
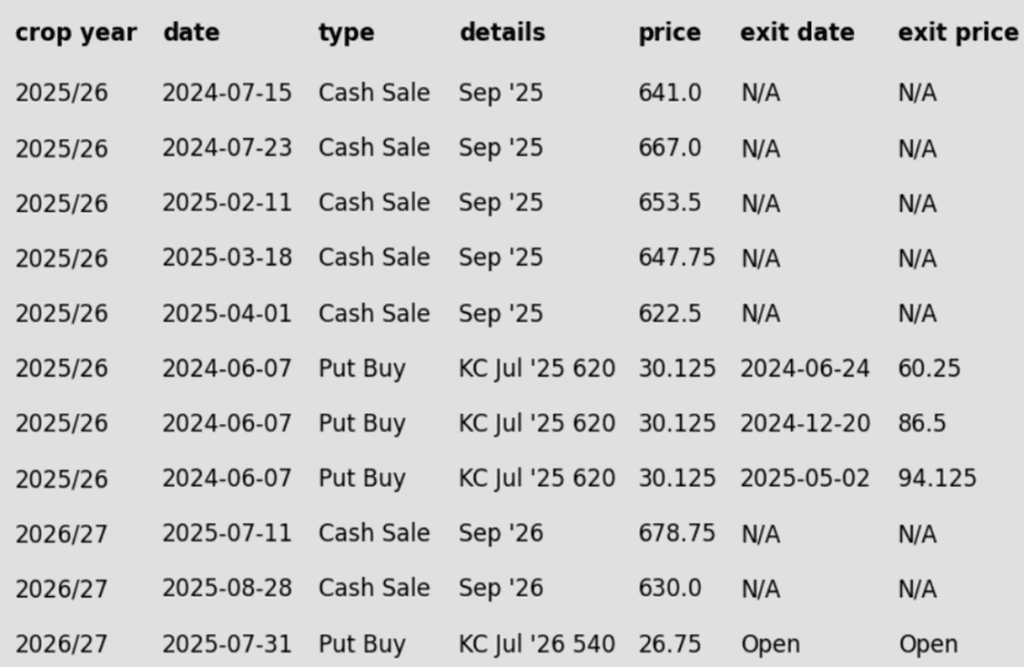
To date, Grain Market Insider has issued the following KC recommendations:
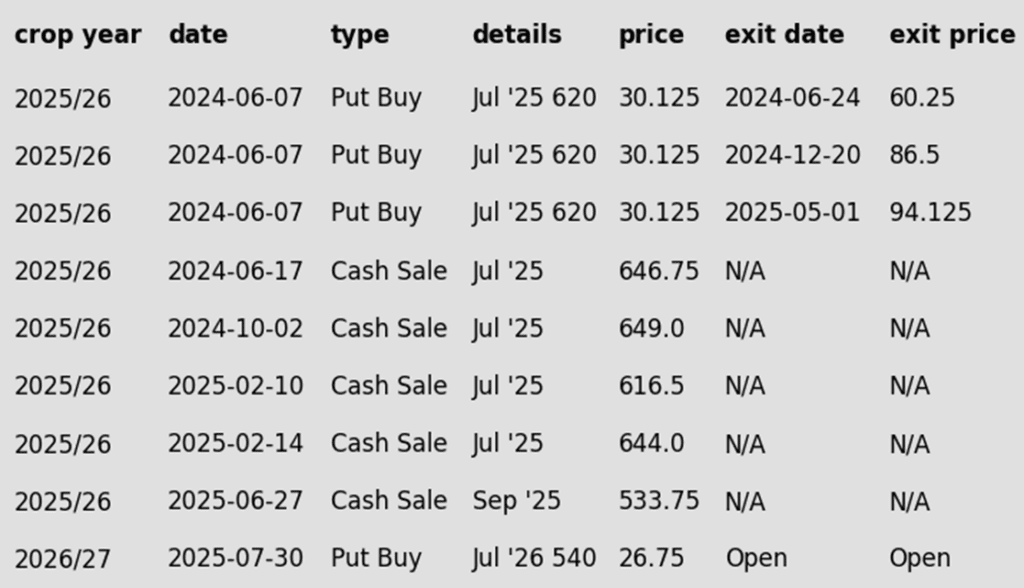
2025 Crop:
- Plan A:
- No active targets.
- Plan B:
- Buy KC call options if December KC closes over 628.75 macro resistance (strikes TBD).
- Details:
- Sales Recs: Five sales recommendations made to date, with an average price of 646.
- Changes:
- None.
- Notes:
- Resistance for the macro trend sits at 628.75 vs December ‘25. A close above 628.75 would signal a potential shift to a macro uptrend, triggering a call option purchase.
- FYI – KC options are used for better liquidity.
2026 Crop:
- Plan A:
- No active targets.
- Plan B:
- No active targets.
- Details:
- Sales Recs: Two sales recommendations have been made to date, with an average price of 654.
- Changes:
- None.
- Notes:
- FYI – KC options are used for better liquidity.
To date, Grain Market Insider has issued the following KC recommendations:
Other Charts / Weather
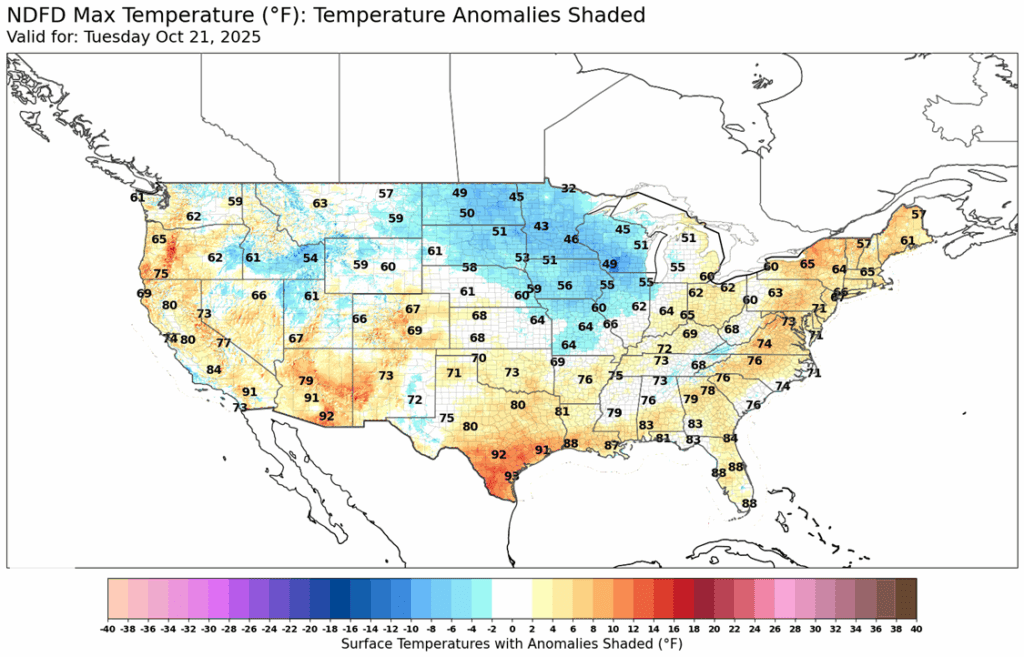
Above: U.S. 7-day temperature courtesy of ag-wx.com
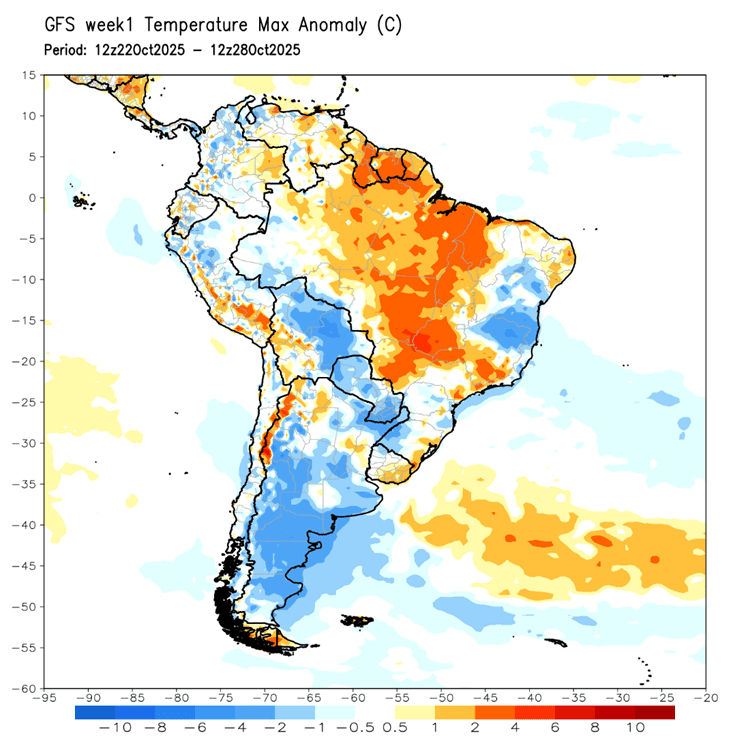
Above: South America 7-day temperature outlook courtesy of National Weather Service, Climate Prediction Center.