5-09 Opening Update: Grains Higher to Start the Day Following Weakness Yesterday
All prices as of 6:30 am Central Time
|
Corn |
||
| JUL ’25 | 453 | 5.5 |
| DEC ’25 | 442.5 | 3.75 |
| DEC ’26 | 459.25 | 2 |
|
Soybeans |
||
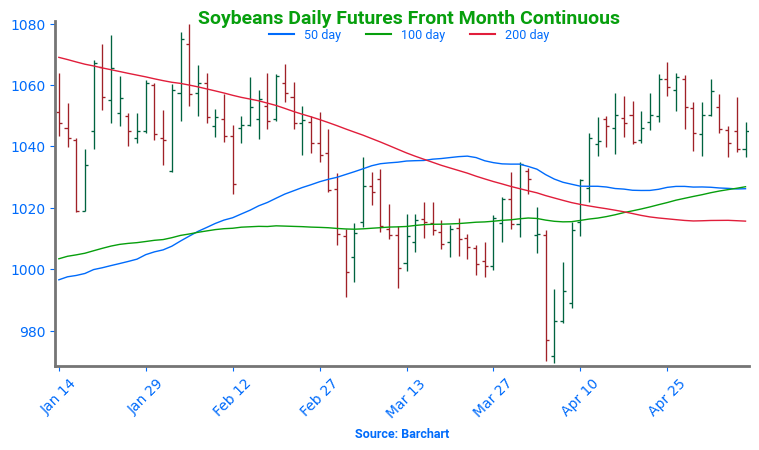
| JUL ’25 | 1049 | 4 |
| NOV ’25 | 1027.25 | 2.25 |
| NOV ’26 | 1038.25 | 2.5 |
|
Chicago Wheat |
||
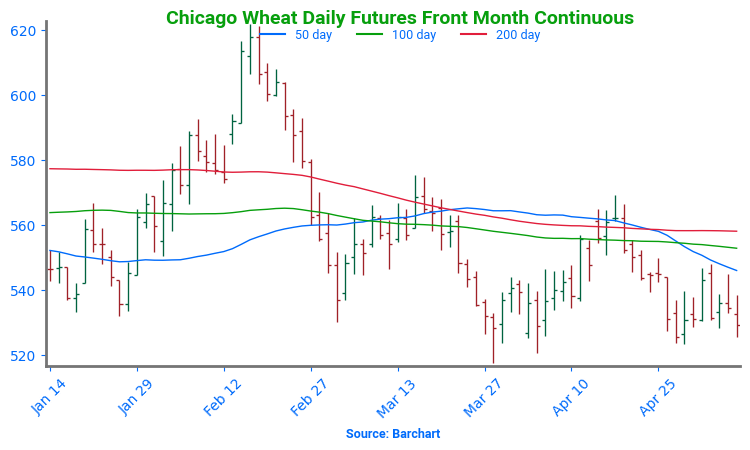
| JUL ’25 | 532.5 | 3.25 |
| SEP ’25 | 547 | 3 |
| JUL ’26 | 603.75 | 2 |
|
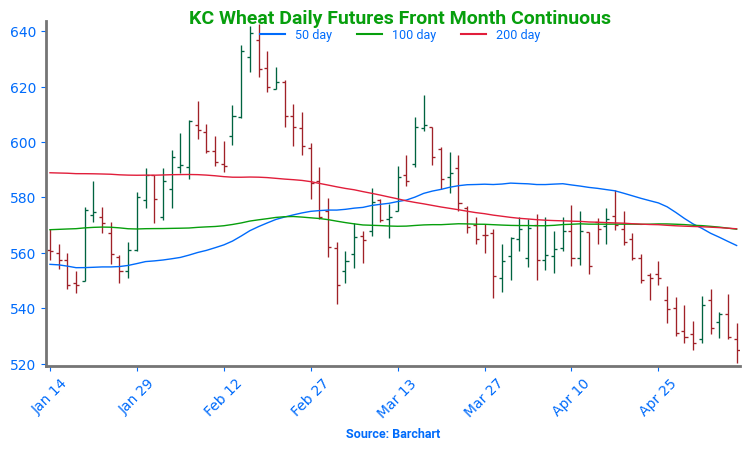
K.C. Wheat |
||
| JUL ’25 | 527 | 2.25 |
| SEP ’25 | 540.75 | 2 |
| JUL ’26 | 596.5 | 0 |
|
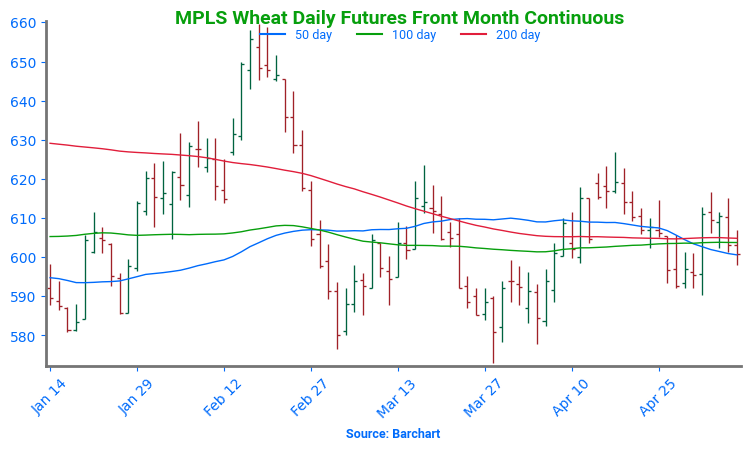
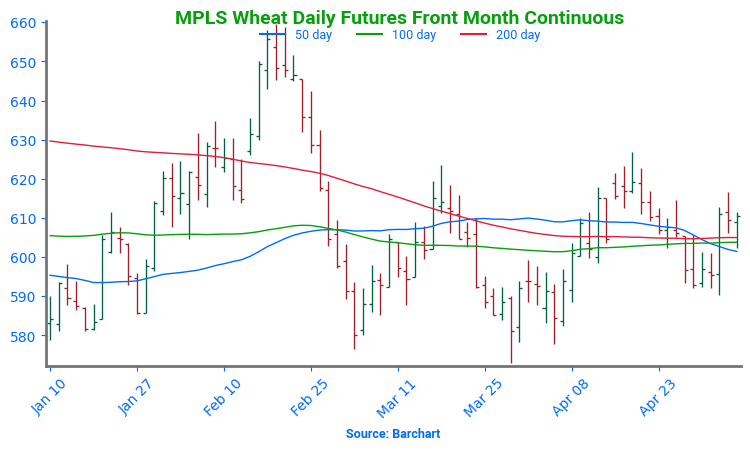
Mpls Wheat |
||
| JUL ’25 | 602.75 | 2 |
| SEP ’25 | 614.75 | 2.25 |
| SEP ’26 | 661.25 | 0 |
|
S&P 500 |
||
| JUN ’25 | 5704.5 | 20 |
|
Crude Oil |
||
| JUL ’25 | 60.81 | 1.29 |
|
Gold |
||
| AUG ’25 | 3363.6 | 28.9 |


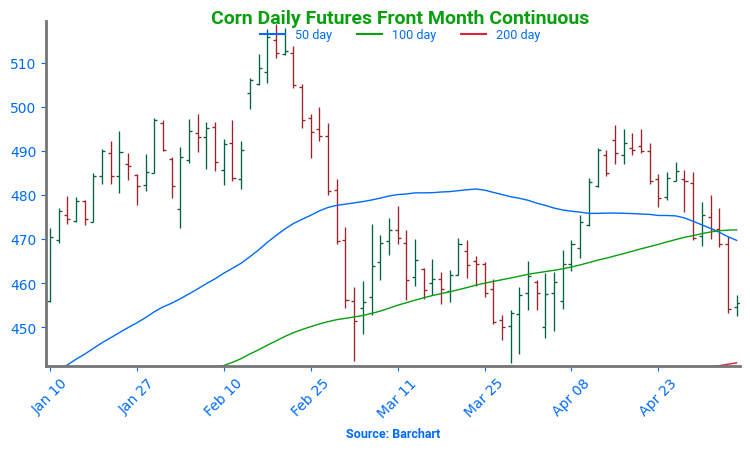
- Corn is trading higher this morning and so far has taken back all of yesterday’s losses and then some. Yesterday’s export sales were encouraging and were padded by two separate flash sales.
- Yesterday, President Trump announced a trade agreement with the UK, part of which would reduce ethanol tariffs on British imports to 0%. This comes before another potential trade deal with China tomorrow.
- On Monday, the USDA will release its WASDE report, and trade expects US old crop ending stocks to fall to 1.444 bb which would be down 21 mb from April. This would likely come from an increase in exports.

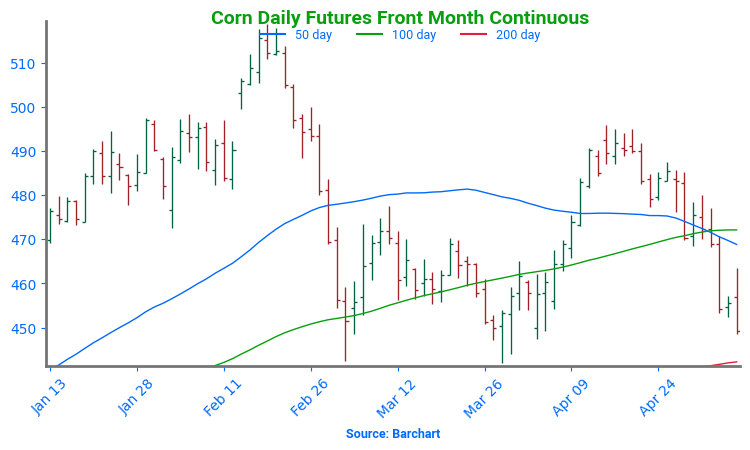
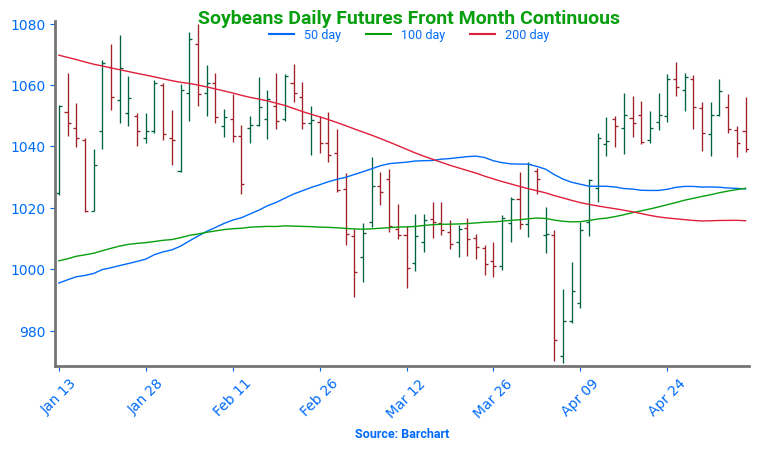
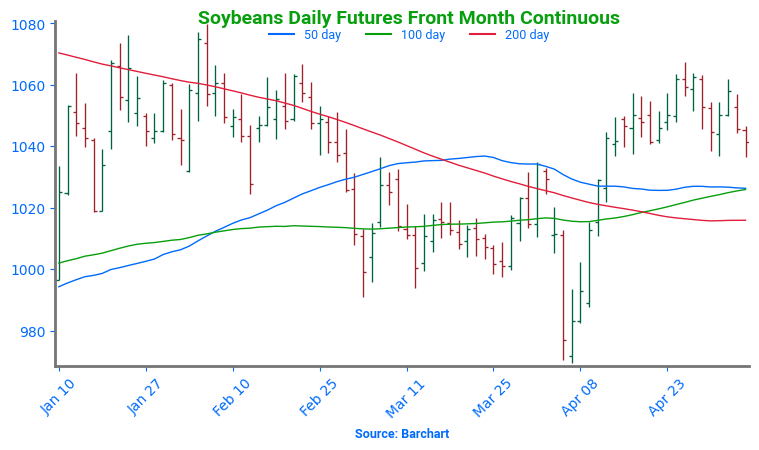
- Soybeans are trading higher this morning ahead of a potential trade deal with China tomorrow. July futures remain rangebound and are sitting right at the 100-day moving average. Both soybean meal and oil are trading higher as well.
- Tomorrow, President Trump and President Xi will meet in Geneva to discuss a potential trade deal, and ahead of this meeting, Trump has floated the idea of cutting tariffs on China from 145% to 80%.
- On Monday, the WASDE report will be released and trade expects the 2024/25 U.S. soybean carryout near 369 million bushels vs USDA’s 374, and 2025/26 at 362 million. The expected 2025 U.S. soybean crop is projected at 4.338 billion bushels, slightly below last year’s 4.366 billion.

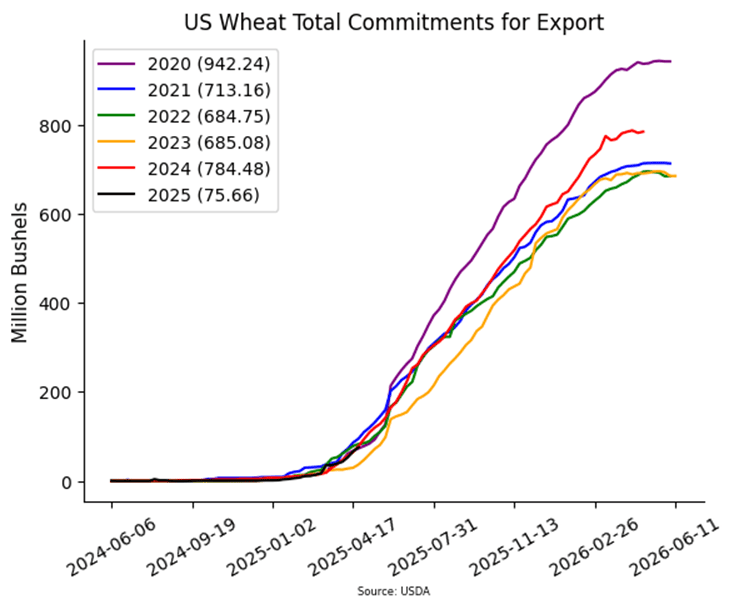
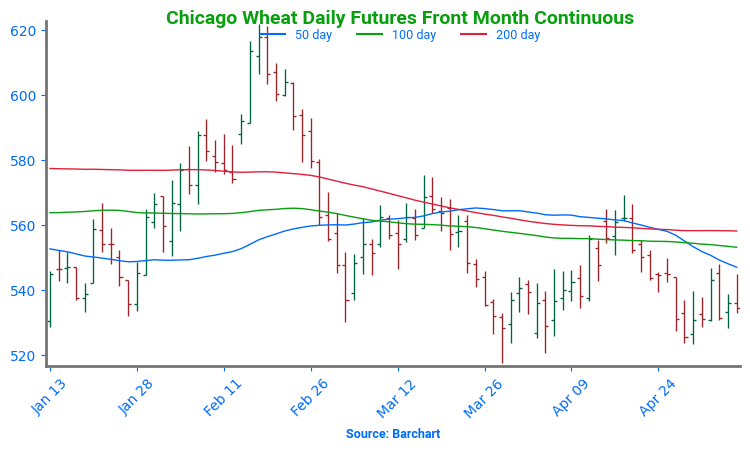
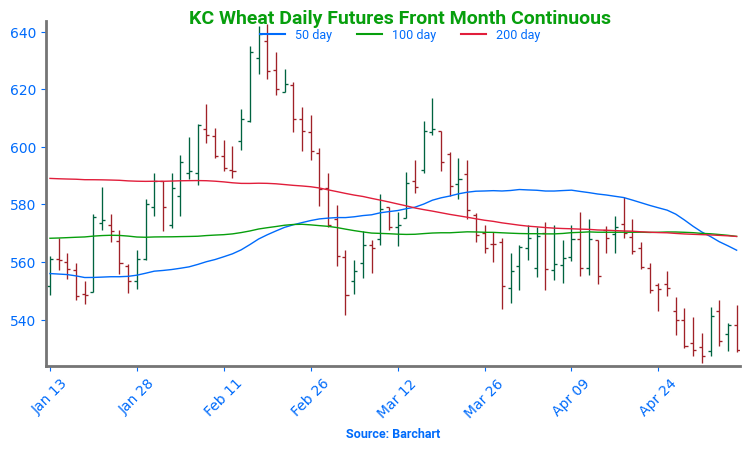
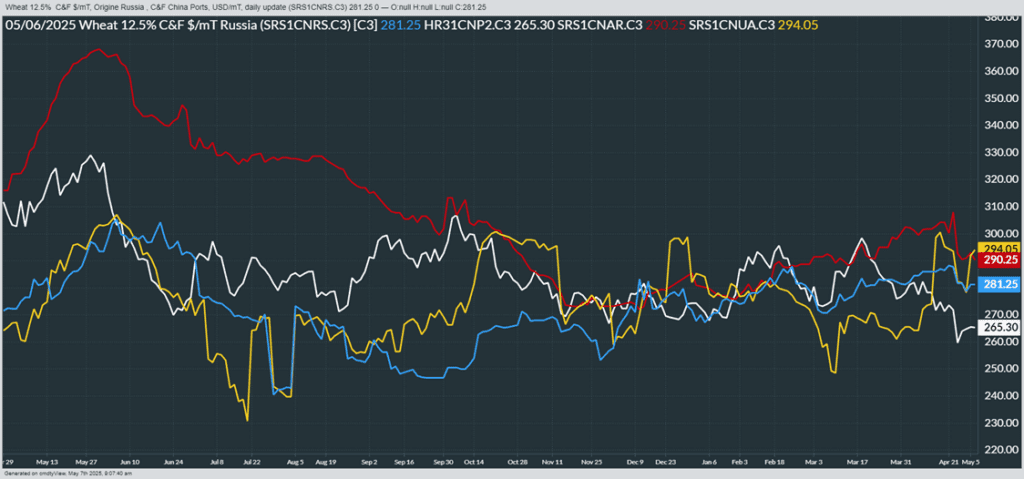
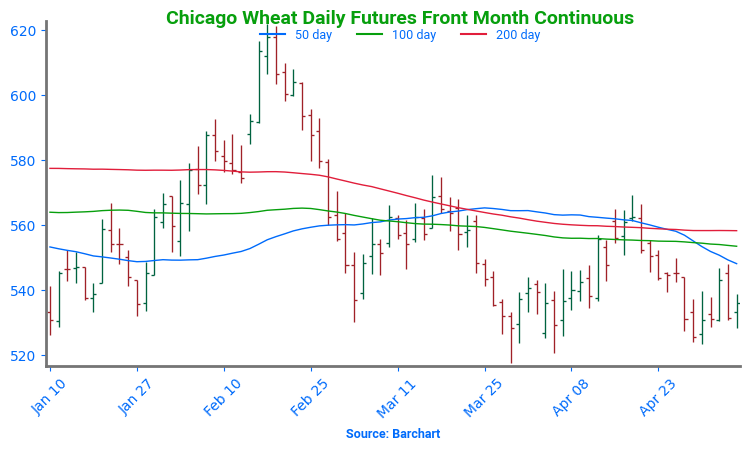
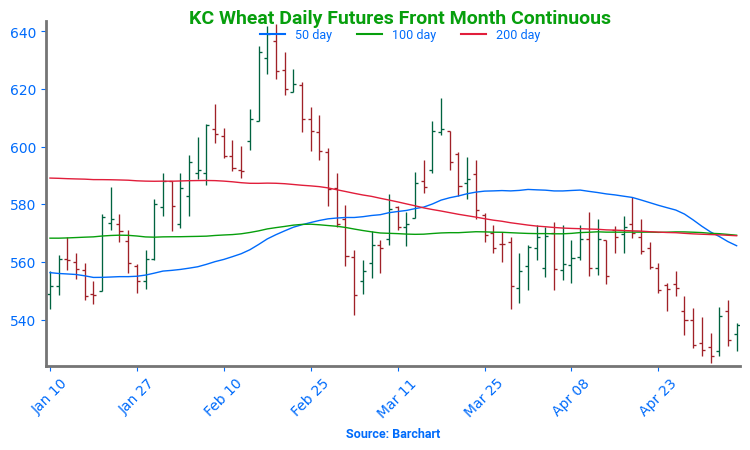
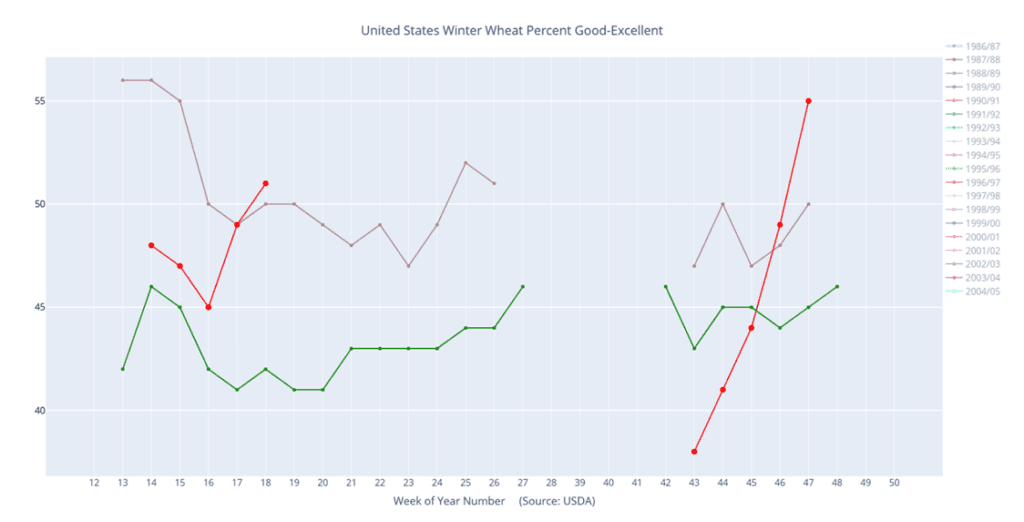
- All three wheat classes are trading higher this morning with Chicago wheat leading the way following yesterday’s losses and a low of $5.25-1/2 in July.
- Yesterday’s export sales were better than normal at 562.7k tons. This compared to 310.3k last week and 447.1k a year ago at this time. Top destinations were unknown, South Korea, and Mexico.
- Estimates for Monday’s WASDE reports see the trade expecting the 2025/26 U.S. wheat carryout near 863 million bushels and projects the 2025 wheat crop at 1.885 billion bushels, down from last year’s 1.971 billion.
Grain Market Insider is provided by Stewart-Peterson Inc., a publishing company.
Futures and options trading involve significant risk of loss and may not be suitable for everyone. Therefore, carefully consider whether such trading is suitable for you in light of your financial condition. The data contained herein is believed to be drawn from reliable sources but cannot be guaranteed. This material has been prepared by a sales or trading employee or agent of Total Farm Marketing by Stewart-Peterson and is, or is in the nature of, a solicitation. Any decisions you may make to buy, sell or hold a futures or options position on such research are entirely your own and not in any way deemed to be endorsed by or attributed to Stewart-Peterson Inc. Reproduction of this information without prior written permission is prohibited. Hypothetical performance results have many inherent limitations. No representation is being made that any account will or is likely to achieve profits or losses similar to those shown. The data contained herein is believed to be drawn from reliable sources but cannot be guaranteed. Reproduction and distribution of this information without prior written permission is prohibited. This material has been prepared by a sales or trading employee or agent of Total Farm Marketing and is, or is in the nature of, a solicitation. Any decisions you may make to buy, sell or hold a position on such research are entirely your own and not in any way deemed to be endorsed by or attributed to Total Farm Marketing.
Stewart-Peterson Inc., Stewart-Peterson Group Inc., and SP Risk Services LLC are each part of the family of companies within Total Farm Marketing (TFM). Stewart-Peterson Inc. is a publishing company. Stewart-Peterson Group Inc. is registered with the Commodity Futures Trading Commission (CFTC) as an introducing broker and is a member of National Futures Association. SP Risk Services LLC is an insurance agency. A customer may have relationships with any or all three companies.