Corn continues to back off at midday, pressured by favorable growing conditions over the next 6-10 days.
The USDA announced that Mexico was a buyer of 104,000 tons of U.S. corn for delivery during the 2024/25 year. An additional 101,096 tons of U.S. corn were also sold to unknown destinations for delivery during the 2024/25 year as well.
The European Commission has cut their forecast for corn production from 65 mmt to 63.8 mmt.
Soybeans have reversed lower at midday on pressure from recent rainfall and a favorable weather outlook heading into June.
The U.S. trade court has ruled that many of President Trump’s global tariff policies were illegal and could have to be removed. The Trump administration has already filed a notice that they are planning to appeal the decision.
Malaysia is looking to implement the use of B30 biofuels in its transportation sector by 2030 as the country continues to increase its environmental sustainability efforts.
Wheat prices continue to trend lower at midday, pressured by overnight rains in Oklahoma and Kansas.
Sovecon has raised their Russian wheat export forecast for the 2025/26 season to 40.8 mmt, up from the groups previous estimate of 39.7 mmt.
The EU has slightly raised their total soft wheat production estimate from 126.3 mmt to 126.6 mmt.
Canada cut their wheat production estimate by 3% to 35.3 mmt due to dryness across the southern Prairies.
Grain Market Insider is provided by Stewart-Peterson Inc., a publishing company.
Futures and options trading involve significant risk of loss and may not be suitable for everyone. Therefore, carefully consider whether such trading is suitable for you in light of your financial condition. The data contained herein is believed to be drawn from reliable sources but cannot be guaranteed. This material has been prepared by a sales or trading employee or agent of Total Farm Marketing by Stewart-Peterson and is, or is in the nature of, a solicitation. Any decisions you may make to buy, sell or hold a futures or options position on such research are entirely your own and not in any way deemed to be endorsed by or attributed to Stewart-Peterson Inc. Reproduction of this information without prior written permission is prohibited. Hypothetical performance results have many inherent limitations. No representation is being made that any account will or is likely to achieve profits or losses similar to those shown. The data contained herein is believed to be drawn from reliable sources but cannot be guaranteed. Reproduction and distribution of this information without prior written permission is prohibited. This material has been prepared by a sales or trading employee or agent of Total Farm Marketing and is, or is in the nature of, a solicitation. Any decisions you may make to buy, sell or hold a position on such research are entirely your own and not in any way deemed to be endorsed by or attributed to Total Farm Marketing.
Stewart-Peterson Inc., Stewart-Peterson Group Inc., and SP Risk Services LLC are each part of the family of companies within Total Farm Marketing (TFM). Stewart-Peterson Inc. is a publishing company. Stewart-Peterson Group Inc. is registered with the Commodity Futures Trading Commission (CFTC) as an introducing broker and is a member of National Futures Association. SP Risk Services LLC is an insurance agency. A customer may have relationships with any or all three companies.
Corn is trading lower again today after a sharp drop yesterday as well. The July contract has led the way lower losing 13-1/2 cents on the week so far compared to December which has only lost 10 cents.
Pressure has come from necessary rains over the past week and more in the forecast throughout the the Corn Belt. Although longer term forecasts maybe hot and dry, these rains are a big benefit.
Estimates for the weekly EIA report see ethanol production higher than last week at 1.05m barrels per day compared to 1.029m last week. The average stockpile estimate is 24.587m bbl which would be down from a week ago.
Soybeans are trading slightly higher this morning after rough trade yesterday that saw futures fall 14 cents before stopping at support at the 100-day moving average. Soybean meal is slightly lower while bean oil is higher.
Weather has been a primary factor in soybeans’ inability to rally, but they have been supported by the 100-day moving average since the middle of April along with tight new crop supplies.
Last night, the US trade court ruled that the tariffs imposed on China by President Trump were not legal which could remove the tariffs placed on soybeans and improve demand.
All three wheat classes are trading lower again today despite this week’s crop progress report that saw spring wheat crop ratings well below average guesses at 43%.
Yesterday morning’s rally following the crop progress numbers was quickly jumped on by sellers as funds continue to take any opportunity to sell higher wheat. They currently hold a net short position in Chicago wheat of around 110,000 contracts.
Canadian wheat production is estimated to be lower as a result of dryness in the southern Prairies. Production is estimated to be lowered by 3% to 35.5 mmt as soil moisture conditions deteriorate.
Grain Market Insider is provided by Stewart-Peterson Inc., a publishing company.
Futures and options trading involve significant risk of loss and may not be suitable for everyone. Therefore, carefully consider whether such trading is suitable for you in light of your financial condition. The data contained herein is believed to be drawn from reliable sources but cannot be guaranteed. This material has been prepared by a sales or trading employee or agent of Total Farm Marketing by Stewart-Peterson and is, or is in the nature of, a solicitation. Any decisions you may make to buy, sell or hold a futures or options position on such research are entirely your own and not in any way deemed to be endorsed by or attributed to Stewart-Peterson Inc. Reproduction of this information without prior written permission is prohibited. Hypothetical performance results have many inherent limitations. No representation is being made that any account will or is likely to achieve profits or losses similar to those shown. The data contained herein is believed to be drawn from reliable sources but cannot be guaranteed. Reproduction and distribution of this information without prior written permission is prohibited. This material has been prepared by a sales or trading employee or agent of Total Farm Marketing and is, or is in the nature of, a solicitation. Any decisions you may make to buy, sell or hold a position on such research are entirely your own and not in any way deemed to be endorsed by or attributed to Total Farm Marketing.
Stewart-Peterson Inc., Stewart-Peterson Group Inc., and SP Risk Services LLC are each part of the family of companies within Total Farm Marketing (TFM). Stewart-Peterson Inc. is a publishing company. Stewart-Peterson Group Inc. is registered with the Commodity Futures Trading Commission (CFTC) as an introducing broker and is a member of National Futures Association. SP Risk Services LLC is an insurance agency. A customer may have relationships with any or all three companies.
🌽 Corn: Corn futures fell sharply Tuesday as strong planting progress, early harvest reports from Brazil, and concerns about weakening U.S. export demand pressured the market.
🌱 Soybeans: Soybean futures ended lower Tuesday, with July closing just below the 100-day moving average for the first time this month, as rapid U.S. planting progress, weaker soy product prices, and limited fresh news pressured the market.
🌾 Wheat: Wheat futures closed mixed after choppy trade, with Minneapolis leading to the upside following weaker-than-expected spring wheat condition ratings. In contrast, HRW wheat came under pressure as recent rains and warming temperatures are expected to benefit the crop.
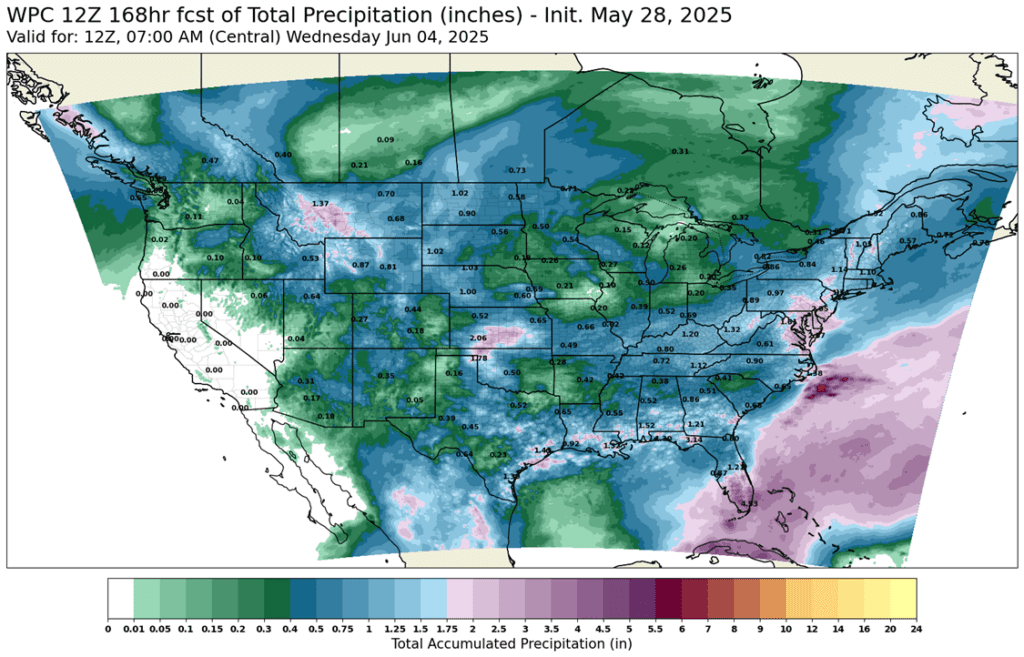
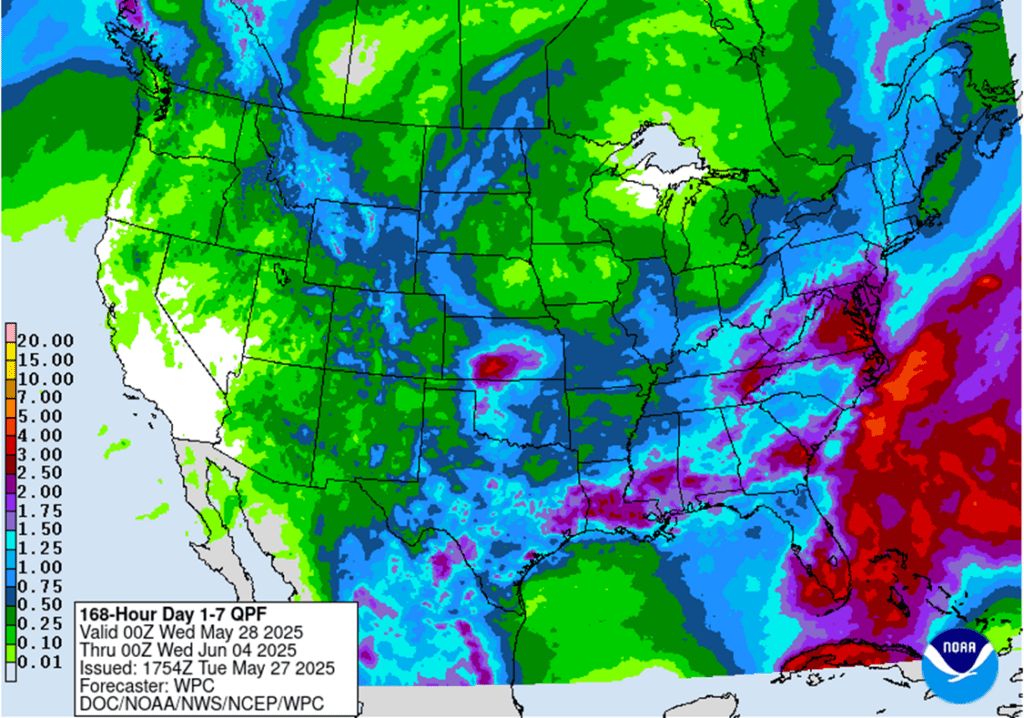
To see updated U.S. weather outlook maps scroll down to the other charts/weather section.
Note – For the best viewing experience, some Grain Market Insider content is best viewed with your phone held horizontally.
Corn
2024 Crop:
Plan A: No active targets.
Plan B: No active targets.
Details:
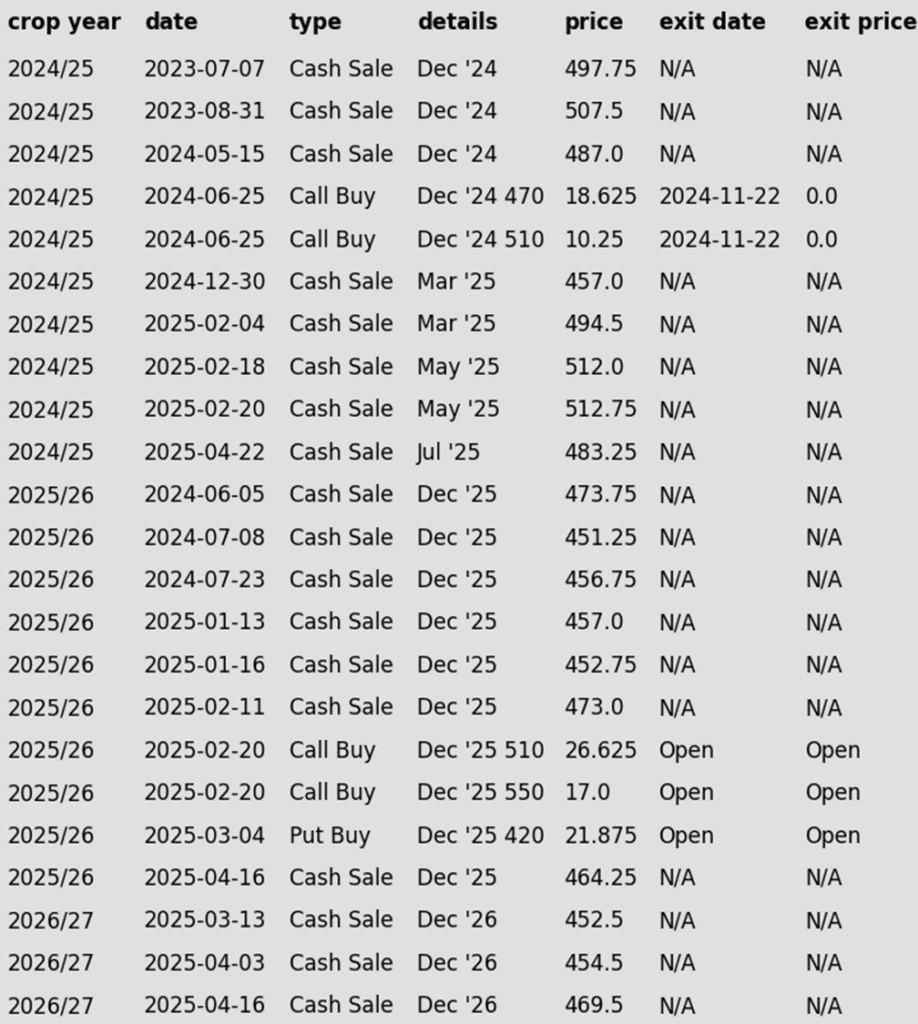
Sales Recs: Eight sales recommendations made to date, with an average price of 494.
Changes:
None.
With July corn continuing to hold support at 440, the strategy remains to hold out for potential upside volatility opportunities.
2025 Crop:
Plan A:
Exit all 510 December calls @ 43-5/8 cents.
Exit half of the December 420 puts @ 43-3/4 cents.
Exit one-quarter of the December 420 puts if December closes at 411 or lower.
Roll-down 510 & 550 December calls if December drops to 399.
Plan B: No active targets.
Details:
SalesRecs: Seven sales recommendations have been made to date, with an average price of 461.25.
Changes:
None.
No adjustments needed at the moment. Positioned well for growing season volatility, with a good base of sales in place and both upside and downside targets active to begin legging out of open options positions.
2026 Crop:
Plan A: Next cash sale at 474 vs December ‘26.
Plan B: No active targets.
Details:
Sales Recs: Three sales recommendations have been made to date, with an average price of 460.
Changes:
None.
The 474 target will be given this week. If it hasn’t been hit by Friday’s close, another sales recommendation may be made early next week based on the calendar and timing considerations.
To date, Grain Market Insider has issued the following corn recommendations:
Corn futures faced sharp selling pressure on Tuesday, with weakness in the July contract spilling over into the broader complex. The market was weighed down by strong planting progress, early harvest reports from Brazil, and growing concerns about waning U.S. export demand.
Brazil has just begun its harvest of their second crop corn. The weather has been very good for most regions, and the market is anticipating a strong crop. USDA is currently projecting this crop at 130 MMT, but there are “whisper” numbers up to 140 MMT.
Brazilian corn prices have fallen, making them competitive with U.S. exports. Reports suggest that some Asian buyers secured Brazilian supplies this week, raising the risk of U.S. export sales cancellations as demand shifts south.
U.S. planting is nearing completion, with the USDA reporting 87% of corn acres planted as of May 25, up 5 percentage points from last week. While national progress is on track, states like Illinois and others in the Eastern Corn Belt remain behind average, largely due to excessive rainfall. Final planting dates in these regions are fast approaching in early June.
USDA released the first initial corn crop ratings in Tuesday’s report. As of May 25, the USDA found that 68% of the crop was good/excellent. This was 5% below analysts’ expectations. These ratings were the third lowest in the past 10 years and 4% behind the 3-year average. Wet and cool temperatures limit a strong start in some areas and capped the first crop ratings.
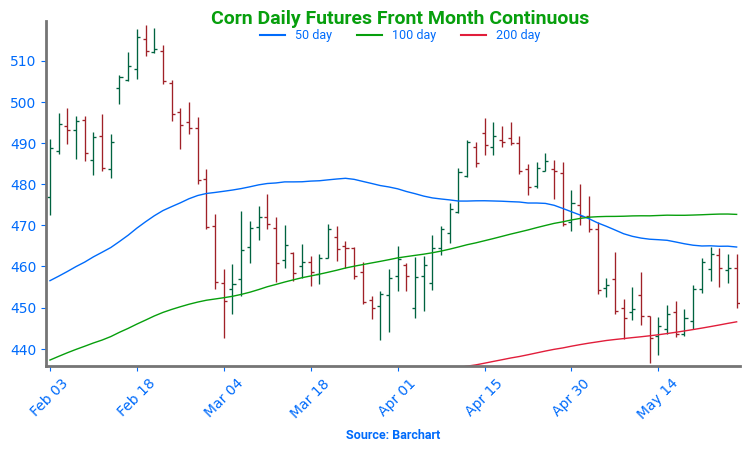
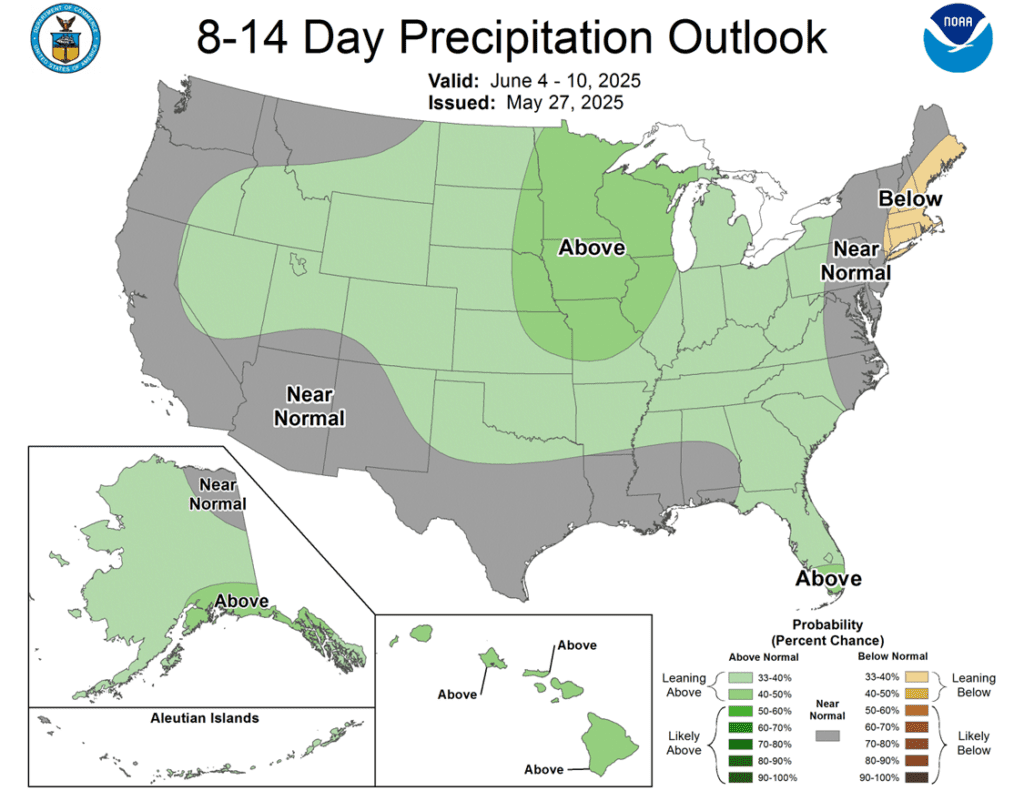
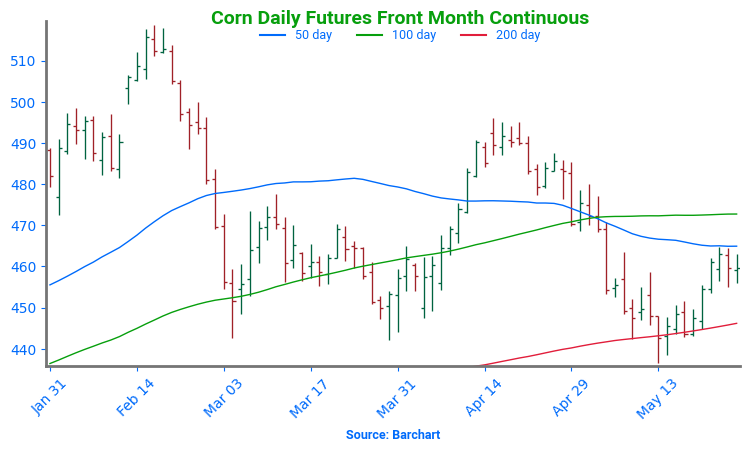
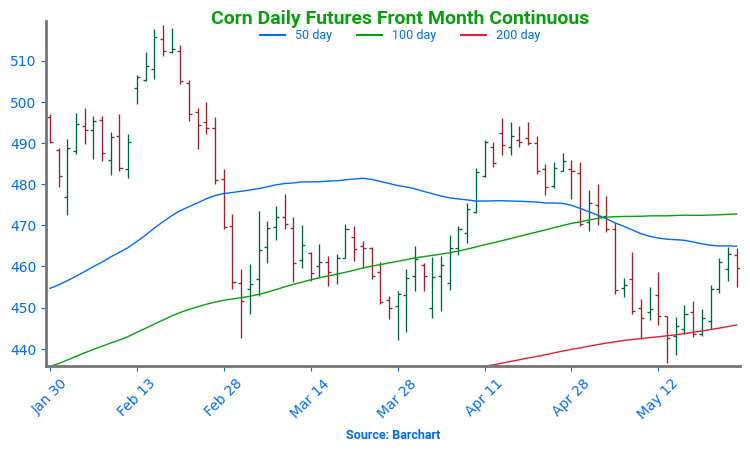
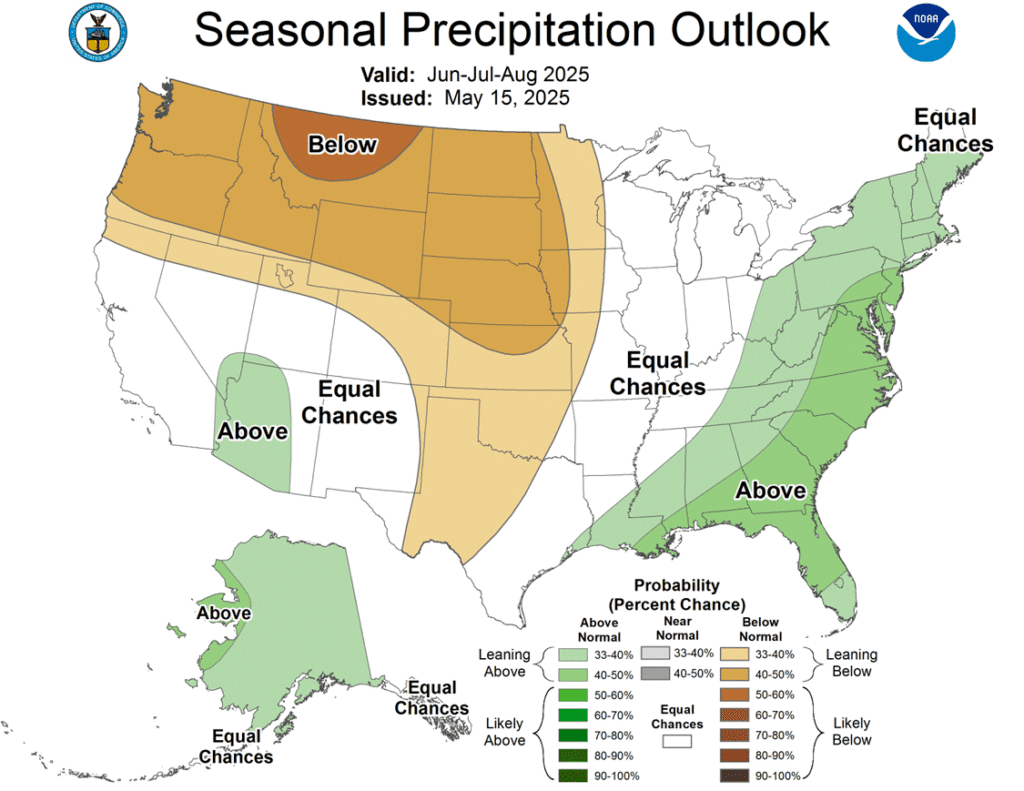
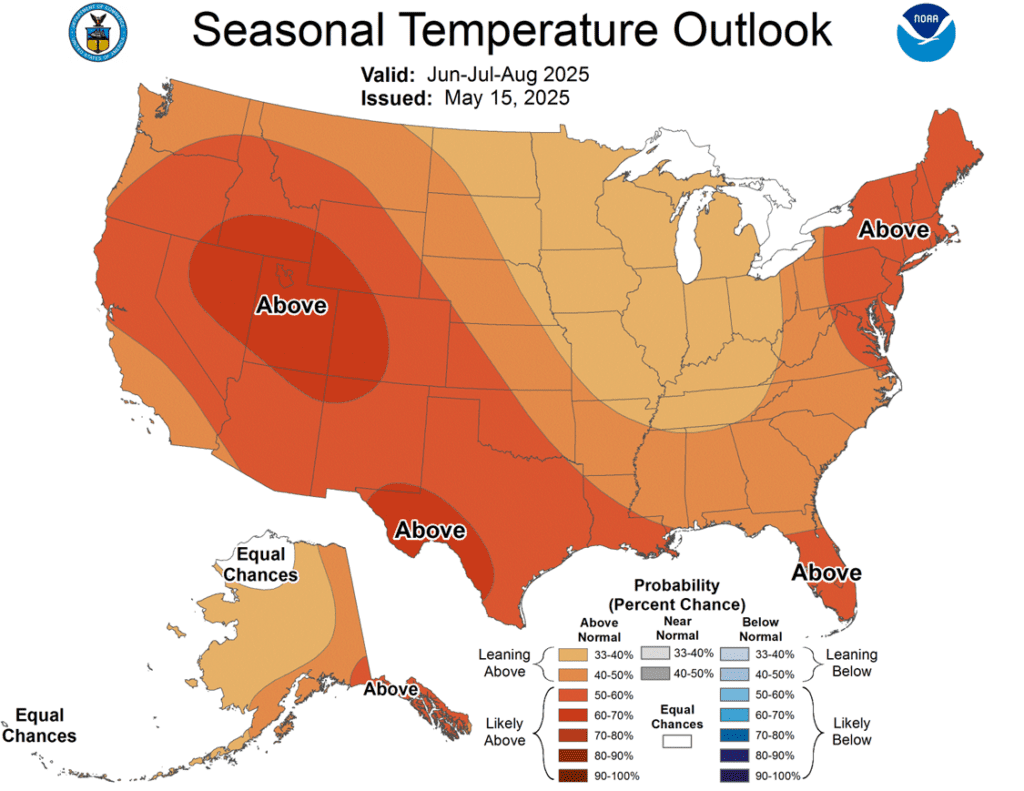
Corn Finds Support at 200-day After bouncing off the key $4.50 level in April on a bullish WASDE and a break above the 50-day moving average, corn futures have come under renewed pressure in May. Rapid planting progress and lingering demand concerns have pushed prices back below $4.70. For now, the $4.45–$4.50 support zone and 200-day moving average have held. As planting wraps up, the market’s focus will shift quickly to summer weather. NOAA’s extended outlook calls for a warmer, drier pattern across the Western Corn Belt into June — potentially rekindling risk premium and setting the stage for weather-driven rallies. Initial resistance is expected near $4.70, with stronger resistance at the April highs around $4.90.
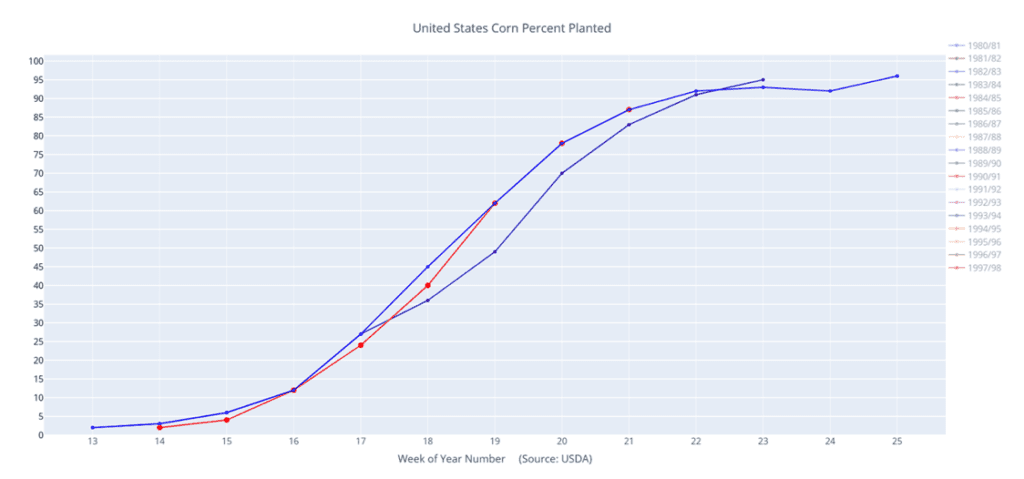
Above: Corn percent planted (red) versus the 10-year average (blue) and last year (purple).
Soybeans
2024 Crop:
Plan A: Next cash sale at 1107 vs July.
Plan B: No active targets.
Details:
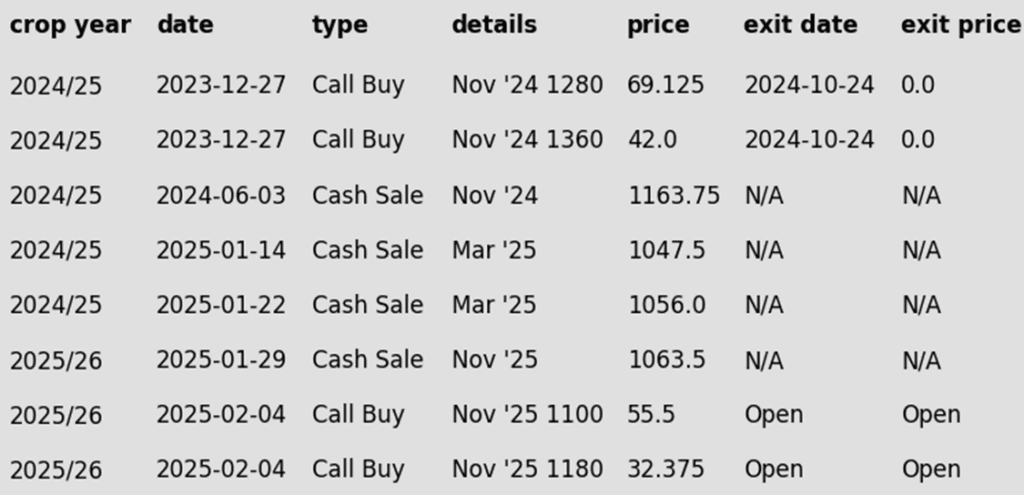
Sales Recs: Three sales recommendations made to date, with an average price of 1089.
Changes:
None.
Still content with the 1107 target as long as 1036 support holds. If that support level is broken, the current strategy will need to be revisited and potentially adjusted.
2025 Crop:
Plan A:
Next cash sales at 1114 vs November.
Exit one-third of 1100 call options at 1085 vs November.
Exit remaining two-thirds of 1100 November call options at 88 cents.
Plan B:
Make a cash sale if November closes below 1018.50 support.
Details:
Sales Recs: One sales recommendation made so far to date, at 1063.50.
Changes:
In about a week, another tranche of January put options may be recommended based on the calendar and seasonal timing considerations.
2026 Crop:
Plan A: No active targets.
Plan B: No active targets.
Details:
Sales Recs: Zero sales recommendations made so far to date.
Changes:
None.
Approaching the seasonal window where first sales targets could post at any time.
To date, Grain Market Insider has issued the following soybean recommendations:
Soybeans ended the day lower with the July contract closing just below the 100-day moving average for the first time since the beginning of the month. There has been little fresh news, but the continued quick planting pace and lower soy products were the primary pressure today.
Yesterday’s Crop Progress report saw the soybean crop 76% planted, which compared to 66% last week and the 5-year average of 68%. 50% of the crop has emerged, and good to excellent ratings will likely come within a few weeks.
In Argentina, the recent rains and severe flooding near Buenos Aires will likely impact the country’s total production. One prominent South American crop scout has lowered their estimate by 1.6 mmt for total production of 48.5 mmt. In Brazil, soybean production is estimated near 170 mmt.
At this time, funds are estimated to hold a net long position in soybeans of around 10,000 contracts and are estimated to have a long position in soybean oil around 59,000 contracts. In soybean meal, however, they hold a net short position of over 100,000 contracts, which is a record short position and could trigger short covering at some point.
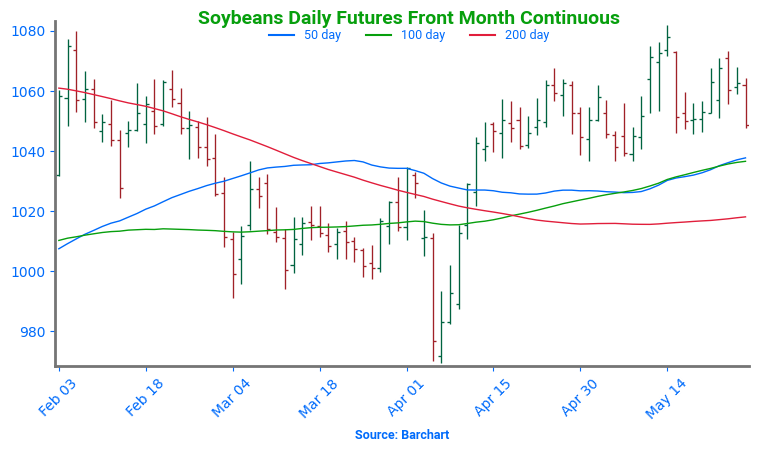
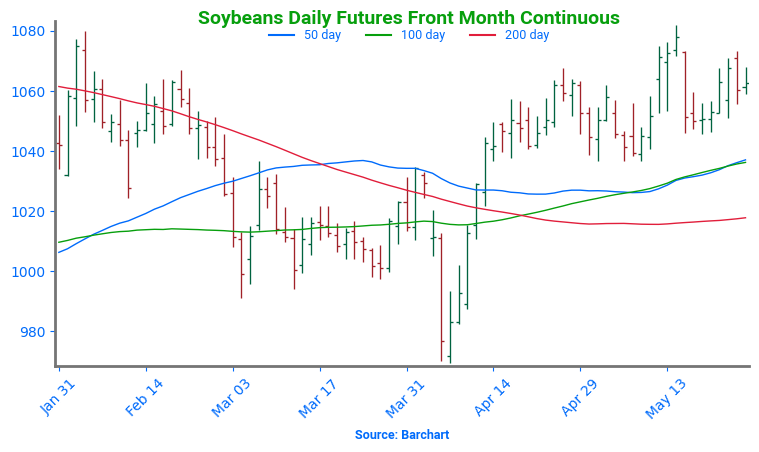
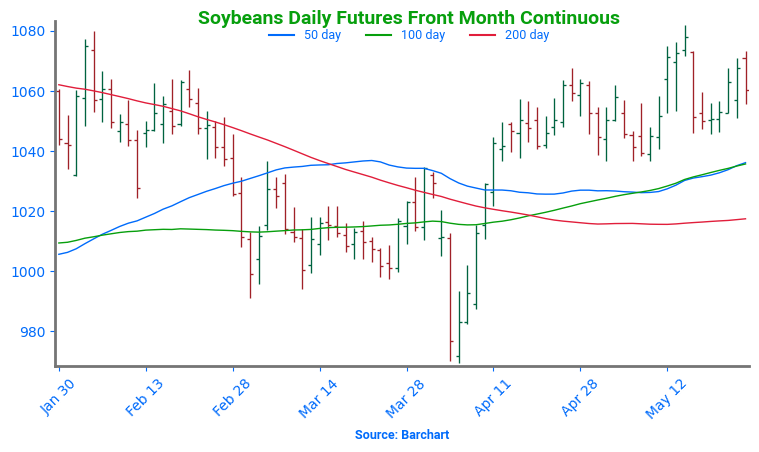
Soybean Futures Hover Near Top of Yearly Range Amid Renewed Optimism After tumbling below the psychologically important 1000 mark in early April on tariff-related headlines, soybean futures appeared to be in freefall. The break of the March floor sparked a wave of technical selling, briefly sending prices spiraling. But the decline proved fleeting. Buyers quickly stepped in, reversing the momentum and powering futures back above 1000, reclaiming key moving averages along the way.
Of particular note was the clean break above the 200-day moving average — a barrier that had long capped upside attempts. With that ceiling now acting as solid support, bullish sentiment has taken the driver’s seat. Futures are now consolidating near the upper end of their 2024 range, setting their sights on a potential retest of the February peak around $10.80. As long as pullbacks hold the 200-day line, the path of least resistance may remain higher.
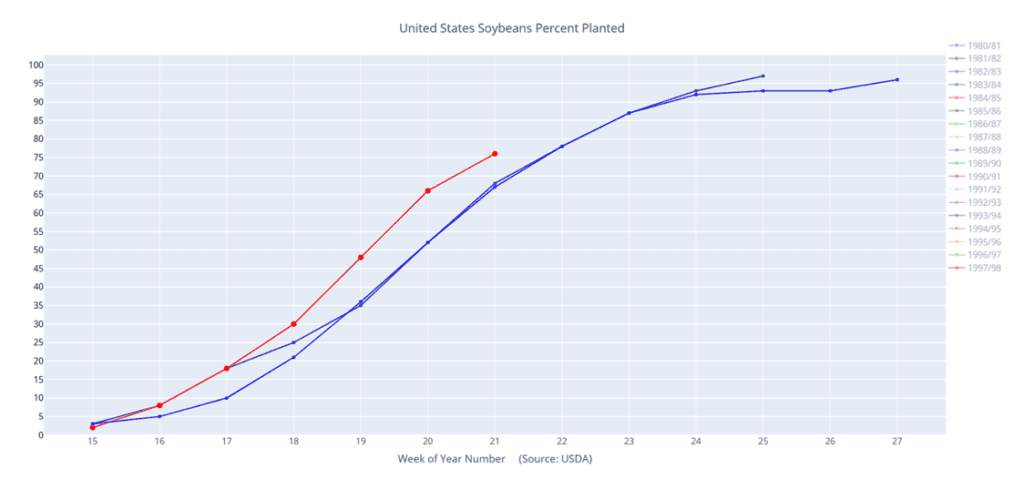
Above: Soybeans percent planted (red) versus the 10-year average (blue) and last year (purple).
Wheat
Market Notes: Wheat
Wheat futures closed mixed after choppy trade, with Minneapolis leading to the upside following weaker-than-expected spring wheat condition ratings. In contrast, HRW wheat came under pressure as recent rains and warming temperatures are expected to benefit the crop. Technically, both Chicago and Kansas City contracts have lost momentum, with daily stochastics and RSI indicators turning lower, while Minneapolis futures trend sideways to higher.
USDA’s Crop Progress report showed winter wheat conditions declining 2 points to 50% good/excellent, while 75% of the crop is headed—above the 70% five-year average. Spring wheat planting reached 87% (vs. 80% avg.), and 60% of the crop has emerged. However, only 45% was rated good/excellent, missing expectations and supporting Minneapolis’ futures.
India’s wheat harvest is reportedly going well and is now expected to be about 4 mmt above last year’s crop. This could push their state reserves to 44 mmt this year, well above what is needed to meet domestic demand. This has effectively eliminated earlier anticipation that they might need to import wheat this year, which is now likely to pressure global prices. Despite this, however, the Indian government still has no plan to allow wheat exports, which were prohibited in 2022.
According to the German association of farm cooperatives, their nation’s 2025 wheat harvest is expected to total 21.01 mmt, which would be down 0.40 mmt from their previous estimate. However, if realized this would still be a 13.6% larger crop year over year. Yield reductions from late winter frosts and drought in the spring are cited as the reasons for the decline from the prior estimate.
2024 Crop:
Plan A:
Target 699.25 vs July for the next sale.
Plan B: No active targets.
Details:
Sales Recs: Four sales recommendations made to date, with an average price of 690.
Changes:
None.
While 699.25 is still a long way off, it’s tough to justify adjusting it lower at this point — historically, when volatility shows up this time of year, it can be significant.
2025 Crop:
Plan A:
Target 693.75 against July for the next sale.
Plan B:
Buy call options if July closes over 633.50 macro resistance.
Details:
Sales Recs: Five sales recommendations made to date, with an average price of 646.
Changes:
Plan B Update: A Plan B Update: A Plan B upside call buy stop has been added, with 633.50 identified as a key resistance level for the broader trend. A close above this level could indicate a shift toward a more bullish macro trend. In that scenario, buying call options would enable sales into strength while maintaining paper ownership.
The purpose of this stop is to try to avoid recommending call option purchases unless the market clearly signals it’s warranted — and a close above 633.50 would be that signal. As long as the market remains below this level, the expectation is for a continued sideways-to-lower macro trend, where call options would provide little or no benefit.
2026 Crop:
Plan A:
Target 675 vs July ‘26 for the next sale.
Plan B: No active targets.
Details:
Sales Recs: One sales recommendation made to date, at 624.
Changes:
None.
To date, Grain Market Insider has issued the following Chicago Wheat recommendations:
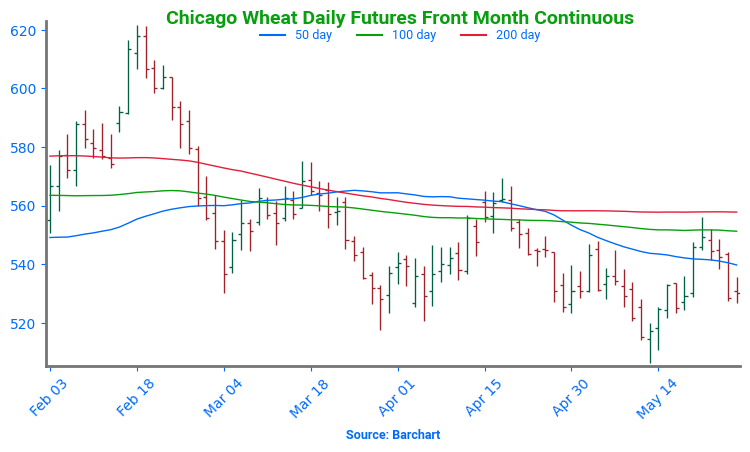
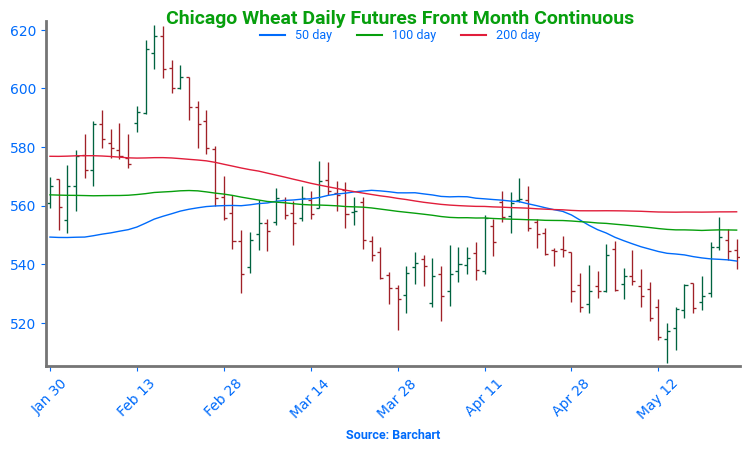
Chicago Wheat Looking for Support After months of range-bound trading, Chicago wheat futures broke out in February, climbing to October highs just above 615. However, the rally proved short-lived, with prices quickly retreating back into their 2024 range. By mid-May, futures broke below key support near 530 and are now searching for a bottom around the 520 level. The next major technical hurdle is the 200-day moving average — a firm weekly close above this level could signal a potential trend reversal and open the door to a broader uptrend.
2024 Crop:
Plan A: No active targets.
Plan B: No active targets.
Details:
Sales Recs: Three sales recommendations made to date, with an average price of 677.
Changes:
None.
2025 Crop:
Plan A: No active targets.
Plan B:
Buy call options if July closes over 653 macro resistance.
Details:
Sales Recs: Four sales recommendations made to date, with an average price of 639.
Changes:
Plan B Update: A Plan B upside call buy stop has been added, with 653 identified as a key resistance level for the broader trend. A close above this level could indicate a shift toward a more bullish macro trend. In that scenario, buying call options would enable sales into strength while maintaining paper ownership.
The purpose of this stop is to try to avoid recommending call option purchases unless the market clearly signals it’s warranted — and a close above 653 would be that signal. As long as the market remains below this level, the expectation is for a continued sideways-to-lower macro trend, where call options would provide little or no benefit.
2026 Crop:
Plan A: No active targets.
Plan B: No active targets.
Details:
Sales Recs: Zero sales recommendations made so far to date.
Changes:
None.
First sales targets are expected to post after June 1.
To date, Grain Market Insider has issued the following KC recommendations:
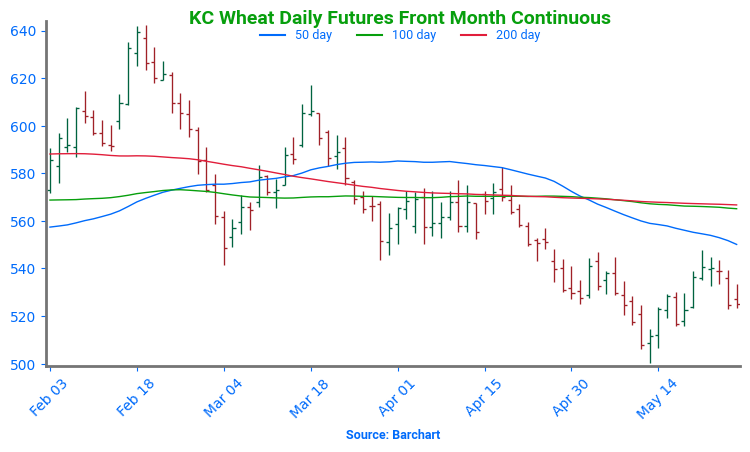
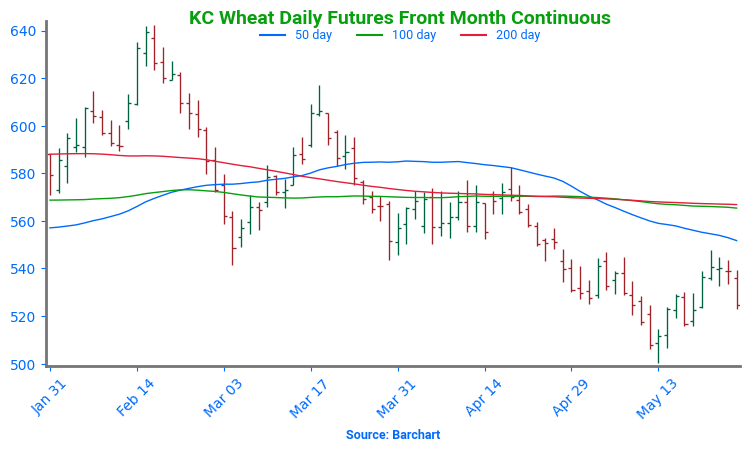
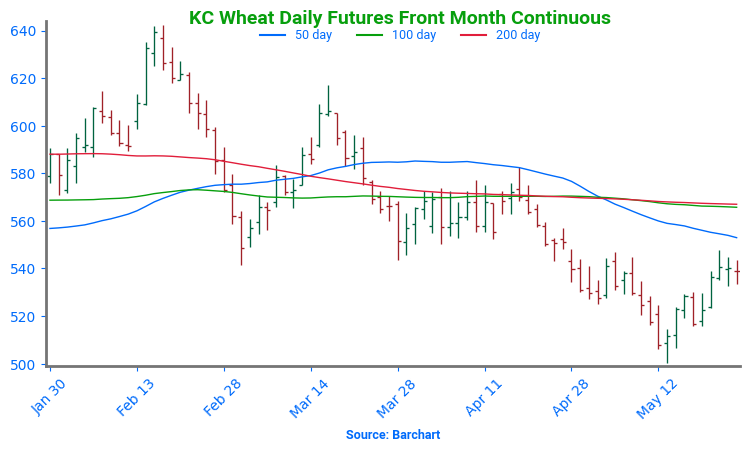
Kansas City Wheat Searching for Support Kansas City wheat experienced sharp volatility in February, rallying early before settling flat by month’s end. Persistent weakness through March and April pushed prices toward recent lows — and the market broke below that support to start May. A recovery back above the prior 540 level would signal a potential bottom. On a rebound, the 200-day moving average stands as the first resistance, with a more formidable ceiling at the February highs near 640.
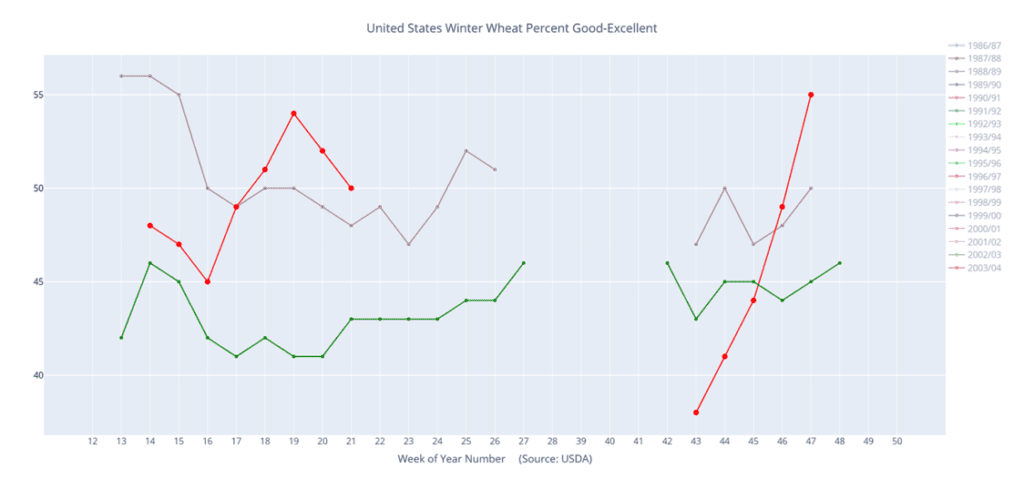
Above: Winter wheat percent planted (red) versus the 5-year average (green) and last year (purple).
2024 Crop:
Plan A: No active targets.
Plan B: No active targets.
Details:
Sales Recs: Five sales recommendations made to date, with an average price of 696.
Changes:
None.
2025 Crop:
Plan A: No active targets.
Plan B:
Buy KC call options if July KC closes over 653 macro resistance.
Note: KC options are being used due to the strong correlation between KC and Minneapolis futures prices, as well as the greater liquidity found in the KC options market.
Details:
Sales Recs: Five sales recommendations made to date, with an average price of 646.
Changes:
Plan B Update: A Plan B upside call buy stop has been added, with KC 653 identified as a key resistance level for the broader trend. A close above this level could indicate a shift toward a more bullish macro trend. In that scenario, buying call options would enable sales into strength while maintaining paper ownership.
The purpose of this stop is to try to avoid recommending call option purchases unless the market clearly signals it’s warranted — and a close above KC 653 would be that signal. As long as the market remains below this level, the expectation is for a continued sideways-to-lower macro trend, where call options would provide little or no benefit.
2026 Crop:
Plan A: No active targets.
Plan B: No active targets.
Details:
Changes:
None.
First sales targets are expected to post after July 1.
To date, Grain Market Insider has issued the following Minneapolis wheat recommendations:
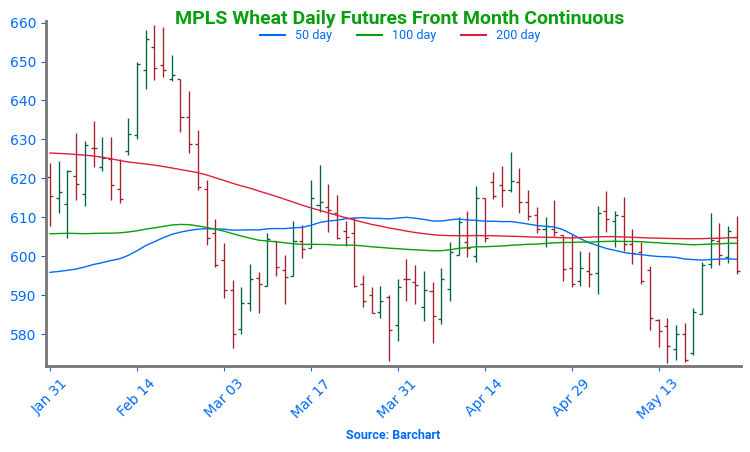
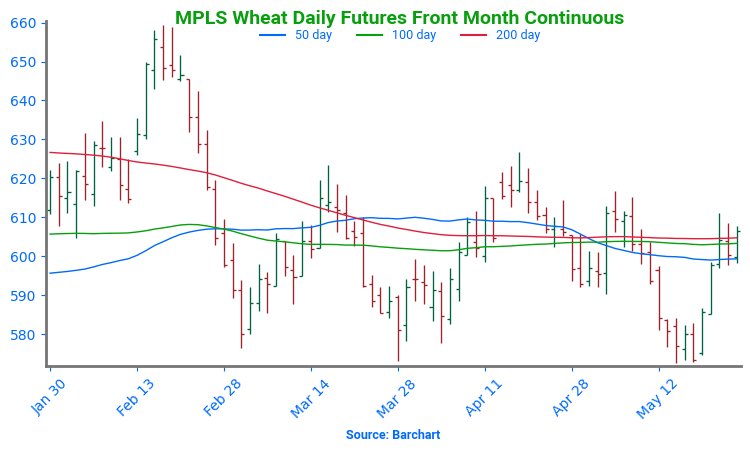
Spring Wheat Holds Recent Lows Spring wheat futures broke out of a prolonged sideways trend in late January, sparking a wave of bullish momentum. The rally gained strength in mid-February with a decisive close above the 200-day moving average. However, late-month weakness briefly dragged futures back below key support levels. Currently, futures are retreating toward recent lows, pressured by strong planting progress and favorable weather conditions across major spring wheat-growing regions. On a potential rebound, initial resistance is expected near the 600 level, where a confluence of moving averages could cap gains.
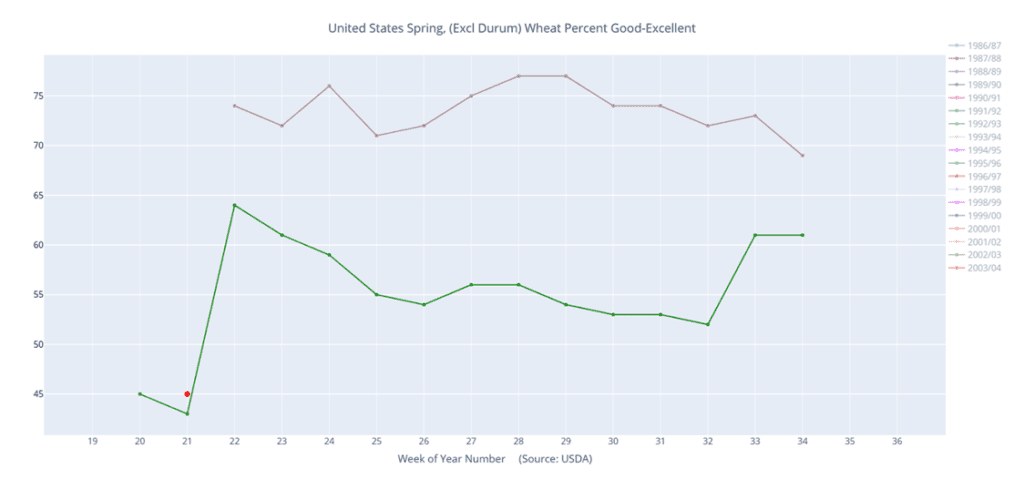
Above: Spring wheat condition percent good-excellent (red) versus the 5-year average (green) and last year (pink).
Corn futures are trending lower at midday, pressured by favorable growing conditions and beneficial weather outlook heading into the first part of June.
Yesterday’s Crop Progress report showed corn planting at 87% complete with 67% of the crop emerged. Initial crop ratings are seen at 68% good-to-excellent, which was below the average guess of 73%.
South Africa’s Crop Estimates Committee has lowered their corn production forecast slightly to 14.6 mmt, down 0.1% from their previous estimate.
Soybeans are seeing weakness at midday, pressured by recent rains and planting progress outpacing the 5-year average.
Yesterday’s Crop Progress report showed soybean planting has now reached 76% compared to the 5-year average of 68% at the same time. 50% of the crop has also emerged.
According to Anec, Brazil’s soy exports are now seen reaching 14.03 mmt in May compared to the group’s previous estimate of 14.52 mmt.
Wheat futures remain slightly higher entering midday as prices rebound following yesterday’s sell-off.
Yesterday’s Crop Progress report showed winter wheat conditions at 50% good-excellent, down 2 points from last week but 2 points higher from the same week last year. Spring wheat ratings are seen at 45% good-to-excellent, which was well below the average trade guess of 70%.
The EU’s soft wheat exports as of May 25th totaled 18.8 mmt, down 34% from a year ago.
Grain Market Insider is provided by Stewart-Peterson Inc., a publishing company.
Futures and options trading involve significant risk of loss and may not be suitable for everyone. Therefore, carefully consider whether such trading is suitable for you in light of your financial condition. The data contained herein is believed to be drawn from reliable sources but cannot be guaranteed. This material has been prepared by a sales or trading employee or agent of Total Farm Marketing by Stewart-Peterson and is, or is in the nature of, a solicitation. Any decisions you may make to buy, sell or hold a futures or options position on such research are entirely your own and not in any way deemed to be endorsed by or attributed to Stewart-Peterson Inc. Reproduction of this information without prior written permission is prohibited. Hypothetical performance results have many inherent limitations. No representation is being made that any account will or is likely to achieve profits or losses similar to those shown. The data contained herein is believed to be drawn from reliable sources but cannot be guaranteed. Reproduction and distribution of this information without prior written permission is prohibited. This material has been prepared by a sales or trading employee or agent of Total Farm Marketing and is, or is in the nature of, a solicitation. Any decisions you may make to buy, sell or hold a position on such research are entirely your own and not in any way deemed to be endorsed by or attributed to Total Farm Marketing.
Stewart-Peterson Inc., Stewart-Peterson Group Inc., and SP Risk Services LLC are each part of the family of companies within Total Farm Marketing (TFM). Stewart-Peterson Inc. is a publishing company. Stewart-Peterson Group Inc. is registered with the Commodity Futures Trading Commission (CFTC) as an introducing broker and is a member of National Futures Association. SP Risk Services LLC is an insurance agency. A customer may have relationships with any or all three companies.
Corn is trading higher this morning after yesterday’s lower trade. The first look at crop conditions was poorer than expected adding some support, but July corn has struggled to trade above the 200-day moving average.
Yesterday’s Crop Progress report saw the first crop ratings of the year at 68% good to excellent which was below the trade guess of 73%. 87% of the crop has been planted and 67% is now emerged.
After substantial rains last week, the forecast for this week is very light for most of the Corn Belt which should give producers a good opportunity to get planting wrapped up.
Soybeans are trading lower to start the day but remain relatively rangebound and above all major moving averages. Yesterday, gains in palm and soybean oil were supportive while export inspections were slightly bearish. Today, soybean meal is lower while bean oil is higher.
Yesterday’s Crop Progress report saw the soybean crop 76% planted which compared to 66% last week and the 5-year average of 68%. 50% of the crop has emerged, and good to excellent ratings will likely come within a few weeks.
Yesterday’s export inspections came in at 195k tons for soybeans which compared to 225k tons the previous week and 223k tons a year ago at this time. Primary destinations were to Egypt, Mexico, and Taiwan.
All three wheat classes are trading higher to start the day after yesterday’s sharp sell-off. Yesterday’s move may have come from rain in China’s previously dry Wheat Belt along with rain in dry parts of the EU.
Yesterday’s Crop Progress for winter wheat showed crop conditions falling by 2 points to 50% good to excellent which compared to 48% a year ago at this time. 75% of the crop is headed which compared to 64% last week.
For spring wheat, the first crop ratings were released at 45% good to excellent which was significantly lower than the average estimate of 70%. 87% of the crop has been planted and 60% is not emerged.
Grain Market Insider is provided by Stewart-Peterson Inc., a publishing company.
Futures and options trading involve significant risk of loss and may not be suitable for everyone. Therefore, carefully consider whether such trading is suitable for you in light of your financial condition. The data contained herein is believed to be drawn from reliable sources but cannot be guaranteed. This material has been prepared by a sales or trading employee or agent of Total Farm Marketing by Stewart-Peterson and is, or is in the nature of, a solicitation. Any decisions you may make to buy, sell or hold a futures or options position on such research are entirely your own and not in any way deemed to be endorsed by or attributed to Stewart-Peterson Inc. Reproduction of this information without prior written permission is prohibited. Hypothetical performance results have many inherent limitations. No representation is being made that any account will or is likely to achieve profits or losses similar to those shown. The data contained herein is believed to be drawn from reliable sources but cannot be guaranteed. Reproduction and distribution of this information without prior written permission is prohibited. This material has been prepared by a sales or trading employee or agent of Total Farm Marketing and is, or is in the nature of, a solicitation. Any decisions you may make to buy, sell or hold a position on such research are entirely your own and not in any way deemed to be endorsed by or attributed to Total Farm Marketing.
Stewart-Peterson Inc., Stewart-Peterson Group Inc., and SP Risk Services LLC are each part of the family of companies within Total Farm Marketing (TFM). Stewart-Peterson Inc. is a publishing company. Stewart-Peterson Group Inc. is registered with the Commodity Futures Trading Commission (CFTC) as an introducing broker and is a member of National Futures Association. SP Risk Services LLC is an insurance agency. A customer may have relationships with any or all three companies.
🌽 Corn: Corn futures began the week on the defensive, with pressure from favorable crop weather and weakness in wheat weighing on new-crop contracts. However, July corn found modest support from strong weekly export shipment totals, helping limit losses in front-month trade.
🌱 Soybeans: Soybeans closed higher on the day, outperforming the broader grain complex. While overall trade was quiet, early strength was fueled by gains in palm and soybean oil. Both soybean meal and oil also finished higher, despite funds maintaining a heavy net short in the meal market.
🌾 Wheat: Wheat futures suffered double-digit losses across Chicago, Kansas City, and Minneapolis, pressured by improving weather in the U.S. and Europe, a stronger U.S. dollar, and competitive global pricing—particularly from Russia. Paris milling wheat also declined, adding weight to the U.S. market.
To see updated U.S. weather outlook maps scroll down to the other charts/weather section.
Note – For the best viewing experience, some Grain Market Insider content is best viewed with your phone held horizontally.
Corn
2024 Crop:
Plan A: No active targets.
Plan B: No active targets.
Details:
Sales Recs: Eight sales recommendations made to date, with an average price of 494.
Changes:
None.
With July corn continuing to hold support at 440, the strategy remains to hold out for potential upside volatility opportunities.
2025 Crop:
Plan A:
Exit all 510 December calls @ 43-5/8 cents.
Exit half of the December 420 puts @ 43-3/4 cents.
Exit one-quarter of the December 420 puts if December closes at 411 or lower.
Roll-down 510 & 550 December calls if December drops to 399.
Plan B: No active targets.
Details:
SalesRecs: Seven sales recommendations have been made to date, with an average price of 461.25.
Changes:
None.
No adjustments needed at the moment. Positioned well for growing season volatility, with a good base of sales in place and both upside and downside targets active to begin legging out of open options positions.
2026 Crop:
Plan A: Next cash sale at 474 vs December ‘26.
Plan B: No active targets.
Details:
Sales Recs: Three sales recommendations have been made to date, with an average price of 460.
Changes:
None.
The 474 target will be given this week. If it hasn’t been hit by Friday’s close, another sales recommendation may be made early next week based on the calendar and timing considerations.
To date, Grain Market Insider has issued the following corn recommendations:
Corn futures started the week under pressure, with July contracts finding modest support from strong export shipments. However, weakness in the wheat market and expectations for improving crop conditions weighed on new-crop contracts.
USDA reported corn export inspections at 1.396 MMT (55 mb) for the week ending May 22, bringing total shipments for the marketing year to 1.850 billion bushels—up 29% from a year ago. Inspections remain ahead of pace to meet USDA’s projection for the second-largest corn export program in five years.
USDA will release weekly crop progress on Tuesday afternoon. The expectation for corn planting is to reach 87% planted, up 9% from last week. Areas in the southern to eastern corn belt will be closely watched for progress as those regions have been behind pace due to wetness.
The first condition rating for the 2025/26 corn crop is also due Tuesday, with analysts expecting a Good/Excellent rating around 73% (range: 64–78%). Cooler, wetter weather across parts of the Corn Belt may weigh on early crop development by limiting growing degree day accumulation.
Harvest of Brazil’s second corn crop has begun, with AgRural estimating progress at 0.9%, down from 2% at this time last year. Brazil’s crop agency, CONAB, projects the safrinha crop at nearly 100 MMT as of its May estimate.
Corn Finds Support at 200-day After bouncing off the key $4.50 level in April on a bullish WASDE and a break above the 50-day moving average, corn futures have come under renewed pressure in May. Rapid planting progress and lingering demand concerns have pushed prices back below $4.70. For now, the $4.45–$4.50 support zone and 200-day moving average have held. As planting wraps up, the market’s focus will shift quickly to summer weather. NOAA’s extended outlook calls for a warmer, drier pattern across the Western Corn Belt into June — potentially rekindling risk premium and setting the stage for weather-driven rallies. Initial resistance is expected near $4.70, with stronger resistance at the April highs around $4.90.
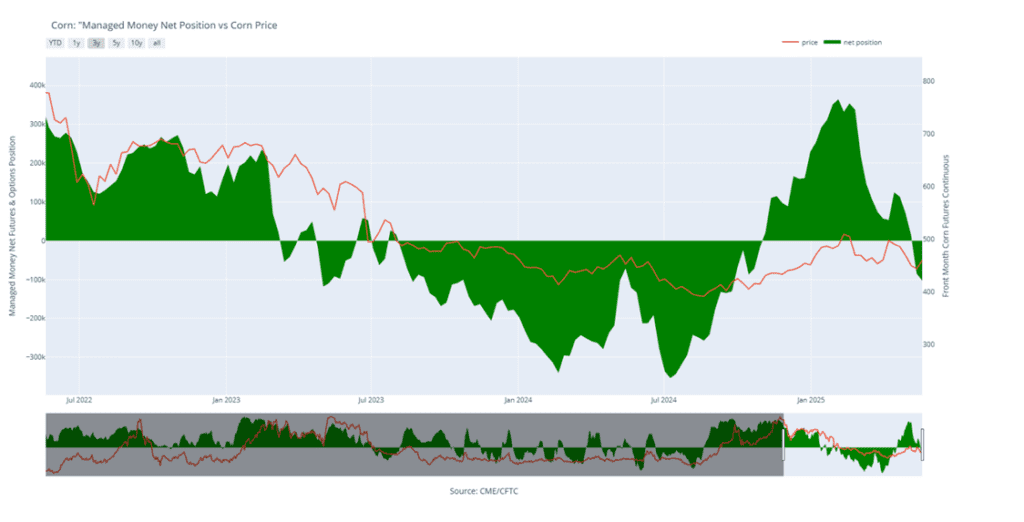
Above: Corn Managed Money Funds net position as of Tuesday, May 20. Net position in Green versus price in Red. Money Managers net sold 18,234 contracts between May 13 – May 20, bringing their total position to a net short 103,210 contracts.
Soybeans
2024 Crop:
Plan A: Next cash sale at 1107 vs July.
Plan B: No active targets.
Details:
Sales Recs: Three sales recommendations made to date, with an average price of 1089.
Changes:
None.
Still content with the 1107 target as long as 1036 support holds. If that support level is broken, the current strategy will need to be revisited and potentially adjusted.
2025 Crop:
Plan A:
Next cash sales at 1114 vs November.
Exit one-third of 1100 call options at 1085 vs November.
Exit remaining two-thirds of 1100 November call options at 88 cents.
Plan B:
Make a cash sale if November closes below 1018.50 support.
Details:
Sales Recs: One sales recommendation made so far to date, at 1063.50.
Changes:
In about a week, another tranche of January put options may be recommended based on the calendar and seasonal timing considerations.
2026 Crop:
Plan A: No active targets.
Plan B: No active targets.
Details:
Sales Recs: Zero sales recommendations made so far to date.
Changes:
None.
Approaching the seasonal window where first sales targets could post at any time.
To date, Grain Market Insider has issued the following soybean recommendations:
Soybeans ended the day higher despite losses in the rest of the grain complex. Overall, soybeans traded quietly but had some early strength thanks to gains in both palm and soybean oil. Funds currently hold a record large net short position in soybean meal, but both meal and oil closed higher today.
Weekly export inspections for soybeans came in weak, totaling just 7.1 million bushels for the week ending May 22. Still, total inspections for the 2024/25 marketing year stand at 1.629 billion bushels—up 11% from last year.
Soybean acreage in India is reportedly set to shrink as farmers are looking to plant more corn and sugarcane due to higher returns. Lower oilseed output could force the world’s largest importer of edible oils to increase buying from other countries.
Friday’s CFTC report saw funds as sellers of soybeans by 25,753 contracts, which left them with a net long position of 12,654 contracts. They sold 10,123 contracts of bean oil and 4,721 contracts of meal.
Soybean Futures Hover Near Top of Yearly Range Amid Renewed Optimism After tumbling below the psychologically important 1000 mark in early April on tariff-related headlines, soybean futures appeared to be in freefall. The break of the March floor sparked a wave of technical selling, briefly sending prices spiraling. But the decline proved fleeting. Buyers quickly stepped in, reversing the momentum and powering futures back above 1000, reclaiming key moving averages along the way.
Of particular note was the clean break above the 200-day moving average — a barrier that had long capped upside attempts. With that ceiling now acting as solid support, bullish sentiment has taken the driver’s seat. Futures are now consolidating near the upper end of their 2024 range, setting their sights on a potential retest of the February peak around $10.80. As long as pullbacks hold the 200-day line, the path of least resistance may remain higher.
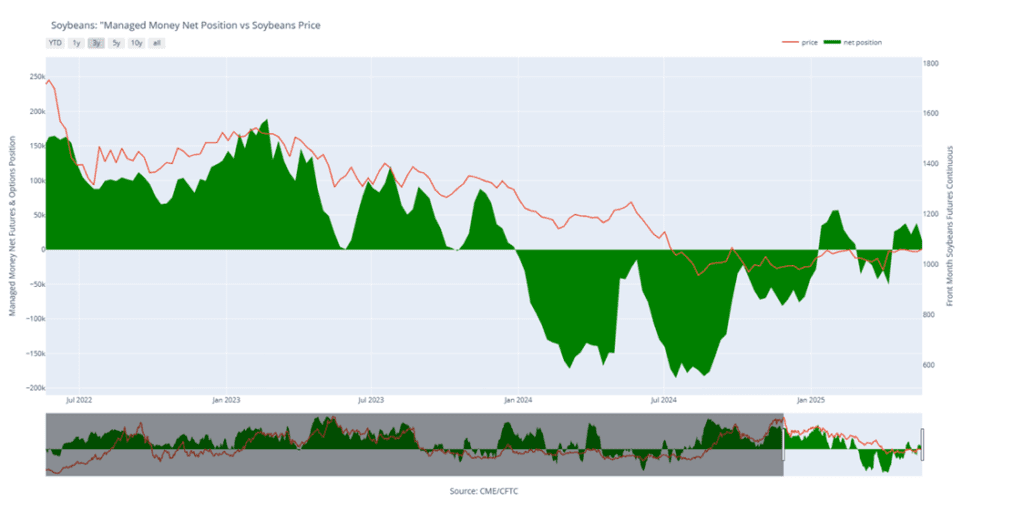
Above: Soybean Managed Money Funds net position as of Tuesday, May 20. Net position in Green versus price in Red. Money Managers net sold 25,753 contracts between May 13 – May 20, bringing their total position to a net long 12,654 contracts.
Wheat
Market Notes: Wheat
Wheat futures posted double-digit losses across all three U.S. exchanges to start the week, pressured by both global and domestic developments. Paris milling wheat futures also closed 4–5 euros lower, dragging on U.S. prices. A firmer U.S. dollar added headwinds for U.S. wheat on the export market.
Weekend rains across the U.S. southern and western Plains, along with scattered showers in Europe, eased immediate crop concerns. Heavier rainfall is expected next week in drier regions of France, Germany, and the UK, which further pressured futures.
Weekly wheat inspections at 20.6 mb bring the total 24/25 inspections figure to 782 mb, up 16% from last year. The inspections pace is steady with the USDA’s estimate – total 24/25 exports are projected at 820 mb, up 16% from the year prior.
China’s National Meteorological Center is predicting rainfall through the early part of next week for key wheat growing regions, including Henan and Shaanxi. This should help to ease drought conditions there. Henan province recently issued weather alerts due to excessive heat, which was a threat to their crops.
Australian customs data indicates that they exported only 546,000 mt of wheat to China during the October – March timeframe, due to a lack of Chinese demand. This compares with 2.9 mmt in the first half of the 23/24 season and 4.4 mmt for the same period of the 22/23 season. This could significantly increase Australia’s wheat stocks, with some estimates as high as 8 mmt. For reference, the five-year average for their end of season wheat stocks is 3.3 mmt.
According to SovEcon, Russian spot wheat export values range from $248-$250 per mt FOB. And as reported by IKAR, Russian export values July onward are around $225 per mt FOB, which is down $2 from last week. Competition from Russia has been weighing on wheat prices globally. Furthermore, Interfax has stated that the 2025 Russian grain harvest is likely to exceed last year’s, which would also be bearish to prices.
2024 Crop:
Plan A:
Target 699.25 vs July for the next sale.
Plan B: No active targets.
Details:
Sales Recs: Four sales recommendations made to date, with an average price of 690.
Changes:
None.
While 699.25 is still a long way off, it’s tough to justify adjusting it lower at this point — historically, when volatility shows up this time of year, it can be significant.
2025 Crop:
Plan A:
Target 693.75 against July for the next sale.
Plan B:
Buy call options if July closes over 633.50 macro resistance.
Details:
Sales Recs: Five sales recommendations made to date, with an average price of 646.
Changes:
Plan B Update: A Plan B Update: A Plan B upside call buy stop has been added, with 633.50 identified as a key resistance level for the broader trend. A close above this level could indicate a shift toward a more bullish macro trend. In that scenario, buying call options would enable sales into strength while maintaining paper ownership.
The purpose of this stop is to try to avoid recommending call option purchases unless the market clearly signals it’s warranted — and a close above 633.50 would be that signal. As long as the market remains below this level, the expectation is for a continued sideways-to-lower macro trend, where call options would provide little or no benefit.
2026 Crop:
Plan A:
Target 675 vs July ‘26 for the next sale.
Plan B: No active targets.
Details:
Sales Recs: One sales recommendation made to date, at 624.
Changes:
None.
To date, Grain Market Insider has issued the following Chicago Wheat recommendations:
Chicago Wheat Looking for Support After months of range-bound trading, Chicago wheat futures broke out in February, climbing to October highs just above 615. However, the rally proved short-lived, with prices quickly retreating back into their 2024 range. By mid-May, futures broke below key support near 530 and are now searching for a bottom around the 520 level. The next major technical hurdle is the 200-day moving average — a firm weekly close above this level could signal a potential trend reversal and open the door to a broader uptrend.
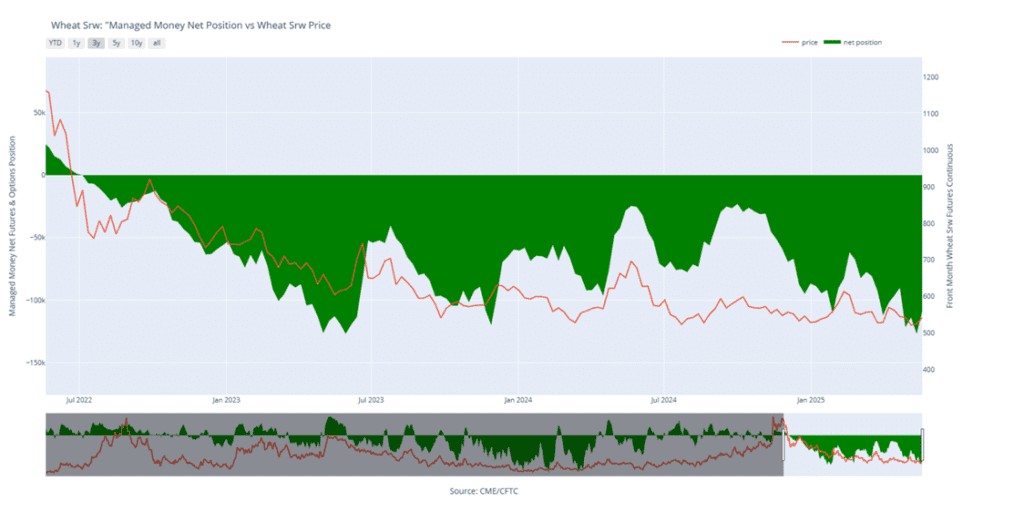
Above: Chicago Wheat Managed Money Funds’ net position as of Tuesday, May 20. Net position in Green versus price in Red. Money Managers net bought 18,002 contracts between May 13 – May 20, bringing their total position to a net short 108,893 contracts.
2024 Crop:
Plan A: No active targets.
Plan B: No active targets.
Details:
Sales Recs: Three sales recommendations made to date, with an average price of 677.
Changes:
None.
2025 Crop:
Plan A: No active targets.
Plan B:
Buy call options if July closes over 653 macro resistance.
Details:
Sales Recs: Four sales recommendations made to date, with an average price of 639.
Changes:
Plan B Update: A Plan B upside call buy stop has been added, with 653 identified as a key resistance level for the broader trend. A close above this level could indicate a shift toward a more bullish macro trend. In that scenario, buying call options would enable sales into strength while maintaining paper ownership.
The purpose of this stop is to try to avoid recommending call option purchases unless the market clearly signals it’s warranted — and a close above 653 would be that signal. As long as the market remains below this level, the expectation is for a continued sideways-to-lower macro trend, where call options would provide little or no benefit.
2026 Crop:
Plan A: No active targets.
Plan B: No active targets.
Details:
Sales Recs: Zero sales recommendations made so far to date.
Changes:
None.
First sales targets are expected to post after June 1.
To date, Grain Market Insider has issued the following KC recommendations:
Kansas City Wheat Searching for Support Kansas City wheat experienced sharp volatility in February, rallying early before settling flat by month’s end. Persistent weakness through March and April pushed prices toward recent lows — and the market broke below that support to start May. A recovery back above the prior 540 level would signal a potential bottom. On a rebound, the 200-day moving average stands as the first resistance, with a more formidable ceiling at the February highs near 640.
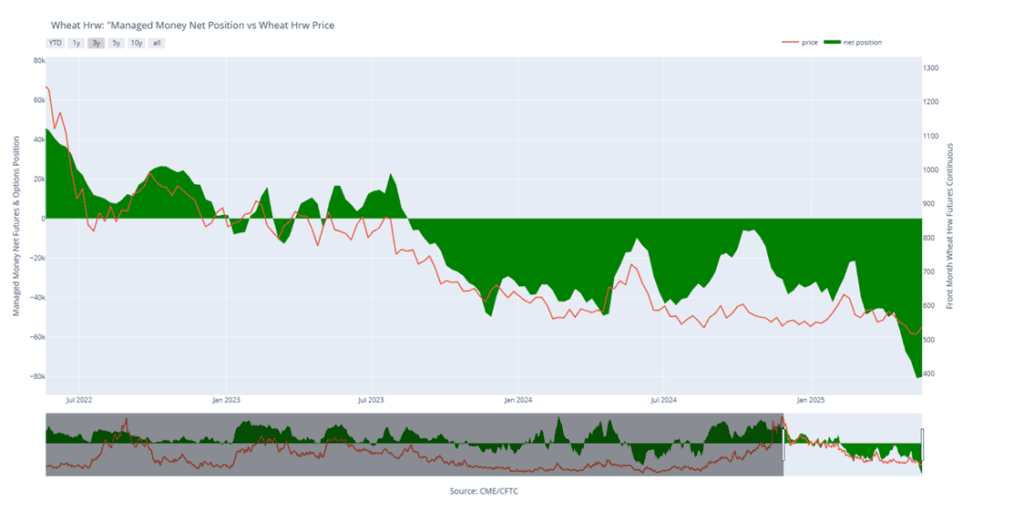
Above: KC Wheat Managed Money Funds’ net position as of Tuesday, May 20. Net position in Green versus price in Red. Money Managers net bought 637 contracts between May 13– May 20, bringing their total position to a net short 80,162 contracts.
2024 Crop:
Plan A: No active targets.
Plan B: No active targets.
Details:
Sales Recs: Five sales recommendations made to date, with an average price of 696.
Changes:
None.
2025 Crop:
Plan A: No active targets.
Plan B:
Buy KC call options if July KC closes over 653 macro resistance.
Note: KC options are being used due to the strong correlation between KC and Minneapolis futures prices, as well as the greater liquidity found in the KC options market.
Details:
Sales Recs: Five sales recommendations made to date, with an average price of 646.
Changes:
Plan B Update: A Plan B upside call buy stop has been added, with KC 653 identified as a key resistance level for the broader trend. A close above this level could indicate a shift toward a more bullish macro trend. In that scenario, buying call options would enable sales into strength while maintaining paper ownership.
The purpose of this stop is to try to avoid recommending call option purchases unless the market clearly signals it’s warranted — and a close above KC 653 would be that signal. As long as the market remains below this level, the expectation is for a continued sideways-to-lower macro trend, where call options would provide little or no benefit.
2026 Crop:
Plan A: No active targets.
Plan B: No active targets.
Details:
Changes:
None.
First sales targets are expected to post after July 1.
To date, Grain Market Insider has issued the following Minneapolis wheat recommendations:
Spring Wheat Holds Recent Lows Spring wheat futures broke out of a prolonged sideways trend in late January, sparking a wave of bullish momentum. The rally gained strength in mid-February with a decisive close above the 200-day moving average. However, late-month weakness briefly dragged futures back below key support levels. Currently, futures are retreating toward recent lows, pressured by strong planting progress and favorable weather conditions across major spring wheat-growing regions. On a potential rebound, initial resistance is expected near the 600 level, where a confluence of moving averages could cap gains.
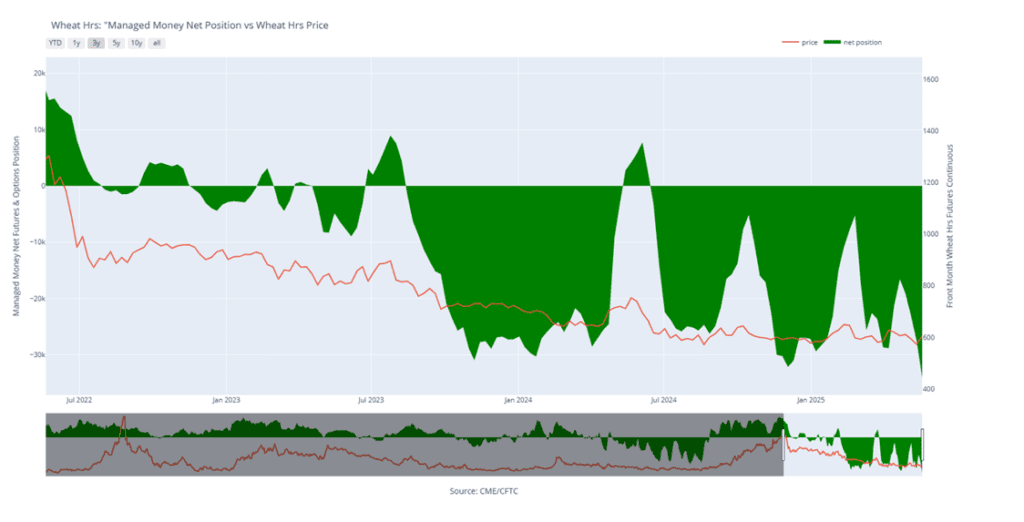
Above: Minneapolis Wheat Managed Money Funds’ net position as of Tuesday, May 20. Net position in Green versus price in Red. Money Managers net sold 6,621 contracts between May 13 – May 20, bringing their total position to a net short 34,140 contracts.
Corn prices continue to trend weaker at midday, pressured by rainfall over the weekend and lower wheat prices.
Paran and Datagro have raised their corn production forecast for Brazil to 132.7 mmt, up from their previous forecast of 131.7 mmt last month.
EU corn yields are widely expected to be higher this season due to favorable weather conditions. Yields are expected to reach 7.45 mt per hectare compared to the 5-year average of 7.09 mt per hectare.
Soybeans have reversed lower at midday on pressure from the rest of the grain market, which is also weaker at midday due to rainfall over the weekend.
Datagro has raised their soybean production estimate for Brazil to 172 mmt, up from 171.2 mmt in their previous estimate.
Soybean acreage in India is reportedly set to shrink as farmers are looking to plant more corn and sugarcane due to higher returns. Lower oilseed output could force the world’s largest importer of edible oils to increase buying from other countries.
Wheat futures continue to drift lower after heavy rains moved through the Southern Plains over the holiday weekend.
Russia hit Ukraine with missile attacks over the weekend, leading President Trump to speak up on the possibility of further sanctions if peace talks aren’t negotiated.
According to the Rosario grains exchange, Argentina could be set to see their second-best wheat harvest for the 2025/26 season due to favorable weather and soil conditions for planting.
Grain Market Insider is provided by Stewart-Peterson Inc., a publishing company.
Futures and options trading involve significant risk of loss and may not be suitable for everyone. Therefore, carefully consider whether such trading is suitable for you in light of your financial condition. The data contained herein is believed to be drawn from reliable sources but cannot be guaranteed. This material has been prepared by a sales or trading employee or agent of Total Farm Marketing by Stewart-Peterson and is, or is in the nature of, a solicitation. Any decisions you may make to buy, sell or hold a futures or options position on such research are entirely your own and not in any way deemed to be endorsed by or attributed to Stewart-Peterson Inc. Reproduction of this information without prior written permission is prohibited. Hypothetical performance results have many inherent limitations. No representation is being made that any account will or is likely to achieve profits or losses similar to those shown. The data contained herein is believed to be drawn from reliable sources but cannot be guaranteed. Reproduction and distribution of this information without prior written permission is prohibited. This material has been prepared by a sales or trading employee or agent of Total Farm Marketing and is, or is in the nature of, a solicitation. Any decisions you may make to buy, sell or hold a position on such research are entirely your own and not in any way deemed to be endorsed by or attributed to Total Farm Marketing.
Stewart-Peterson Inc., Stewart-Peterson Group Inc., and SP Risk Services LLC are each part of the family of companies within Total Farm Marketing (TFM). Stewart-Peterson Inc. is a publishing company. Stewart-Peterson Group Inc. is registered with the Commodity Futures Trading Commission (CFTC) as an introducing broker and is a member of National Futures Association. SP Risk Services LLC is an insurance agency. A customer may have relationships with any or all three companies.
Corn is trading lower following the long three day weekend and is back below the 200-day moving average. The Crop Progress report will be released this afternoon and traders will get a look at crop condition ratings which are expected to be good.
After substantial rains last week, the forecast for this week is very light for most of the Corn Belt which should give producers a good opportunity to get planting wrapped up.
Friday’s CFTC report saw funds as sellers of corn once again. As of May 20, funds sold 18,234 contracts of corn which left them with a net short position of 103,210 contracts.
Soybeans are trading higher this morning bucking the trend from the rest of the grains which are lower. Higher palm oil and soybean oil futures are supporting prices, and July futures remain above their moving averages.
Friday’s CFTC report saw funds as sellers of soybeans by 25,753 contracts which left them with a net long position of 12,654 contracts. They sold 10,123 contracts of bean oil and 4,721 contracts of meal.
In Brazil, soybean prices have begun to increase as a result of news about the US/China trade war along with weather concerns like the flooding in Argentina.
Wheat is mixed to start the day with Chicago and KC trading slightly lower while Minneapolis is higher. Despite this morning’s quiet trade, this has been a strong week for wheat with the July contract up 18 cents and well off the contract low.
Yesterday’s export sales report was friendly for wheat with 869k tons sold, up from 805k last week. Top destinations were to the Philippines, unknown destinations, and Japan.
There have been very heavy rains recently in Argentina, specifically North of Buenos Aires where 6 to 10 inches of rain caused severe flooding. This precipitation has caused delays in wheat planting with only 3.4% of the crop planted.
Grain Market Insider is provided by Stewart-Peterson Inc., a publishing company.
Futures and options trading involve significant risk of loss and may not be suitable for everyone. Therefore, carefully consider whether such trading is suitable for you in light of your financial condition. The data contained herein is believed to be drawn from reliable sources but cannot be guaranteed. This material has been prepared by a sales or trading employee or agent of Total Farm Marketing by Stewart-Peterson and is, or is in the nature of, a solicitation. Any decisions you may make to buy, sell or hold a futures or options position on such research are entirely your own and not in any way deemed to be endorsed by or attributed to Stewart-Peterson Inc. Reproduction of this information without prior written permission is prohibited. Hypothetical performance results have many inherent limitations. No representation is being made that any account will or is likely to achieve profits or losses similar to those shown. The data contained herein is believed to be drawn from reliable sources but cannot be guaranteed. Reproduction and distribution of this information without prior written permission is prohibited. This material has been prepared by a sales or trading employee or agent of Total Farm Marketing and is, or is in the nature of, a solicitation. Any decisions you may make to buy, sell or hold a position on such research are entirely your own and not in any way deemed to be endorsed by or attributed to Total Farm Marketing.
Stewart-Peterson Inc., Stewart-Peterson Group Inc., and SP Risk Services LLC are each part of the family of companies within Total Farm Marketing (TFM). Stewart-Peterson Inc. is a publishing company. Stewart-Peterson Group Inc. is registered with the Commodity Futures Trading Commission (CFTC) as an introducing broker and is a member of National Futures Association. SP Risk Services LLC is an insurance agency. A customer may have relationships with any or all three companies.
The CME and Total Farm Marketing Offices will be closed Monday, May 26, in Observance of Memorial Day
All Prices as of 2:00 pm Central Time
Grain Market Highlights
🌽 Corn: Corn futures ended the week on a softer note but still managed to post their first weekly gain in six weeks.
🌱 Soybeans: Soybean futures closed lower Friday, pressured alongside the broader grain complex after former President Trump’s renewed tariff threats against the EU rattled markets.
To see updated U.S. weather outlook maps scroll down to the other charts/weather section.
Note – For the best viewing experience, some Grain Market Insider content is best viewed with your phone held horizontally.
Corn
2024 Crop:
Plan A: No active targets.
Plan B: No active targets.
Details:
Sales Recs: Eight sales recommendations made to date, with an average price of 494.
Changes:
None.
With July corn continuing to hold support at 440, the strategy remains to hold out for potential upside volatility opportunities.
2025 Crop:
Plan A:
Exit all 510 December calls @ 43-5/8 cents.
Exit half of the December 420 puts @ 43-3/4 cents.
Exit one-quarter of the December 420 puts if December closes at 411 or lower.
Roll-down 510 & 550 December calls if December drops to 399.
Plan B: No active targets.
Details:
SalesRecs: Seven sales recommendations have been made to date, with an average price of 461.25.
Changes:
None.
No adjustments needed at the moment. Positioned well for growing season volatility, with a good base of sales in place and both upside and downside targets active to begin legging out of open options positions.
2026 Crop:
Plan A: Next cash sale at 474 vs December ‘26.
Plan B: No active targets.
Details:
Sales Recs: Three sales recommendations have been made to date, with an average price of 460.
Changes:
None.
The 474 target will be given another week or two. If it hasn’t been hit by then, another sales recommendation may be made based on the calendar and timing considerations.
To date, Grain Market Insider has issued the following corn recommendations:
Corn futures ended the week on a softer note, weighed down by renewed trade tensions with the European Union and end-of-week profit-taking. Despite Friday’s pullback, July corn still closed 16 cents higher on the week—its first weekly gain after five straight weeks of losses.
The corn market had to fight off early session selling pressure on Friday as President Trump made comments about the disappointing pace of trade negotiations with the European Union. The administration is planning a 50% tariff on the EU starting on June 1. The headline pressured the entire market complex to start the day.
June corn options expired Friday, contributing to intraday volatility. Markets often gravitate toward areas of heavy open interest during expiration, and this month’s concentration around the $4.55–$4.60 strikes added technical pressure.
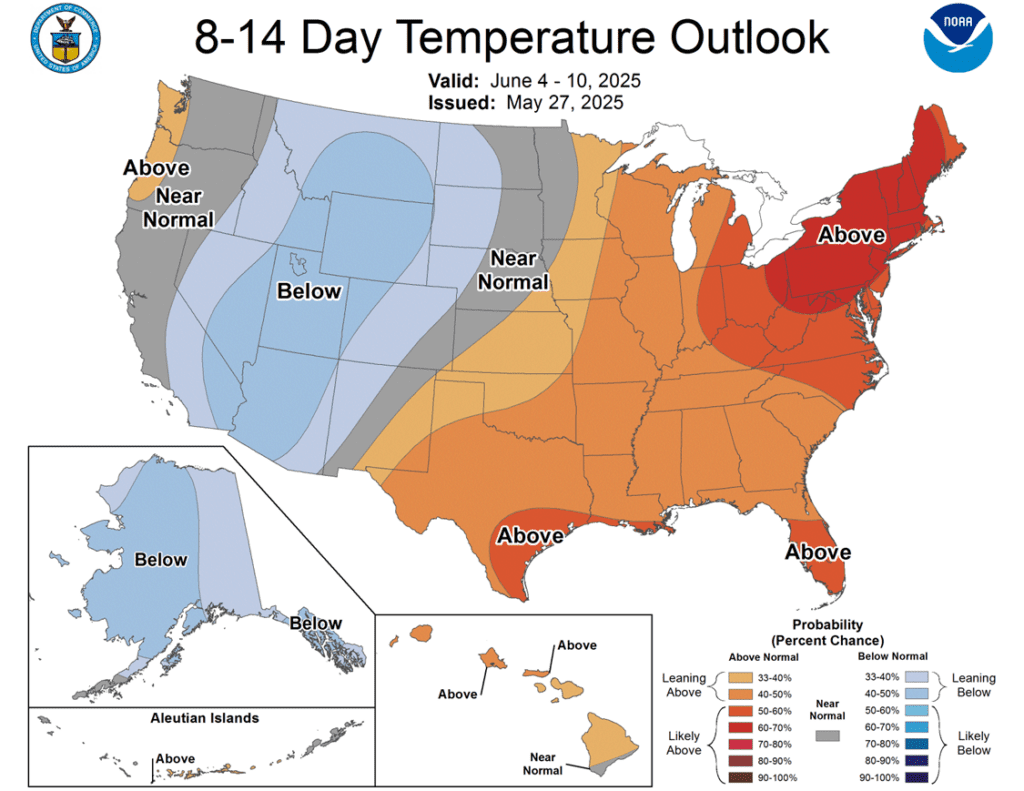
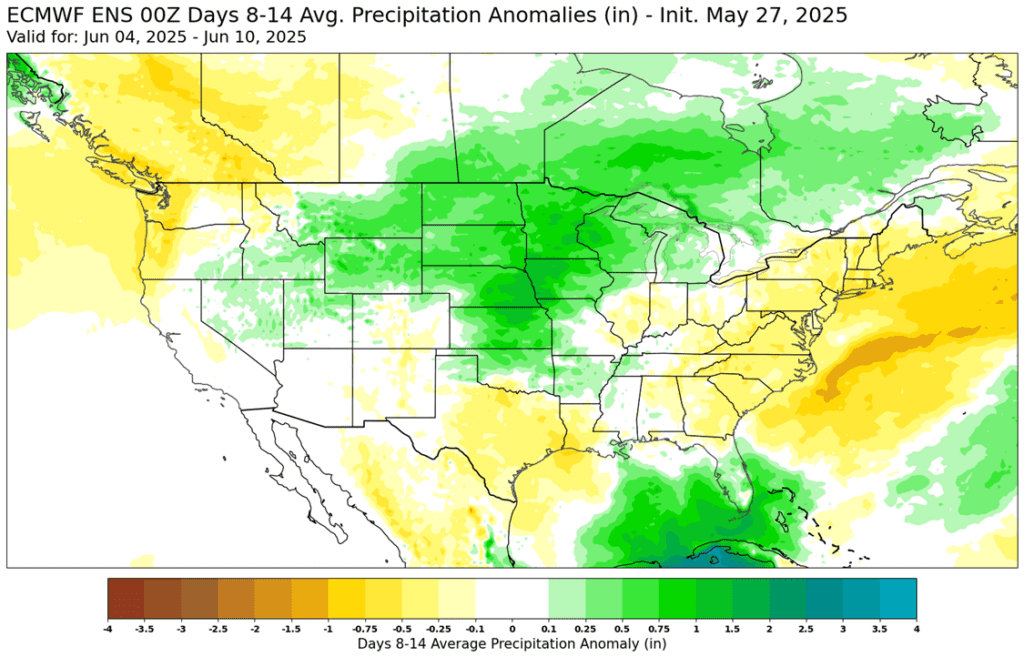
Looking ahead, early June weather is set to take center stage. The National Weather Service’s 8–14-day outlook shows a hot and dry pattern across much of the Corn Belt. If this trend continues, concerns over early-season dryness could support prices heading into the summer.
Corn Finds Support at 200-day After bouncing off the key $4.50 level in April on a bullish WASDE and a break above the 50-day moving average, corn futures have come under renewed pressure in May. Rapid planting progress and lingering demand concerns have pushed prices back below $4.70. For now, the $4.45–$4.50 support zone and 200-day moving average have held. As planting wraps up, the market’s focus will shift quickly to summer weather. NOAA’s extended outlook calls for a warmer, drier pattern across the Western Corn Belt into June — potentially rekindling risk premium and setting the stage for weather-driven rallies. Initial resistance is expected near $4.70, with stronger resistance at the April highs around $4.90.
Soybeans
2024 Crop:
Plan A: Next cash sale at 1107 vs July.
Plan B: No active targets.
Details:
Sales Recs: Three sales recommendations made to date, with an average price of 1089.
Changes:
None.
Still content with the 1107 target as long as 1036 support holds. If that support level is broken, the current strategy will need to be revisited and potentially adjusted.
2025 Crop:
Plan A:
Next cash sales at 1114 vs November.
Exit one-third of 1100 call options at 1085 vs November.
Exit remaining two-thirds of 1100 November call options at 88 cents.
Plan B:
Make a cash sale if November closes below 1018.50 support.
Details:
Sales Recs: One sales recommendation made so far to date, at 1063.50.
Changes:
In about a week, another tranche of January put options may be recommended based on the calendar and seasonal timing considerations.
2026 Crop:
Plan A: No active targets.
Plan B: No active targets.
Details:
Sales Recs: Zero sales recommendations made so far to date.
Changes:
None.
Approaching the seasonal window where first sales targets could post at any time.
To date, Grain Market Insider has issued the following soybean recommendations:
Soybean futures closed lower Friday, pressured alongside the broader grain complex after former President Trump’s renewed tariff threats against the EU rattled markets. Despite the pullback, soybeans still notched weekly gains. Soybean meal ended the day lower, while soybean oil finished higher amid continued volatility.
The Buenos Aires Grain Exchange released its weekly crop report which did not have an updated production number, it was kept at 50 mmt despite the recent flooding, but the bean crop is now said to be 74.3% harvested.
For the week, July soybeans gained 10-1/4 cents while November soybeans gained 15 cents. July soybean meal gained $4.30 on the week to end at $296.20, and July soybean oil gained 0.42 cents at 49.35 cents. Trade in soybean oil has been volatile due to rumors floating back and forth about potential biodiesel blending obligations.
Managed Money remains net short in soybeans, with hedge funds holding a 38,000-contract short as of last week’s CFTC report. While this week’s strength likely trimmed that position, a shift to net long will likely require a larger bullish catalyst. Global supply burdens and persistent demand concerns continue to cap upside potential into the summer.
Soybean Futures Hover Near Top of Yearly Range Amid Renewed Optimism After tumbling below the psychologically important 1000 mark in early April on tariff-related headlines, soybean futures appeared to be in freefall. The break of the March floor sparked a wave of technical selling, briefly sending prices spiraling. But the decline proved fleeting. Buyers quickly stepped in, reversing the momentum and powering futures back above 1000, reclaiming key moving averages along the way.
Of particular note was the clean break above the 200-day moving average — a barrier that had long capped upside attempts. With that ceiling now acting as solid support, bullish sentiment has taken the driver’s seat. Futures are now consolidating near the upper end of their 2024 range, setting their sights on a potential retest of the February peak around $10.80. As long as pullbacks hold the 200-day line, the path of least resistance may remain higher.
Wheat
Market Notes: Wheat
Wheat futures had another mixed close, posting small losses in Chicago and Kansas City, but modest gains in Minneapolis. Relative to corn and soybeans, the wheat close appears strong. With little other fresh news to drive the market, talk that President Trump may enact 50% tariffs on the EU beginning June 1 weighed on both equity and grain markets today.
According to the Buenos Aires Grain Exchange, wheat planting in Argentina is only 3.4% complete. This compares with 13% at this time last year, and a five-year average pace of 7%. Recent heavy rains and flooding have been the cause of slow soybean and corn harvests, in addition to the slow wheat sowing pace.
The Rosario Grain Exchange is estimating Argentina’s wheat crop could exceed 21 mmt. If realized, this would be the second largest crop on record. For reference, the USDA is estimating the Argentine crop at 20 mmt, while the Buenos Aires Grain Exchange is projecting a 20.5 mmt crop.
In the U.S., drought conditions continue to ease. Just 21% of winter wheat acres are experiencing drought, down 2% from last week, while spring wheat drought coverage dropped sharply from 38% to 29%.
On a bearish note, the International Grains Council has increased their estimate of global 25/26 grain stockpiles by 5 mmt from last month, to 585 mmt. This is in part due to an increased wheat stockpile estimate, going from 260 mmt in April to 262 mmt this month.
Since their export season began on July 1, Ukrainian grain exports have now reached 37.6 mmt according to their agriculture ministry. For the same time period, this is a reduction of about 17% year over year. Of the total, wheat exports account for 14.6 mmt, which is down 14% year over year.
2024 Crop:
Plan A:
Target 699.25 vs July for the next sale.
Plan B: No active targets.
Details:
Sales Recs: Four sales recommendations made to date, with an average price of 690.
Changes:
None.
While 699.25 is still a long way off, it’s tough to justify adjusting it lower at this point — historically, when volatility shows up this time of year, it can be significant.
2025 Crop:
Plan A:
Target 693.75 against July for the next sale.
Plan B:
Buy call options if July closes over 633.50 macro resistance.
Details:
Sales Recs: Five sales recommendations made to date, with an average price of 646.
Changes:
Plan B Update: A Plan B Update: A Plan B upside call buy stop has been added, with 633.50 identified as a key resistance level for the broader trend. A close above this level could indicate a shift toward a more bullish macro trend. In that scenario, buying call options would enable sales into strength while maintaining paper ownership.
The purpose of this stop is to try to avoid recommending call option purchases unless the market clearly signals it’s warranted — and a close above 633.50 would be that signal. As long as the market remains below this level, the expectation is for a continued sideways-to-lower macro trend, where call options would provide little or no benefit.
2026 Crop:
Plan A:
Target 675 vs July ‘26 for the next sale.
Plan B: No active targets.
Details:
Sales Recs: One sales recommendation made to date, at 624.
Changes:
None.
To date, Grain Market Insider has issued the following Chicago Wheat recommendations:
Chicago Wheat Looking for Support After months of range-bound trading, Chicago wheat futures broke out in February, climbing to October highs just above 615. However, the rally proved short-lived, with prices quickly retreating back into their 2024 range. By mid-May, futures broke below key support near 530 and are now searching for a bottom around the 520 level. The next major technical hurdle is the 200-day moving average — a firm weekly close above this level could signal a potential trend reversal and open the door to a broader uptrend.
2024 Crop:
Plan A: No active targets.
Plan B: No active targets.
Details:
Sales Recs: Three sales recommendations made to date, with an average price of 677.
Changes:
None. Still waiting for a bottom to form.
2025 Crop:
Plan A: No active targets.
Plan B:
Buy call options if July closes over 653 macro resistance.
Details:
Sales Recs: Four sales recommendations made to date, with an average price of 639.
Changes:
Plan B Update: A Plan B upside call buy stop has been added, with 653 identified as a key resistance level for the broader trend. A close above this level could indicate a shift toward a more bullish macro trend. In that scenario, buying call options would enable sales into strength while maintaining paper ownership.
The purpose of this stop is to try to avoid recommending call option purchases unless the market clearly signals it’s warranted — and a close above 653 would be that signal. As long as the market remains below this level, the expectation is for a continued sideways-to-lower macro trend, where call options would provide little or no benefit.
2026 Crop:
Plan A: No active targets.
Plan B: No active targets.
Details:
Sales Recs: Zero sales recommendations made so far to date.
Changes:
None.
First sales targets are expected to post after June 1.
To date, Grain Market Insider has issued the following KC recommendations:
Kansas City Wheat Searching for Support Kansas City wheat experienced sharp volatility in February, rallying early before settling flat by month’s end. Persistent weakness through March and April pushed prices toward recent lows — and the market broke below that support to start May. A recovery back above the prior 540 level would signal a potential bottom. On a rebound, the 200-day moving average stands as the first resistance, with a more formidable ceiling at the February highs near 640.
2024 Crop:
Plan A: No active targets.
Plan B: No active targets.
Details:
Sales Recs: Five sales recommendations made to date, with an average price of 696.
Changes:
None.
2025 Crop:
Plan A: No active targets.
Plan B:
Buy KC call options if July KC closes over 653 macro resistance.
Note: KC options are being used due to the strong correlation between KC and Minneapolis futures prices, as well as the greater liquidity found in the KC options market.
Details:
Sales Recs: Five sales recommendations made to date, with an average price of 646.
Changes:
Plan B Update: A Plan B upside call buy stop has been added, with KC 653 identified as a key resistance level for the broader trend. A close above this level could indicate a shift toward a more bullish macro trend. In that scenario, buying call options would enable sales into strength while maintaining paper ownership.
The purpose of this stop is to try to avoid recommending call option purchases unless the market clearly signals it’s warranted — and a close above KC 653 would be that signal. As long as the market remains below this level, the expectation is for a continued sideways-to-lower macro trend, where call options would provide little or no benefit.
2026 Crop:
Plan A: No active targets.
Plan B: No active targets.
Details:
Changes:
None.
First sales targets are expected to post after July 1.
To date, Grain Market Insider has issued the following Minneapolis wheat recommendations:
Spring Wheat Holds Recent Lows Spring wheat futures broke out of a prolonged sideways trend in late January, sparking a wave of bullish momentum. The rally gained strength in mid-February with a decisive close above the 200-day moving average. However, late-month weakness briefly dragged futures back below key support levels. Currently, futures are retreating toward recent lows, pressured by strong planting progress and favorable weather conditions across major spring wheat-growing regions. On a potential rebound, initial resistance is expected near the 600 level, where a confluence of moving averages could cap gains.
The CME and Total Farm Marketing Offices will be closed Monday, May 26, in Observance of Memorial Day
All prices as of 10:30 am Central Time
Corn
JUL ’25
457.25
-5.75
DEC ’25
448.75
-4.5
DEC ’26
465.25
-2.5
Soybeans
JUL ’25
1057.25
-10.25
NOV ’25
1047.5
-7.75
NOV ’26
1049
-5.5
Chicago Wheat
JUL ’25
539.5
-5
SEP ’25
555.25
-5.25
JUL ’26
615.25
-6
K.C. Wheat
JUL ’25
534
-6
SEP ’25
549.25
-5.75
JUL ’26
611.5
-2.25
Mpls Wheat
JUL ’25
601.75
1.5
SEP ’25
615.75
1.75
SEP ’26
676.5
3
S&P 500
JUN ’25
5803
-53.75
Crude Oil
JUL ’25
61.6
0.4
Gold
AUG ’25
3381.7
58.1
Corn futures are weaker at midday on pressure from the rest of the grain market ahead of the Memorial Day weekend.
The Buenos Aires Grain Exchange reported that Argentina’s harvest now stands at 38.8% complete, up 1.6% from last week.
The International Grains Council has raised their global corn stockpile estimate from 281 mmt last month to 284 mmt this month.
Soybean futures are lower at midday on general weakness heading into the long holiday weekend.
Buenos Aires Grain Exchange reported that Argentina’s soybean harvest improved 10% from last week, now at 74.3% complete.
US soybean area under drought conditions declined 1% from the week prior to 16%. This compares to just 7% at this same time last year.
Wheat prices remain weaker at midday, pressured by profit taking going into the weekend after this week’s rally.
The Buenos Aires Grain Exchange reported that Argentina’s wheat planting has got off to a slow start due to heavy rainfalls. Planting is just at 3.4% complete, down from 13.4% at this same time last year.
According to Ukraine’s Agriculture Ministry website, the country’s wheat exports are down 14% from last year to 14.6 mmt.
Grain Market Insider is provided by Stewart-Peterson Inc., a publishing company.
Futures and options trading involve significant risk of loss and may not be suitable for everyone. Therefore, carefully consider whether such trading is suitable for you in light of your financial condition. The data contained herein is believed to be drawn from reliable sources but cannot be guaranteed. This material has been prepared by a sales or trading employee or agent of Total Farm Marketing by Stewart-Peterson and is, or is in the nature of, a solicitation. Any decisions you may make to buy, sell or hold a futures or options position on such research are entirely your own and not in any way deemed to be endorsed by or attributed to Stewart-Peterson Inc. Reproduction of this information without prior written permission is prohibited. Hypothetical performance results have many inherent limitations. No representation is being made that any account will or is likely to achieve profits or losses similar to those shown. The data contained herein is believed to be drawn from reliable sources but cannot be guaranteed. Reproduction and distribution of this information without prior written permission is prohibited. This material has been prepared by a sales or trading employee or agent of Total Farm Marketing and is, or is in the nature of, a solicitation. Any decisions you may make to buy, sell or hold a position on such research are entirely your own and not in any way deemed to be endorsed by or attributed to Total Farm Marketing.
Stewart-Peterson Inc., Stewart-Peterson Group Inc., and SP Risk Services LLC are each part of the family of companies within Total Farm Marketing (TFM). Stewart-Peterson Inc. is a publishing company. Stewart-Peterson Group Inc. is registered with the Commodity Futures Trading Commission (CFTC) as an introducing broker and is a member of National Futures Association. SP Risk Services LLC is an insurance agency. A customer may have relationships with any or all three companies.