Opening Update: May 18, 2023
All prices as of 6:30 am Central Time
|
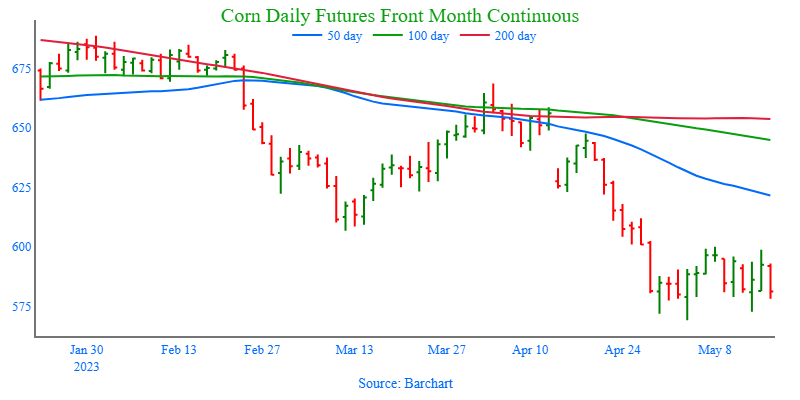
Corn |
||
| JUL ’23 | 555 | -6.5 |
| DEC ’23 | 495.75 | -3.25 |
| DEC ’24 | 488.25 | -3.75 |
|
Soybeans |
||
| JUL ’23 | 1333.5 | -3.5 |
| NOV ’23 | 1184.5 | -3 |
| NOV ’24 | 1160.25 | -4.75 |
|
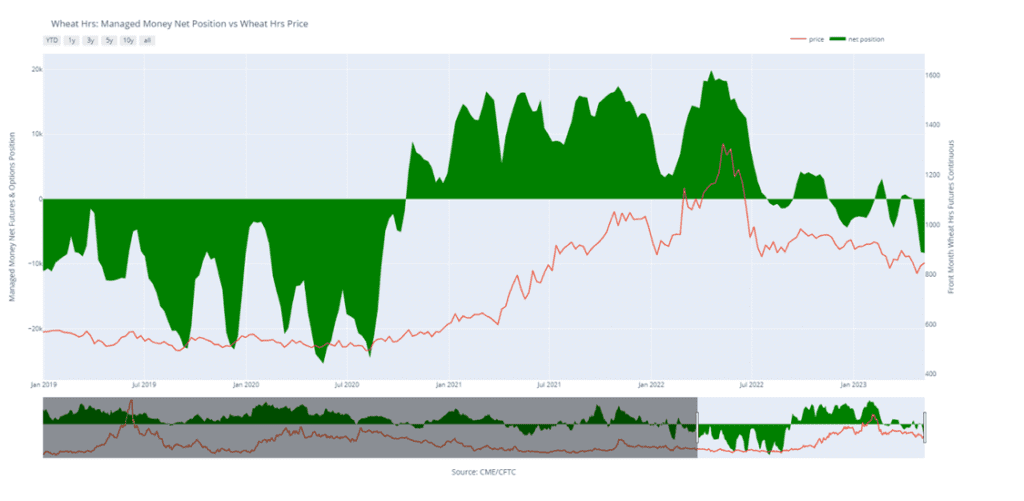
Chicago Wheat |
||
| JUL ’23 | 613 | -12.5 |
| SEP ’23 | 625.5 | -12.25 |
| JUL ’24 | 665 | -11.5 |
|
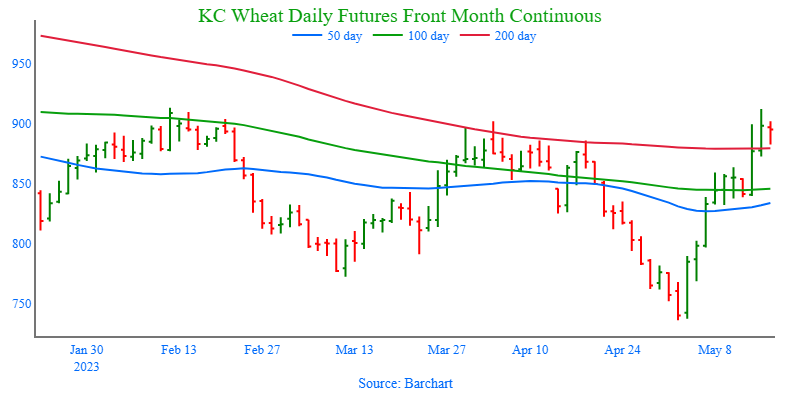
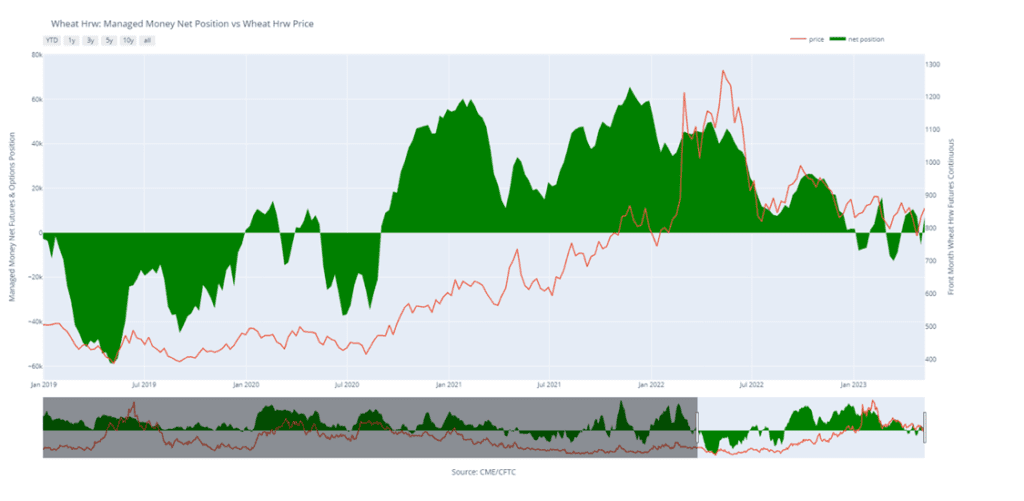
K.C. Wheat |
||
| JUL ’23 | 862.5 | -23 |
| SEP ’23 | 850.75 | -22.5 |
| JUL ’24 | 770.5 | -15.25 |
|
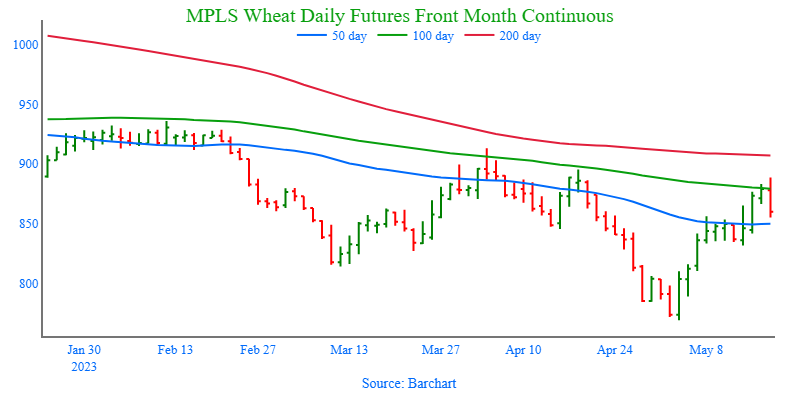
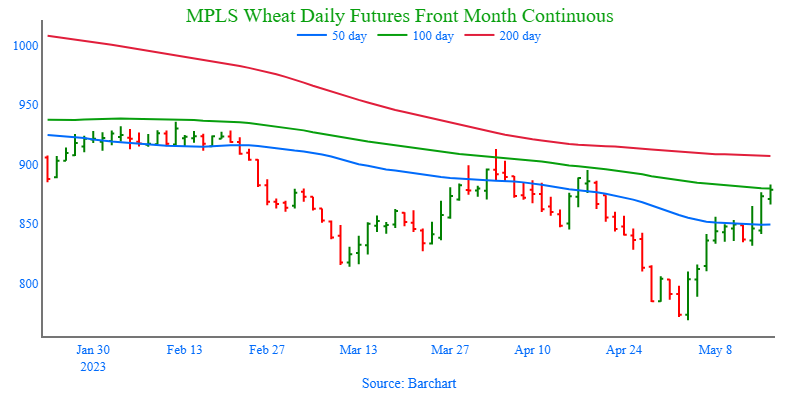
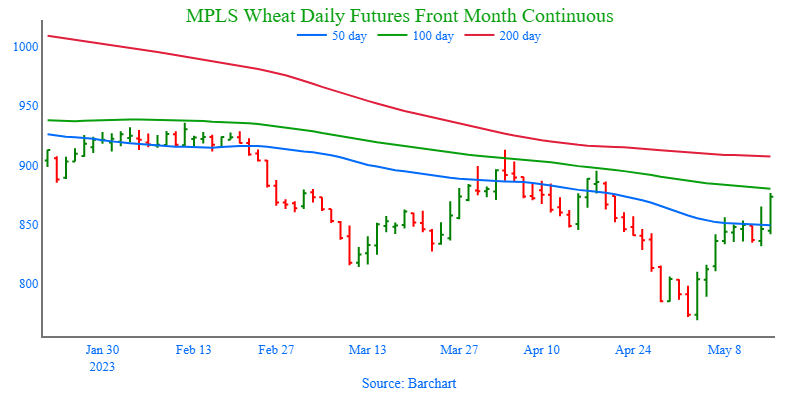
Mpls Wheat |
||
| JUL ’23 | 838.25 | -21.5 |
| SEP ’23 | 838 | -21.75 |
| SEP ’24 | 773 | -16.5 |
|
S&P 500 |
||
| JUN ’23 | 4182.25 | 10.75 |
|
Crude Oil |
||
| JUL ’23 | 72.89 | 0 |
|
Gold |
||
| AUG ’23 | 1997 | -6.7 |

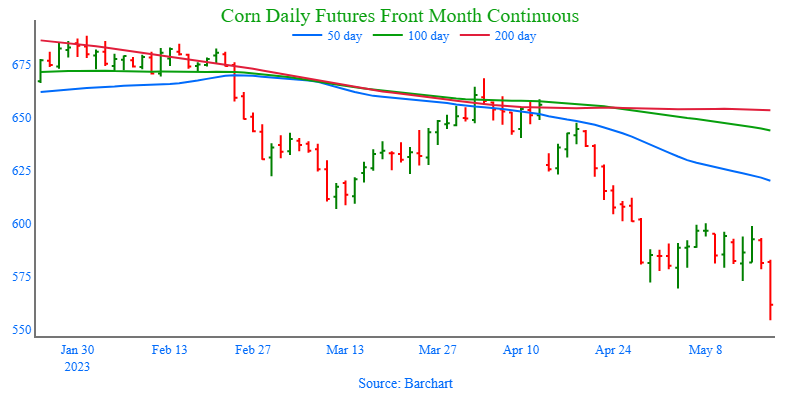
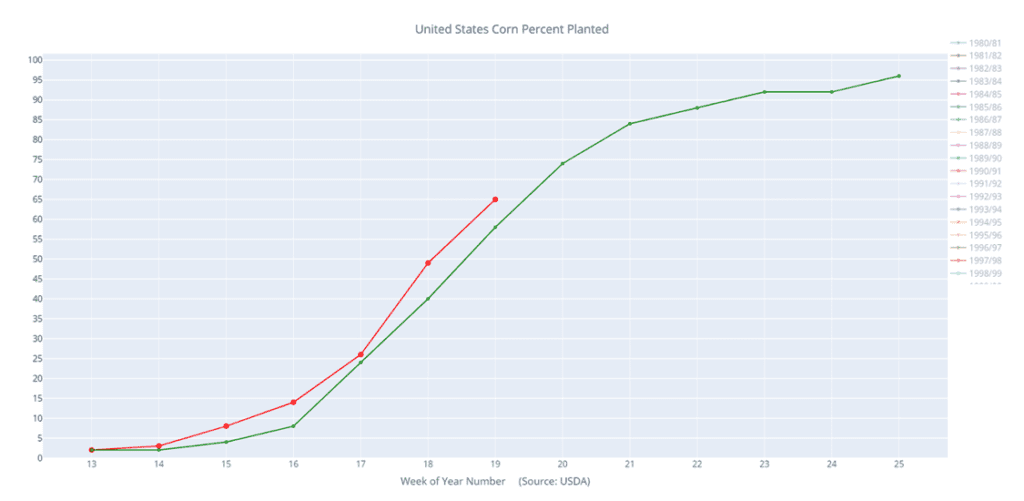
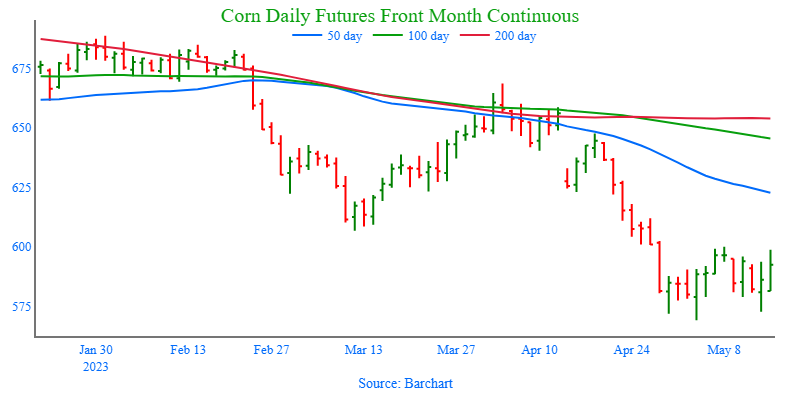
- Corn is trading lower for the third consecutive day with December below the 5-dollar mark.
- Yesterday’s news that Russia would agree to extend the Black Sea grain deal at the last moment triggered fund selling and added pressure to corn and wheat.
- Yesterday the USDA reported the fourth sales cancellation by China of 10.7 mb of corn, but China still has about 89 mb of outstanding sales in the US.
- Estimates for todays export sales report in corn are between -300k and 650k tons with an average guess of 185k.

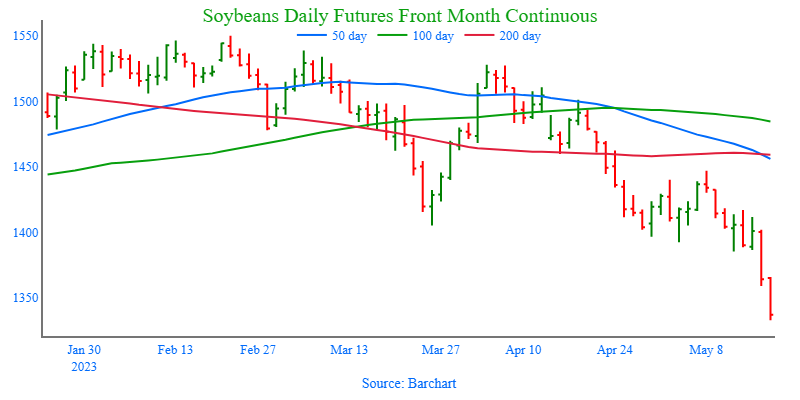
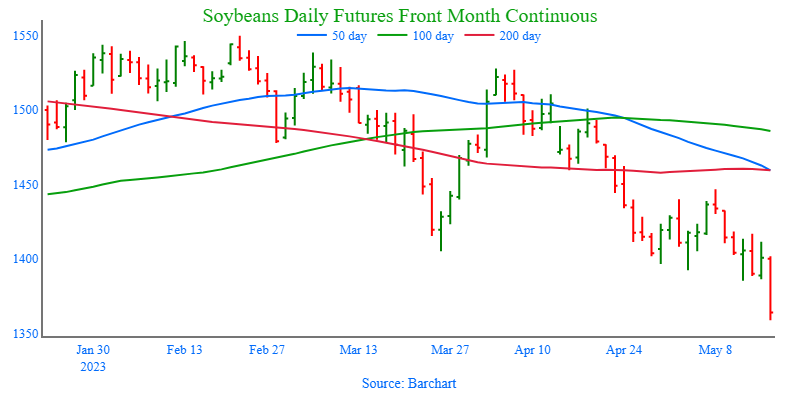
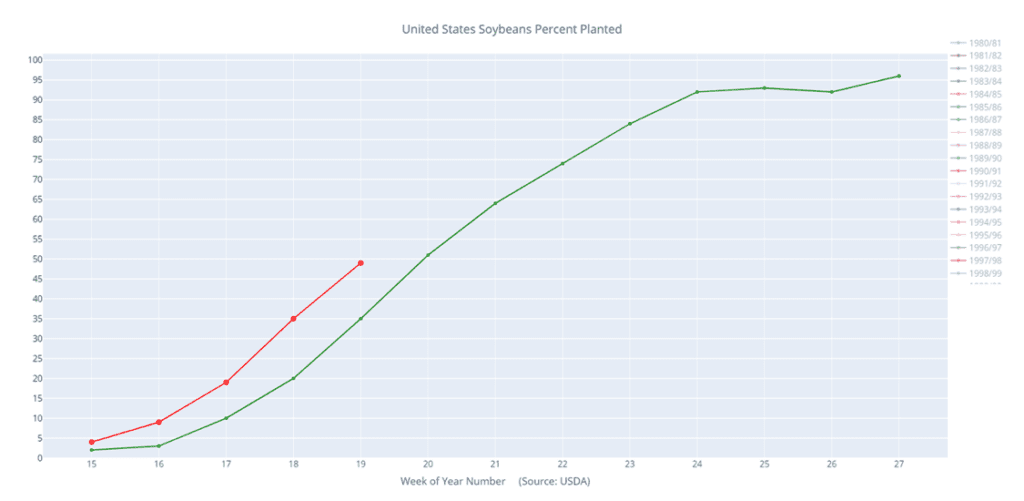
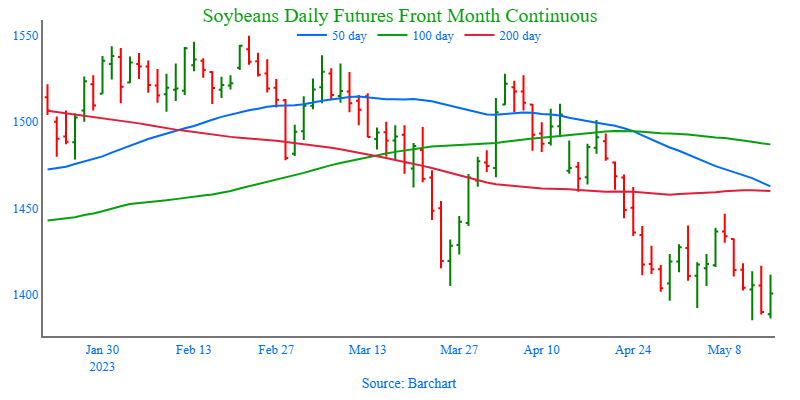
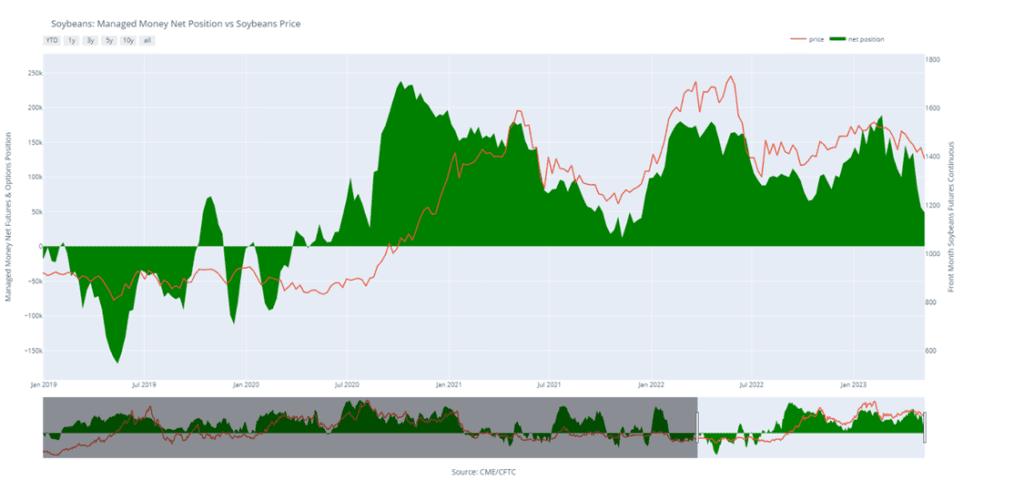
- Soybeans and soybean meal are lower this morning while soybean oil is slightly higher as palm oil futures begin to level off.
- China’s soybean imports reached a record high of 8.8 million tons this April as their economy recovers and demand increases.
- Brazil’s soybean harvest achieved its record high mark which the USDA estimates at 155 mmt which is the most soybeans ever grown by any country ever as their production continues to expand.
- Soybean export sales are expected to be in a range between 50k and 600k tons with an average guess of 298k.

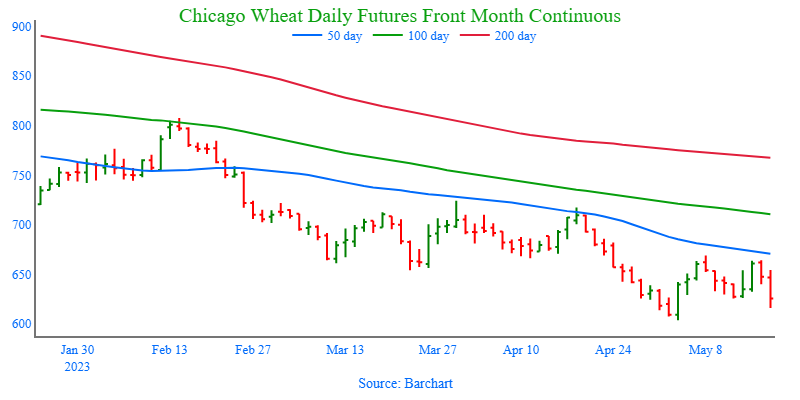
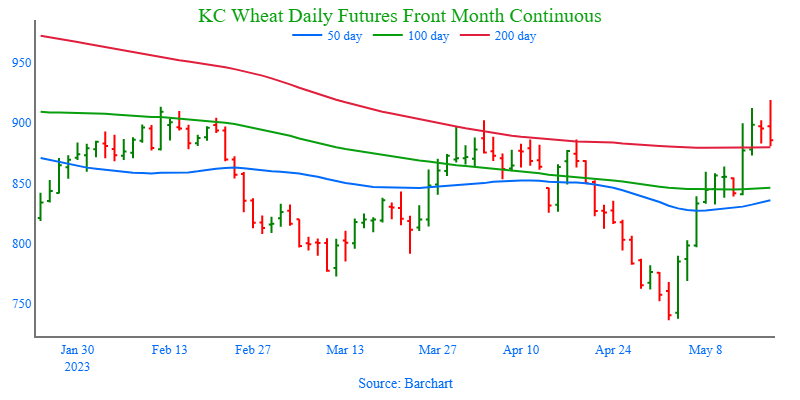
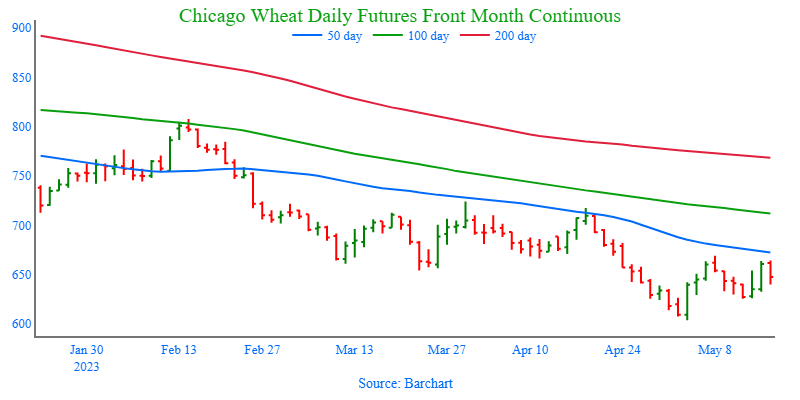
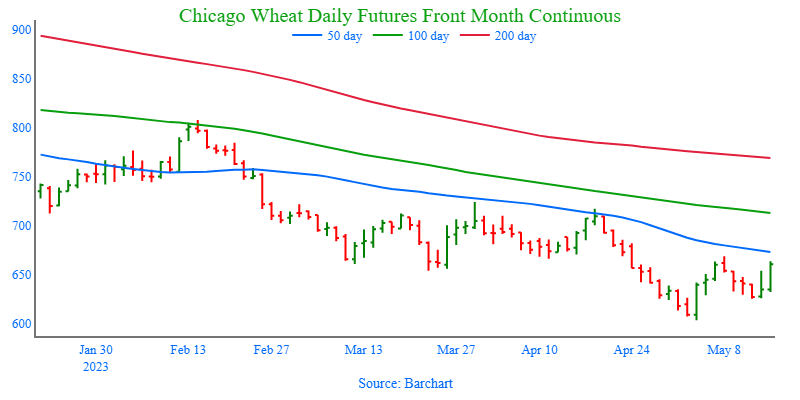
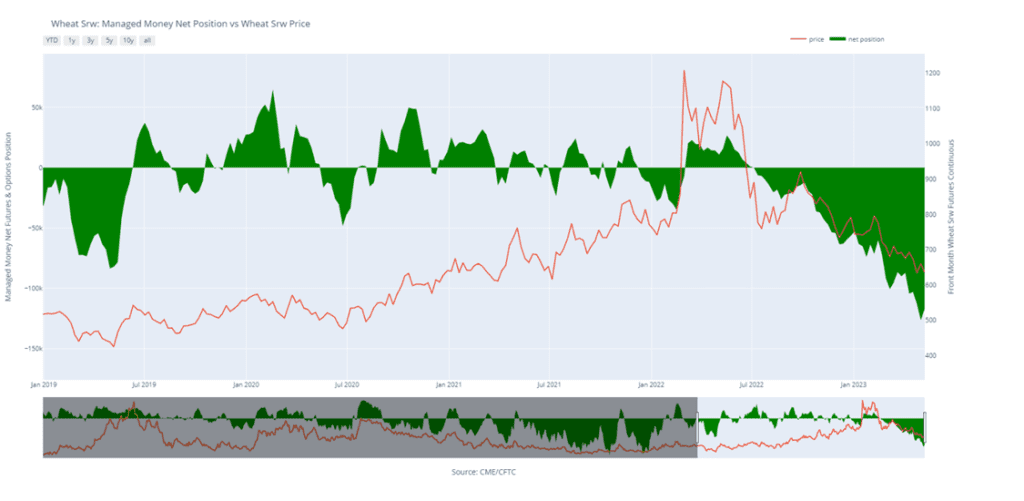
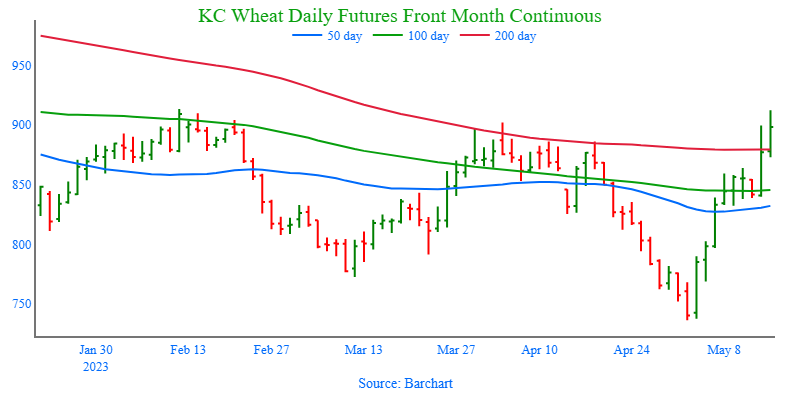
- Wheat is trading lower again this morning after yesterday’s surprise renewal of the Black Sea grain deal spurred heavy selling. This agreement will last for two months.
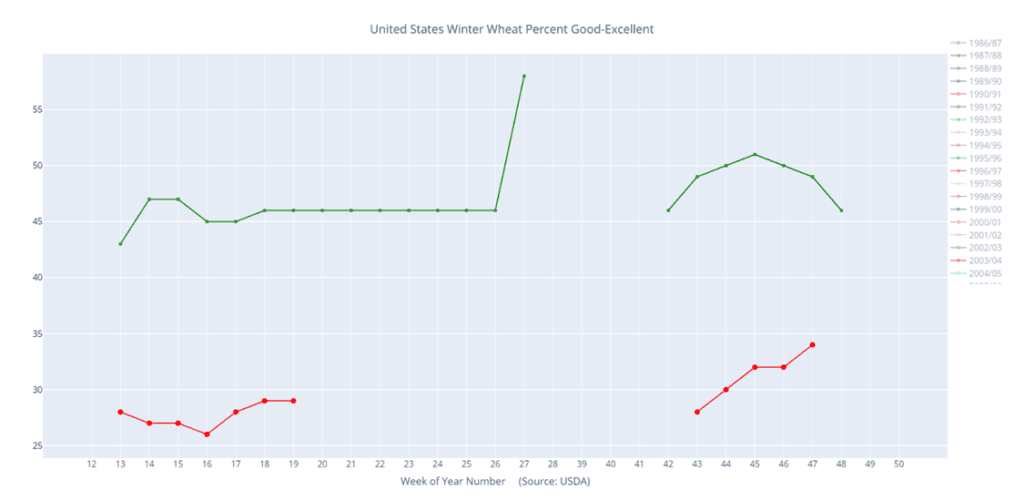
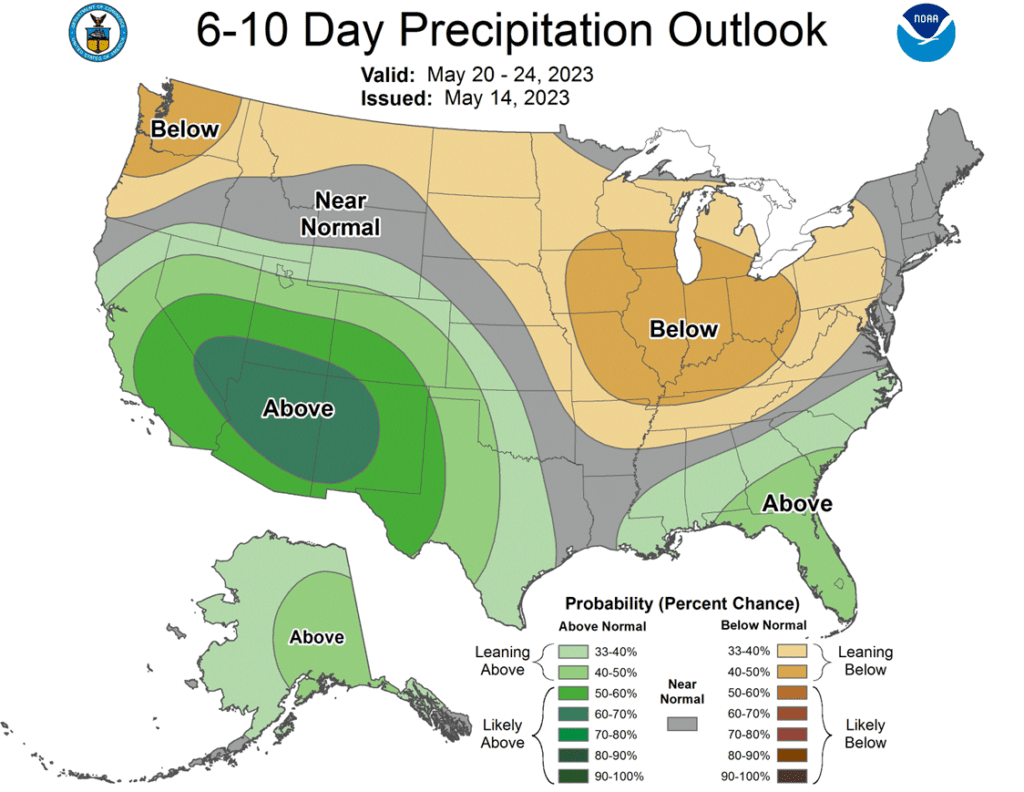
- Yesterday’s crop tour showed wheat yields in Kansas falling below the USDA’s estimates at an average of just 27.5 bpa vs 37 bpa a year ago.
- With the severe drought ravaging US wheat, the US has had to resort to rare wheat imports with two cargoes of Polish grain arriving in Florida this year.
- The HRW wheat crop tour will move to Manhattan, KS today where conditions are more favorable, and the tour will offer its final estimates.
Grain Market Insider is provided by Stewart-Peterson Inc., a publishing company.
Futures and options trading involve significant risk of loss and may not be suitable for everyone. Therefore, carefully consider whether such trading is suitable for you in light of your financial condition. The data contained herein is believed to be drawn from reliable sources but cannot be guaranteed. This material has been prepared by a sales or trading employee or agent of Total Farm Marketing by Stewart-Peterson and is, or is in the nature of, a solicitation. Any decisions you may make to buy, sell or hold a futures or options position on such research are entirely your own and not in any way deemed to be endorsed by or attributed to Stewart-Peterson Inc. Reproduction of this information without prior written permission is prohibited. Hypothetical performance results have many inherent limitations. No representation is being made that any account will or is likely to achieve profits or losses similar to those shown. The data contained herein is believed to be drawn from reliable sources but cannot be guaranteed. Reproduction and distribution of this information without prior written permission is prohibited. This material has been prepared by a sales or trading employee or agent of Total Farm Marketing and is, or is in the nature of, a solicitation. Any decisions you may make to buy, sell or hold a position on such research are entirely your own and not in any way deemed to be endorsed by or attributed to Total Farm Marketing.
Stewart-Peterson Inc., Stewart-Peterson Group Inc., and SP Risk Services LLC are each part of the family of companies within Total Farm Marketing (TFM). Stewart-Peterson Inc. is a publishing company. Stewart-Peterson Group Inc. is registered with the Commodity Futures Trading Commission (CFTC) as an introducing broker and is a member of National Futures Association. SP Risk Services LLC is an insurance agency. A customer may have relationships with any or all three companies.