|

Opening Update: July 5, 2023

Markets are closed until 8:30 am Central Time

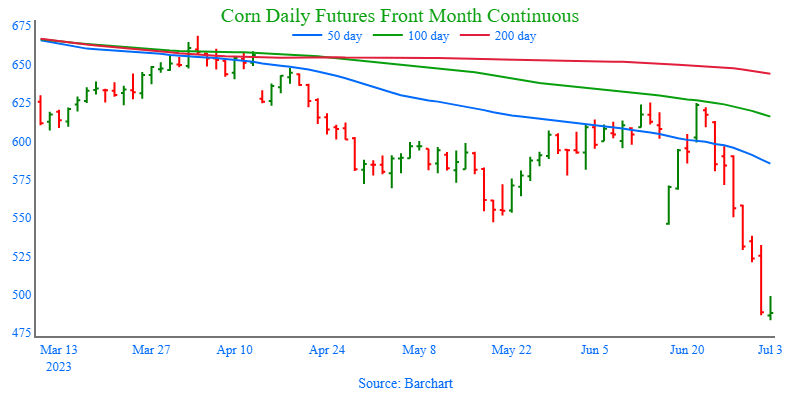
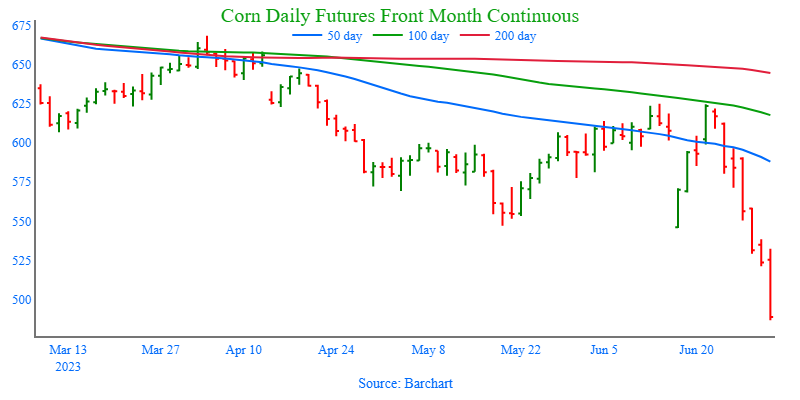
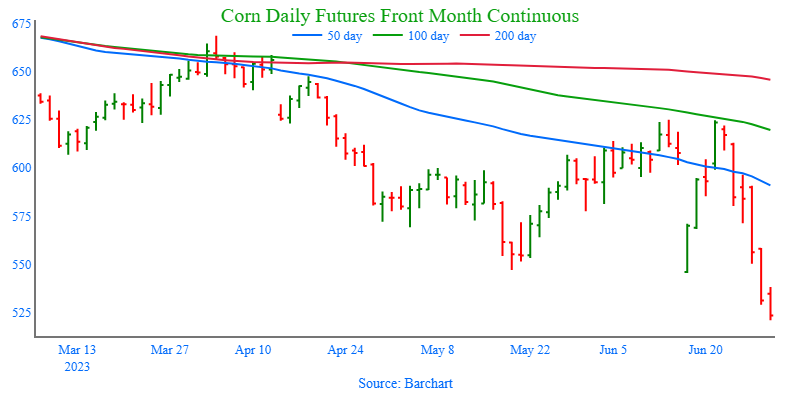
  • On Monday, corn traded higher throughout the day before ultimately settling lower on continued pressure from the bearish USDA report.
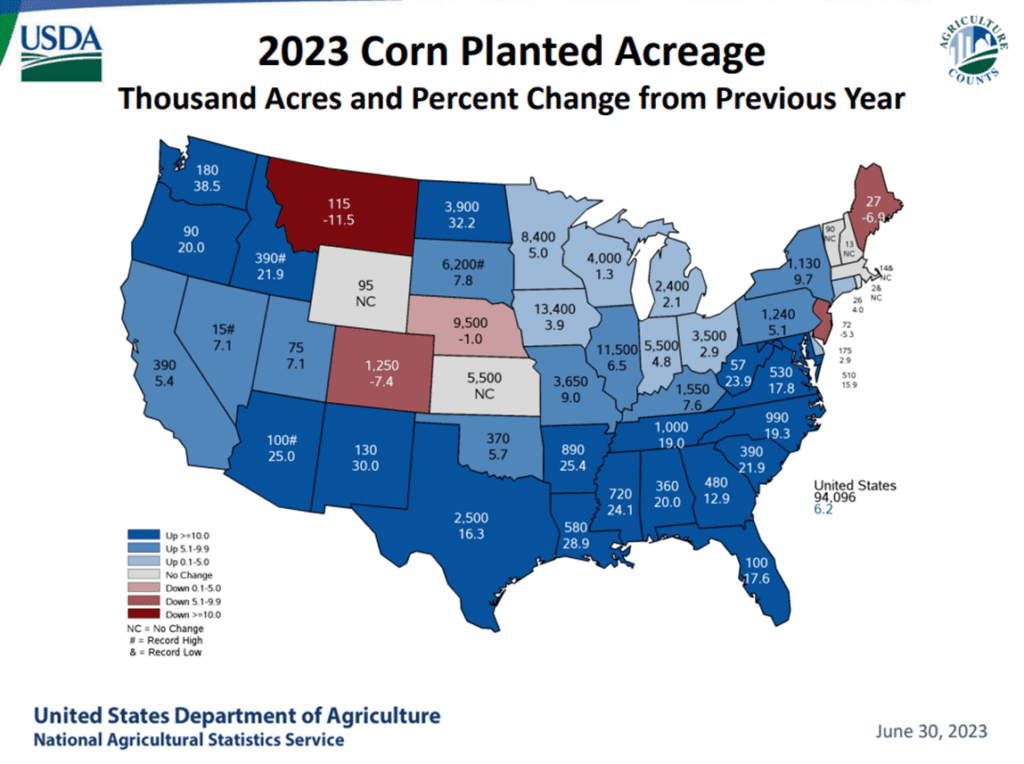
  • The USDA said that the planting estimate for corn was 94.1 million acres which would increase ending stocks and has caused selling in corn futures.
  • On Friday, crop progress was released showing the corn crop rated 51% good to excellent, up just one point from a week ago. Illinois, Iowa, and Indiana showed improvement from a week ago.
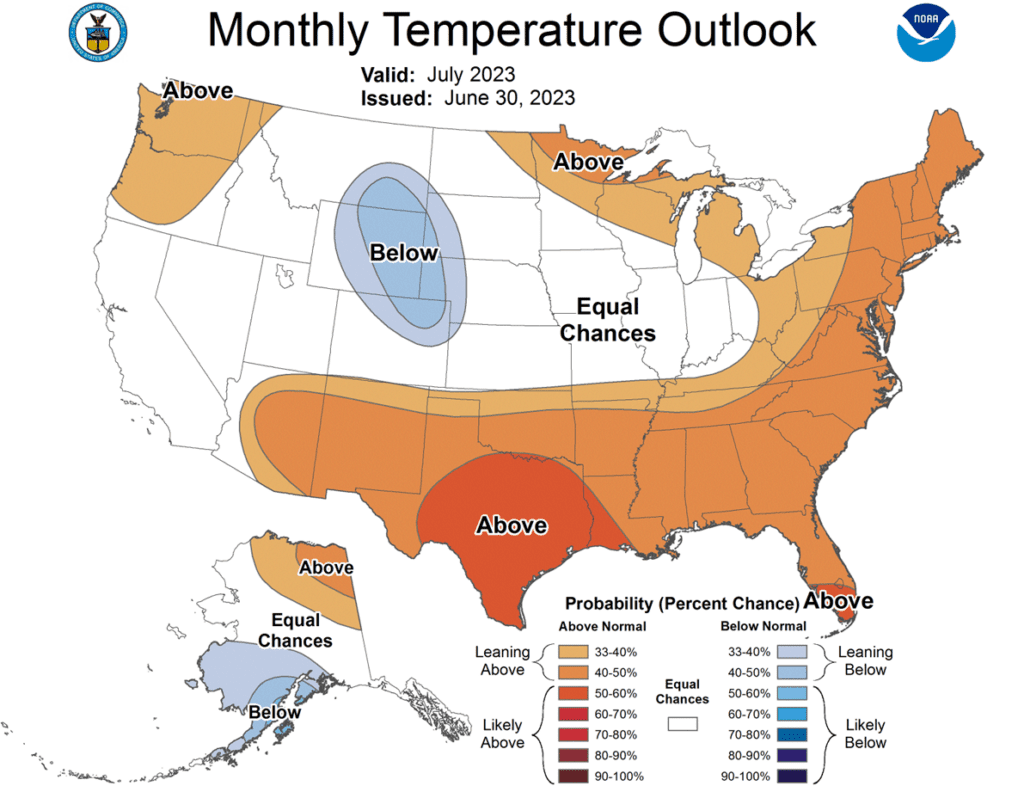
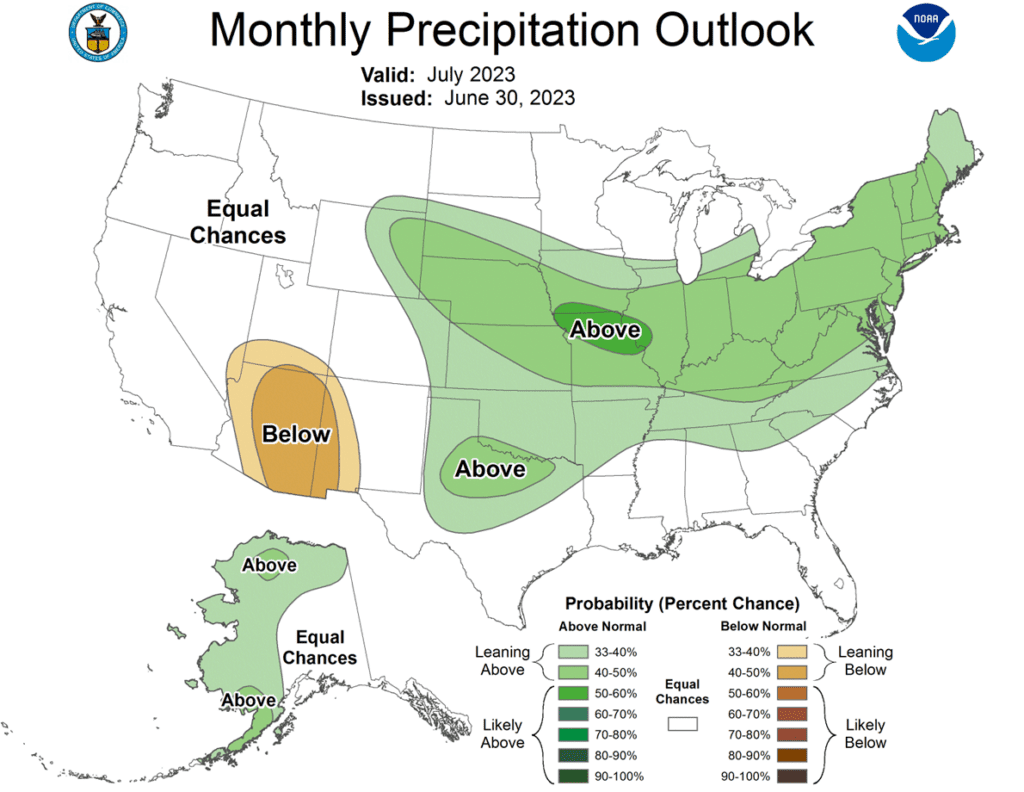
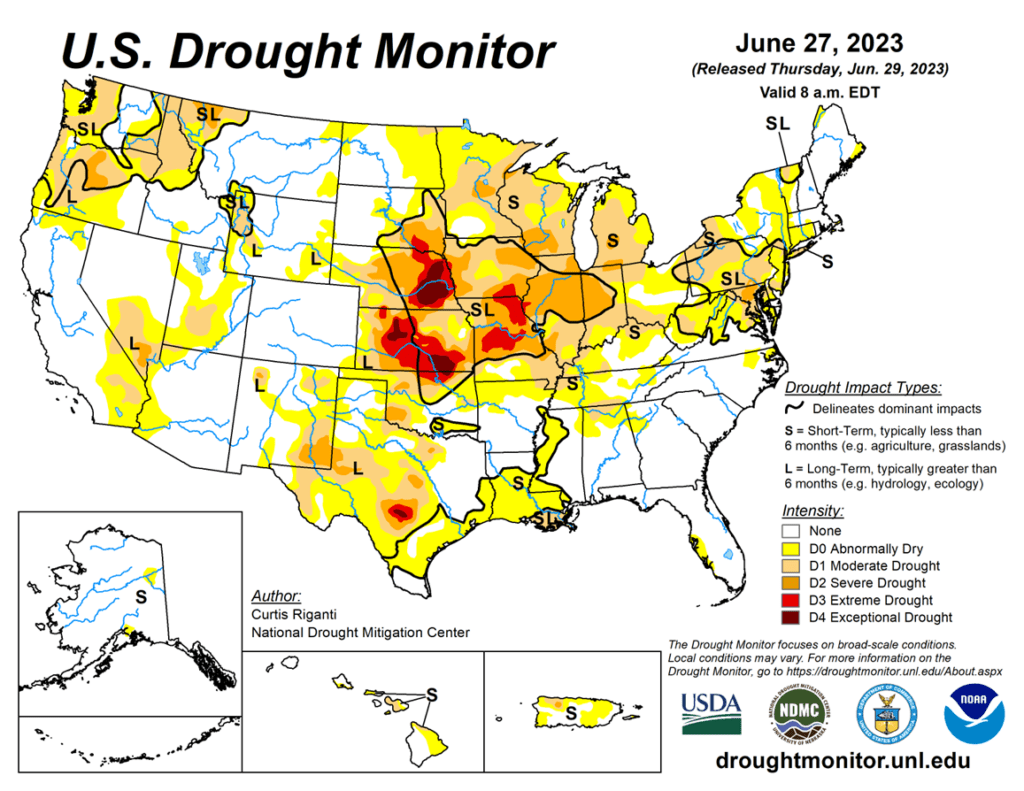
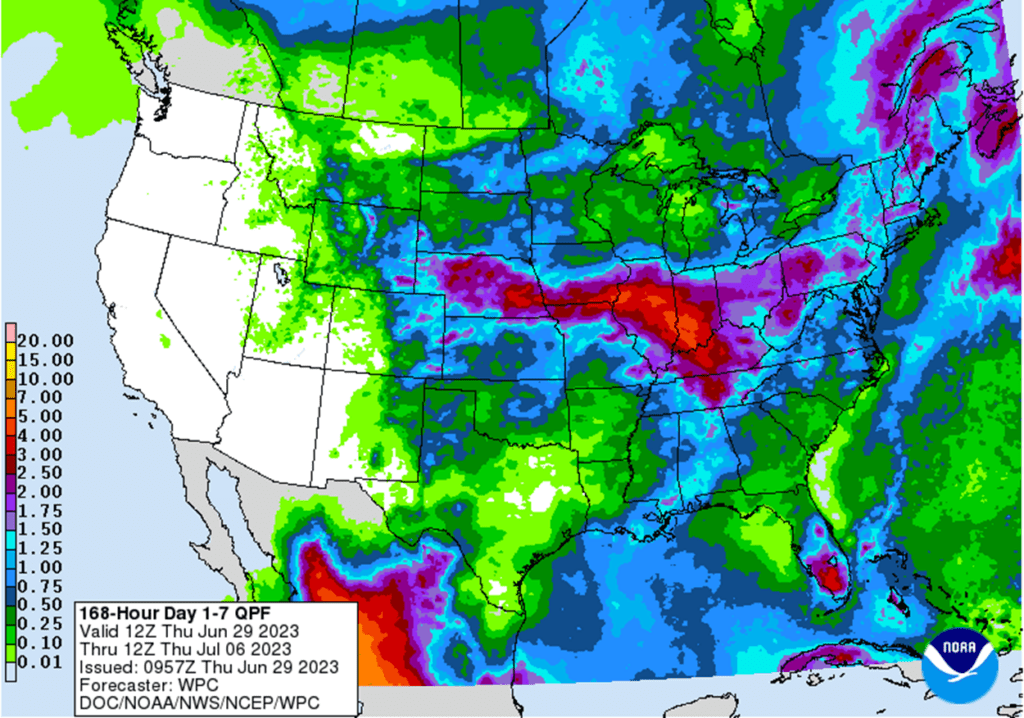
  • Rains fell in the western Plains yesterday, and Kansas and Missouri are expecting heavy rain amounts over the next five days, and good rain in the Corn Belt as a whole.

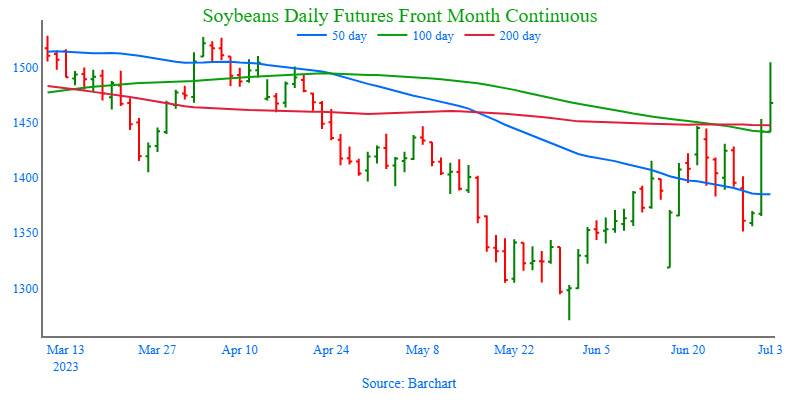
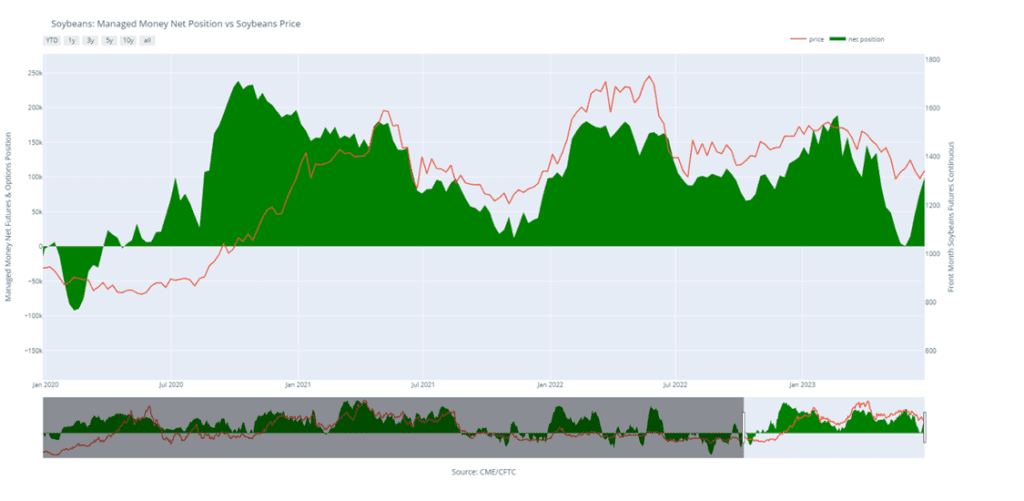
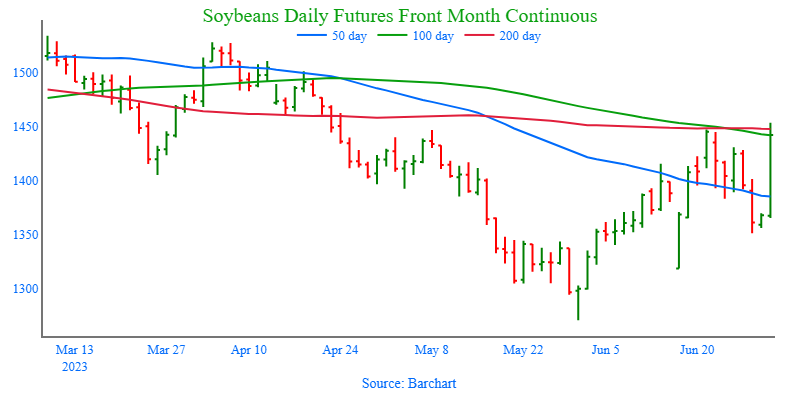
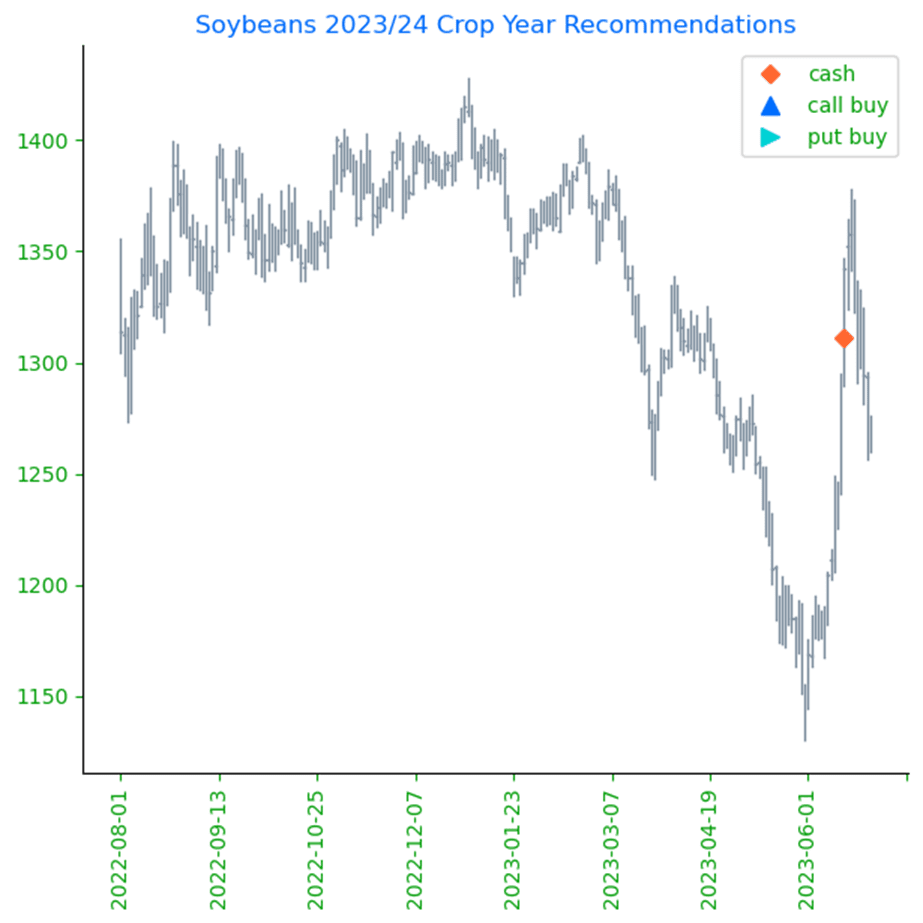
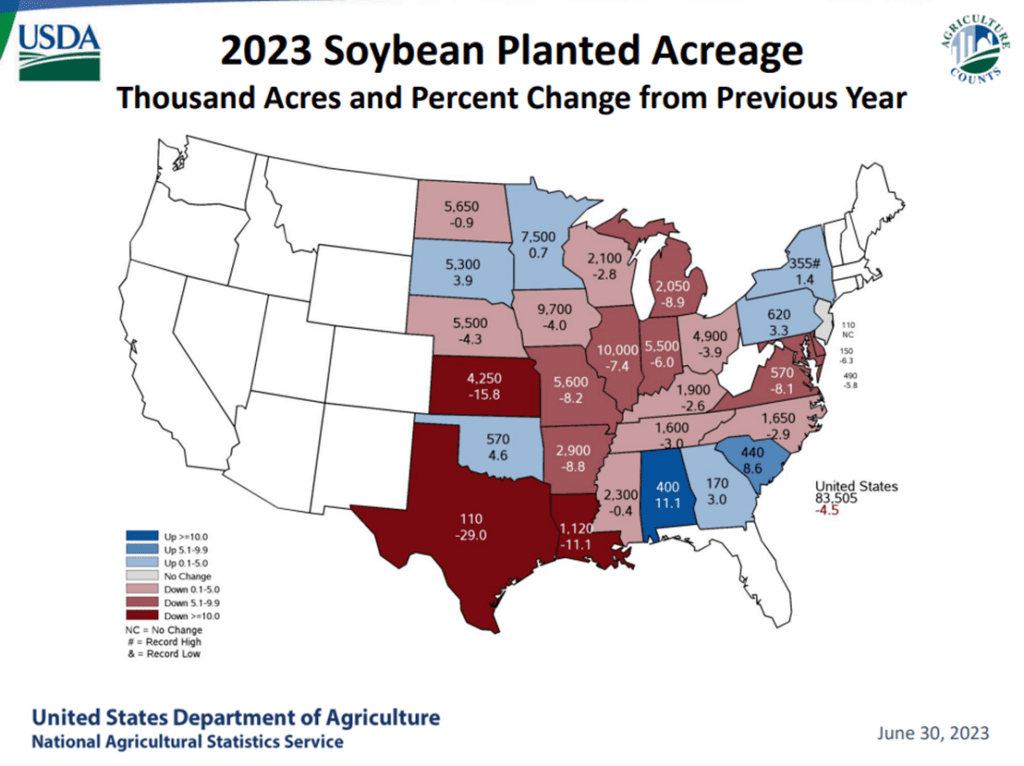
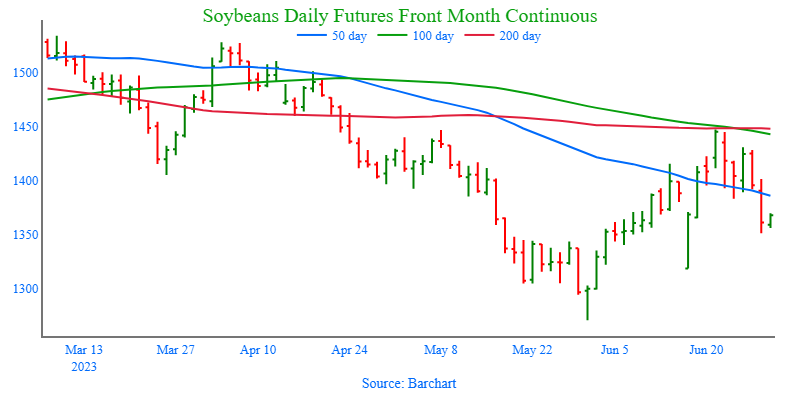
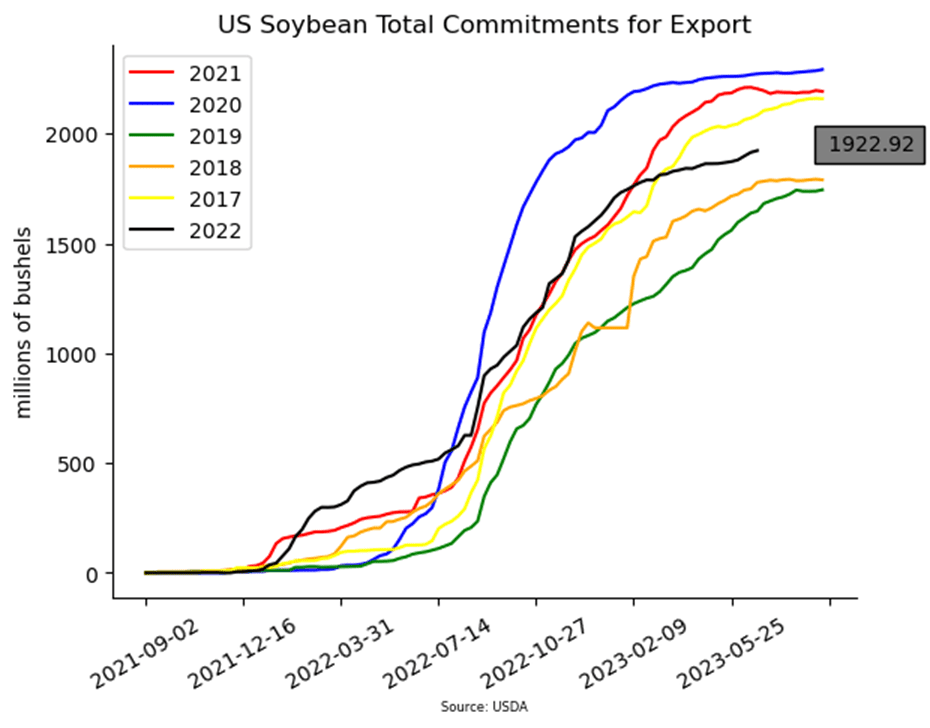
  • On the flip side of corn, soybeans ended higher on Friday with continued support from the USDA report with planting estimates at just 83.5 million acres.
  • August soybean oil closed at a new high for the year on Monday as demand picks up. Yesterday, both canola and rapeseed traded higher.
  • Despite the recent beneficial rains in the driest areas of the Corn Belt, crop progress showed soybeans falling by 1% in the good to excellent rating and is now at 50%, the lowest rating for this time of year since 2012.
  • With soybean futures in the US surging, China has taken notice, and September beans on the Dalian exchange closed 2.9% higher yesterday to a four month high.

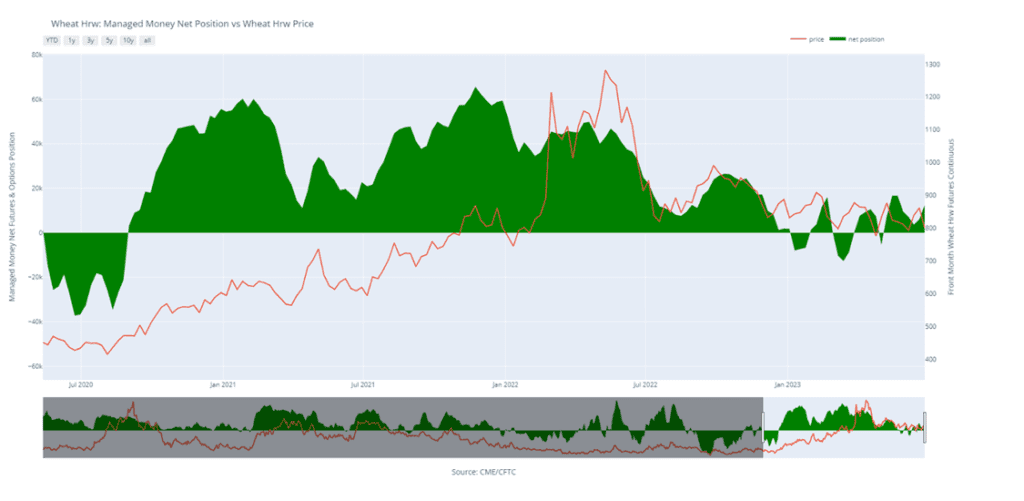
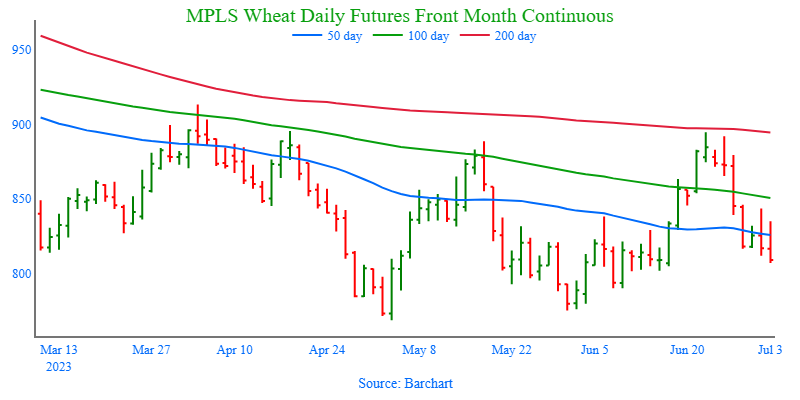
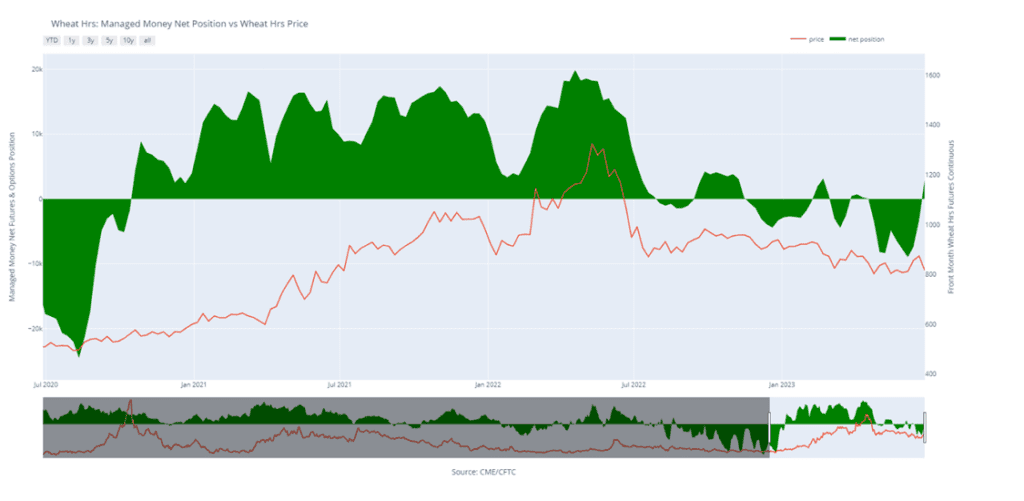
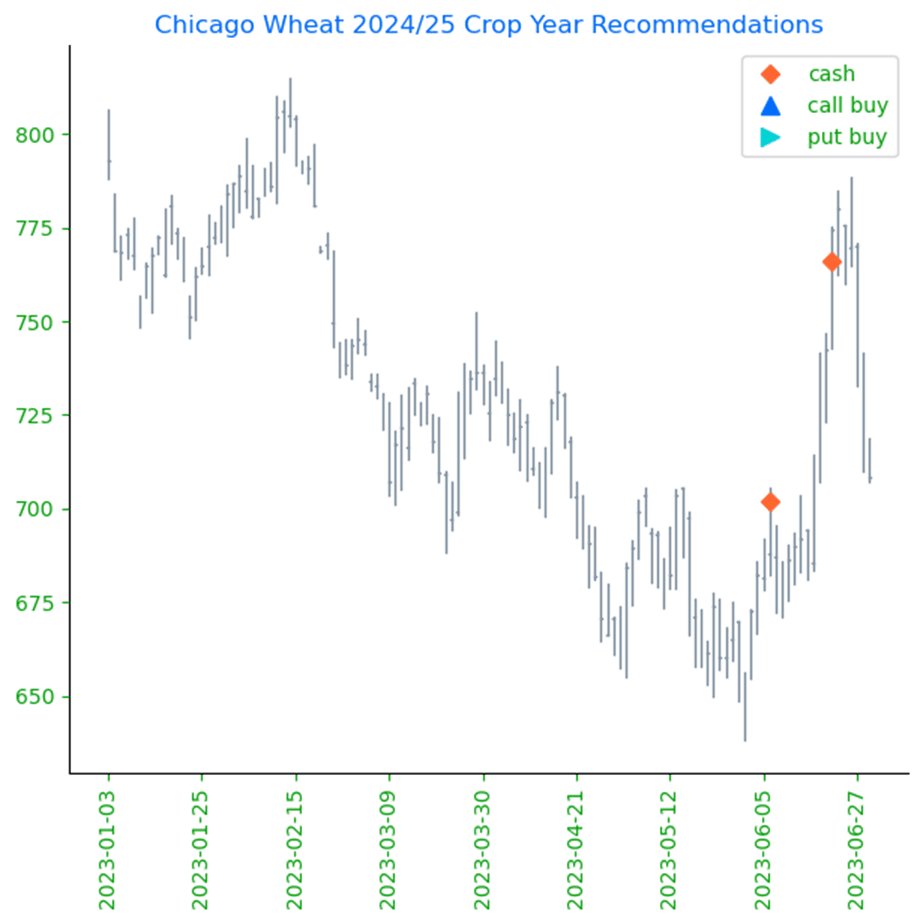
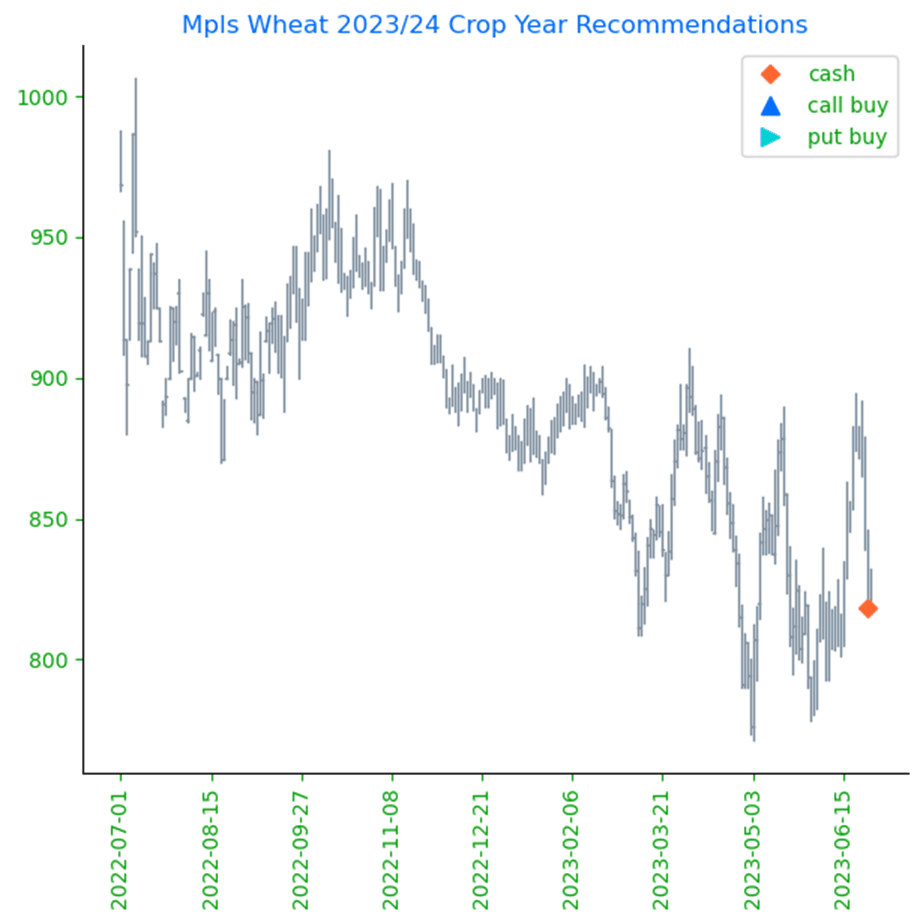
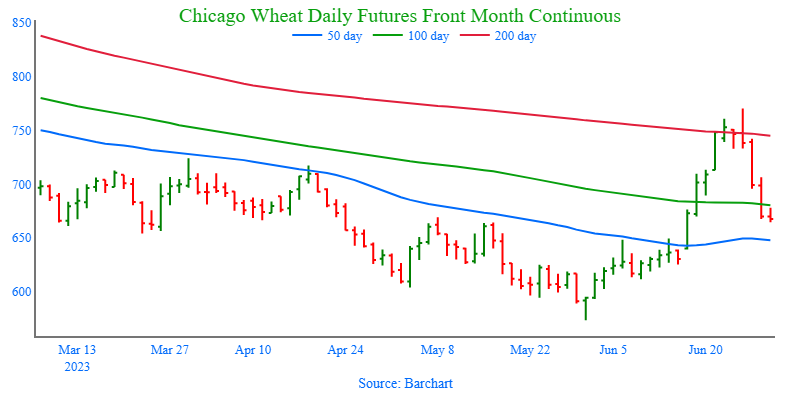
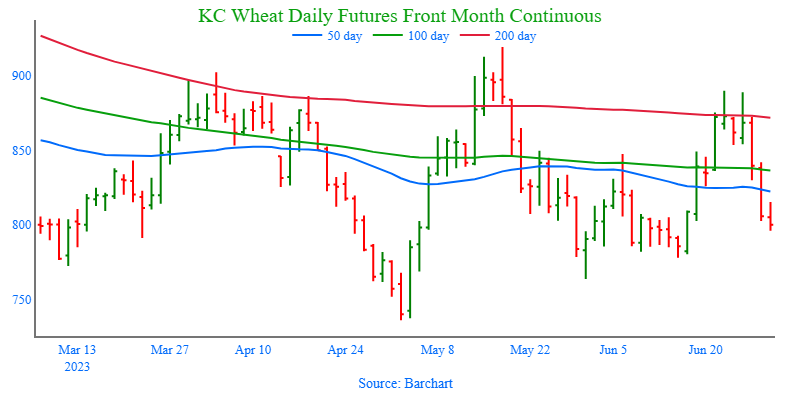
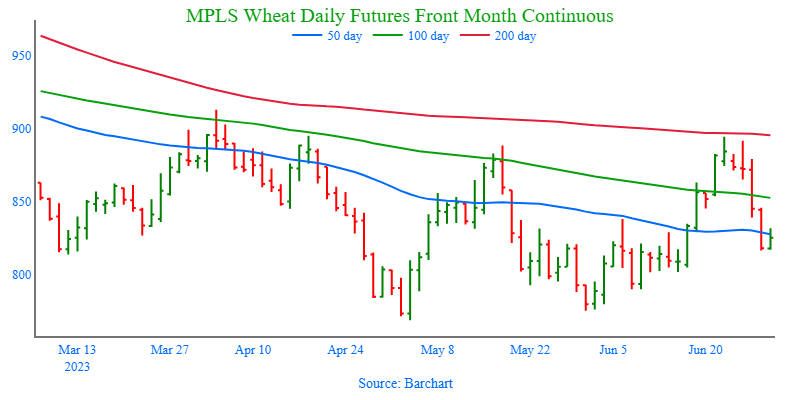
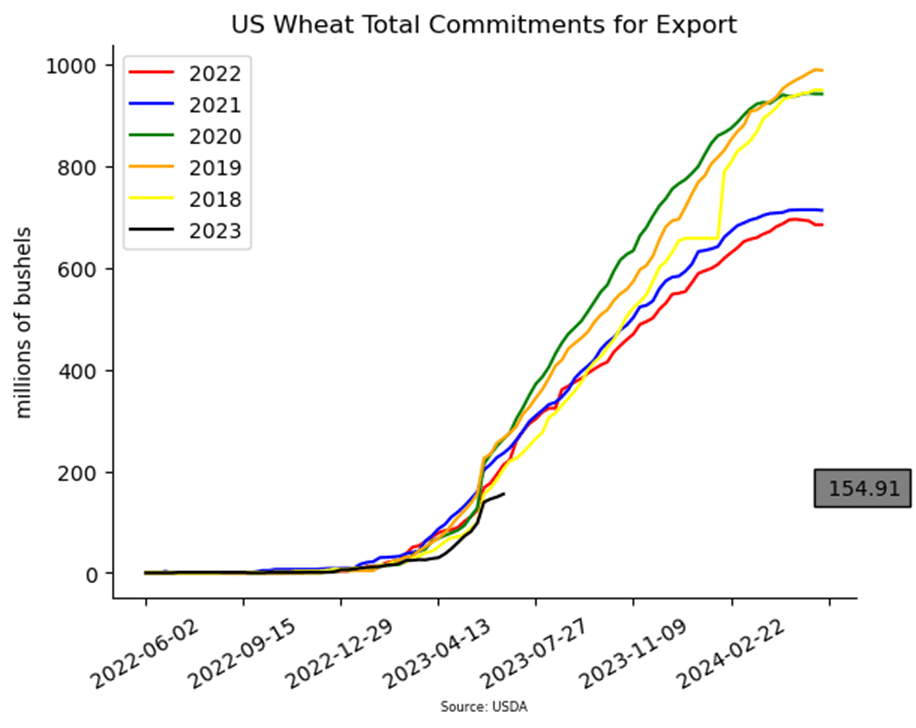
  • Wheat ended Monday lower after being pulled down by falling corn prices and poor export demand.
  • Yesterday, September milling wheat closed up 0.8% and early today those prices were up another 1.6%, so it is possible that US futures open higher.
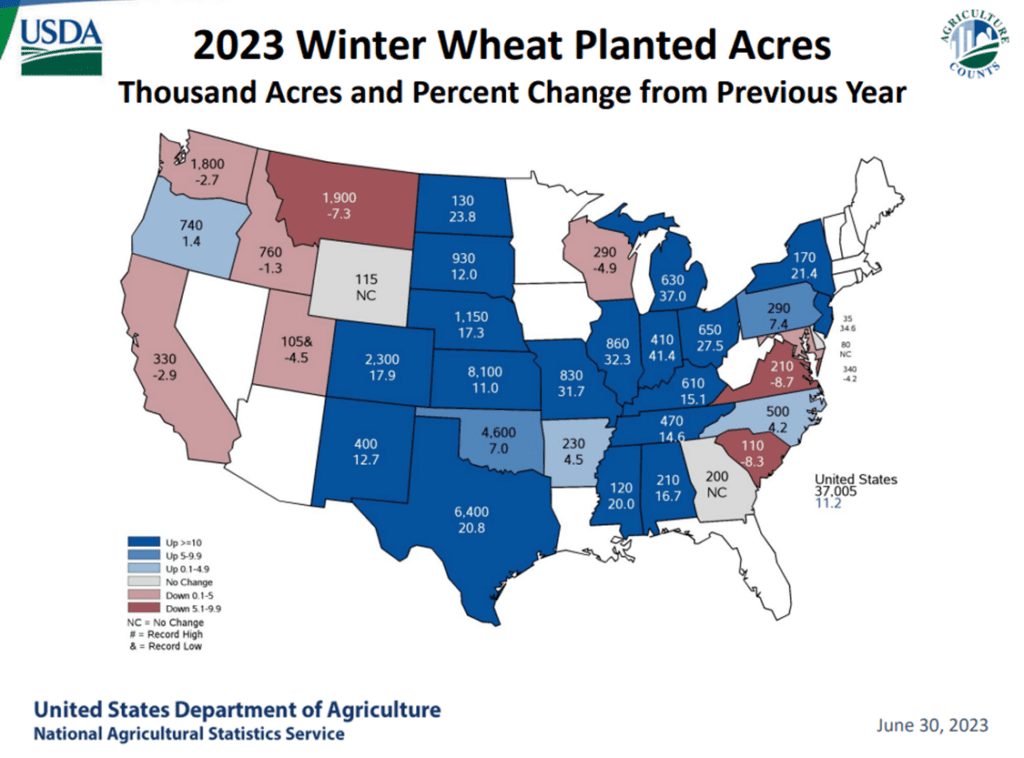
  • On Monday, the USDA said that 37% of winter wheat was harvested which is down from a five year average of 46% for this time of year. Winter wheat good to excellent ratings were steady at 40%.
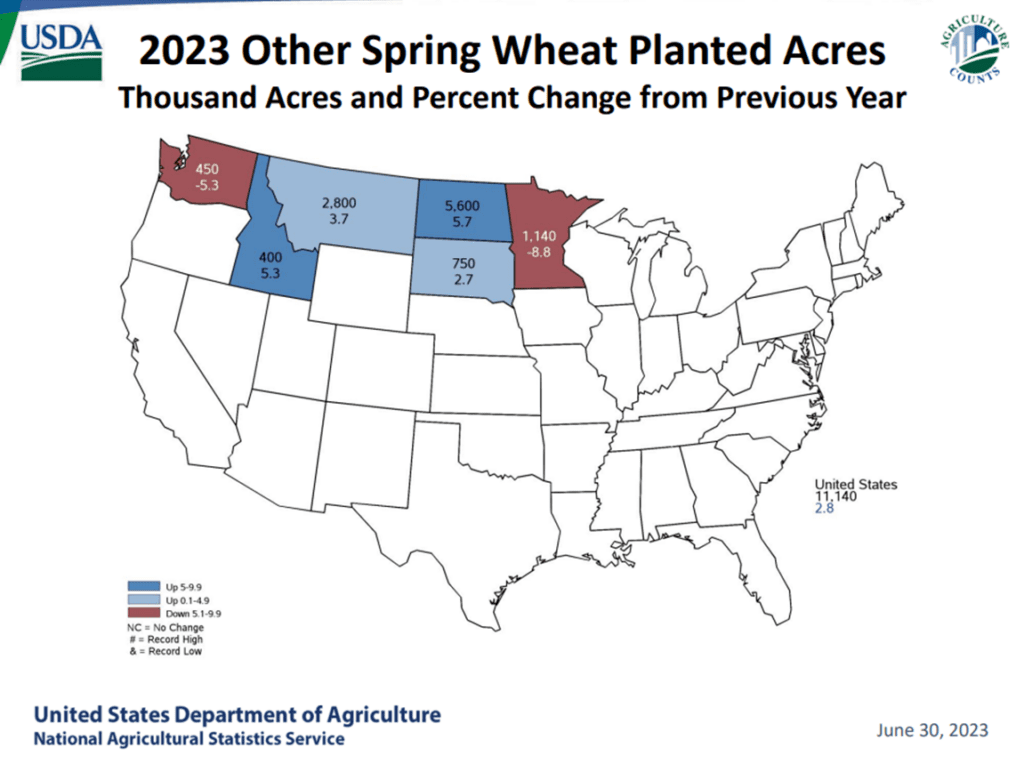
  • Spring wheat good to excellent ratings slipped 2% to 48% good to excellent, and in North Dakota, ratings slipped from 49% to 40%.

Grain Market Insider is provided by Stewart-Peterson Inc., a publishing company.

Futures and options trading involve significant risk of loss and may not be suitable for everyone. Therefore, carefully consider whether such trading is suitable for you in light of your financial condition. The data contained herein is believed to be drawn from reliable sources but cannot be guaranteed. This material has been prepared by a sales or trading employee or agent of Total Farm Marketing by Stewart-Peterson and is, or is in the nature of, a solicitation. Any decisions you may make to buy, sell or hold a futures or options position on such research are entirely your own and not in any way deemed to be endorsed by or attributed to Stewart-Peterson Inc. Reproduction of this information without prior written permission is prohibited. Hypothetical performance results have many inherent limitations. No representation is being made that any account will or is likely to achieve profits or losses similar to those shown. The data contained herein is believed to be drawn from reliable sources but cannot be guaranteed. Reproduction and distribution of this information without prior written permission is prohibited. This material has been prepared by a sales or trading employee or agent of Total Farm Marketing and is, or is in the nature of, a solicitation. Any decisions you may make to buy, sell or hold a position on such research are entirely your own and not in any way deemed to be endorsed by or attributed to Total Farm Marketing.

Stewart-Peterson Inc., Stewart-Peterson Group Inc., and SP Risk Services LLC are each part of the family of companies within Total Farm Marketing (TFM). Stewart-Peterson Inc. is a publishing company. Stewart-Peterson Group Inc. is registered with the Commodity Futures Trading Commission (CFTC) as an introducing broker and is a member of National Futures Association. SP Risk Services LLC is an insurance agency. A customer may have relationships with any or all three companies. 

|

Grain Market Insider: July 3, 2023

The CME and Total Farm Marketing offices will be closed
Tuesday, July 4, in observance of Independence Day

All prices as of 1:45 pm Central Time

Grain Market Highlights

  • Marked by low volume as many traders stayed away for an extended July 4th holiday, the corn market failed to hold onto support from the neighboring soybean market as carryover weakness from Friday’s report and weekend rains weighed on prices.
  • Following Friday’s surprise USDA 4 million acre drop in soybeans planted acres, follow through buying in soybeans added to last week’s gains, though the November contract settled in the bottom end of its range.
  • Continued buying from Friday’s limit up close in soybean oil helped to give an additional support to soybeans and Board Crush margins as December bean oil closed 2.1% higher. Soybean meal traded higher in the overnight but sold off throughout the day to close lower, ending in a bearish reversal.
  • News that the EU is considering letting Russia back into the global banking system, along with weak demand and low Russian prices, pressured all three wheat classes to close lower on the day following two-sided trade.
  • To see the current US NOAA July Temperature and Precipitation Outlooks, scroll down to the Other Charts/Weather Section.

Note – For the best viewing experience, some Grain Market Insider content is best viewed with your phone held horizontally.

Corn

Corn Action Plan Summary

  •  No new action is recommended for Old Crop. The market had a nearly 140-cent swing from the May low to the June high and back on weather. Use any remaining bounces in the market to price what Old Crop bushels you may have, if any. We won’t have any “New Alerts” for 2022 Corn (Cash, Calls, or Puts) as we have moved focus onto 2023 and 2024 Crop Year Opportunities.
  • No action is recommended for New Crop 2023 corn. December corn rallied 139 cents from its May 18 low to its high on June 21 on weather and production concerns. The market is currently off that high on poor export sales figures and a forecast that shows increased chances of rain in the next couple of weeks. When Dec corn was trading over 620, Grain Market Insider recommended making a cash sale and buying Dec 580 puts to cover more downside. The Dec 580 puts, paired with the previously recommended Dec 610 calls, yields a combination of options commonly known as a Strangle, which benefits from dramatic market moves either up or down. Considering it is still early in the season, with drought and crop production uncertainty it is too soon to know if the market high is in or not. Either way, the Strangle position is prepared. If conditions improve from here and prices make new lows, unsold bushels will be protected with the 580 puts. If it doesn’t rain again and prices skyrocket to new highs, already sold bushels will be protected by the 610 calls.
  • Continue to hold current sales levels for the 2024 crop year. The Dec 24 contract is trading weather much like the rest of the market and posted nearly an eighty-cent range between 5/18 and 6/21 as dry conditions affect the ’23 crop and the potential carryout for the 2024 crop year. For now, continue to be patient as Grain Market Insider would like to see prices in the 570 – 600 level before considering making additional sales recommendations for the 2024 crop.

  • The corn market was digesting Friday’s bearish USDA corn acre numbers, weather forecast, and technical weakness as prices drifted lower into the close of the session. Price action remains weak as Dec corn failed to push back through the key $5.00 price level on the day.
  • December corn futures posted a new low for the move, pushing past the low established on 5/18. Finishing with a lower range close, the weak price action will likely keep sellers active on Wednesday as long as support price news is lacking in the market.
  • Large areas of the corn belt saw greater than one inch of rainfall over the past few days, which will likely help some areas in need. Many areas of the corn belt are still overall deficient on rainfall totals, and timely rains will be necessary. Forecasts going into next week are still showing a cooler and wetter overall bias.
  • The USDA will release weekly crop progress report late on Monday afternoon, and analysts are expecting corn conditions to improve slightly to 51% good/excellent, up 1% from last week. Illinois will still be a watched state as decent rainfall coverage occurred over the weekend, and ratings should stabilize.
  • The USDA released weekly export inspections on Monday morning and U.S. exporters shipped 643,000 MT of corn last week. This total was higher than last week’s totals, but year-over-year exports are still lagging by 31%.

Above: The USDA’s Stocks and Acreage report added bearish news to the market with its higher acres estimate. Since the last week of June, prices have been racing towards the 490 – 505 support level which has been in place since January 2021. If the market breaks through the 490 area, there may not be much support until 390 – 415. Overhead lies strong resistance between 595 and 625.

Corn Managed Money Funds net position as of Tuesday, June 27. Net position in Green versus price in Red. Money Managers net sold 5,454 contracts between June 20 – June 27, bringing their total position to a net long 52,845 contracts.

Soybeans

Soybeans Action Plan Summary

  • No new action is being recommended for Old Crop. Any remaining old crop bushels should be getting priced into this rally. We won’t have any “New Alerts” for 2022 Soybeans (Cash, Calls, or Puts) as we have moved focus onto 2023 and 2024 Crop Year Opportunities. 
  • No action is being recommended for New Crop 2023 soybeans. Changes in weather forecasts and crop conditions will continue to dominate the market. With having just recommended making a cash sale, and with one of the most volatile USDA report days of the year coming this Friday, we would need to see the market rally to 1400 – 1450 area before we would consider recommending any additional sales for the 2023 crop. Otherwise, in light of current crop conditions, we will suggest holding tight on further cash sales for now.
  • Continue to hold off on pricing the 2024 crop. We look to make sales further into the 2023 growing season when selling opportunities tend to improve seasonally. 

  • Soybeans ended the day higher after Friday’s huge rally, but November beans backed significantly off their highs overnight where they reached the highest levels since late February. Soybean meal closed lower while soybean oil closed higher.
  • On Friday, the USDA estimated soybeans at 83.5 million acres, far below the average trade guess of 87.7 million acres and the previous USDA estimate of 87.5 ma. US quarterly soy stocks came in at 796 million bushels, below the trade guess of 812 mb but overshadowed by the huge drop in acres.
  • Crop progress will be released later today, and it is expected that good to excellent ratings will increase after the recent rains in some of the driest areas of the Corn Belt. Soybeans are expected to improve by 1% to 52% good to excellent, but that number may come in higher.
  • Friday’s CFTC report showed funds as buyers of soybeans by 22,530 contracts, increasing their net long position to 99,480 contracts.

Above: The USDA’s Stocks and Acreage report gave the market a bullish shot in the arm with a much-reduced acreage estimate. If the market can continue to rally beyond the 1450 area, 1500 – 1550 could be its next target. If not, support could be found between 1340 and 1300 with further support near 1270.

Soybeans Managed Money Funds net position as of Tuesday, June 27. Net position in Green versus price in Red. Money Managers net bought 22,530 contracts between June 20 – June 27, bringing their total position to a net long 99,480 contracts.

Wheat

Market Notes: Wheat

  • The European Union is considering letting the Russian Agricultural Bank back into the global SWIFT program. This reduction of sanctions is an effort to get Russia to extend the Black Sea corridor once again – last week Russia said they do not have reason to extend it beyond expiration on July 17. Meanwhile, Russia continues to lead the world for cheap wheat exports, which remains an anchor for US export demand.
  • News outlets are reporting that Ukraine is conducting drills for a radiation exposure emergency. According to Ukraine officials, Russia has planted explosives at the Zaporizhzhia nuclear plant. This is the same plant that has had several other scares over the past months after being disconnected from the power grid.
  • Weekly wheat export inspections of 12.4 mb for the week ending 6/29 were 64% higher than the week prior 23% higher last year and bring total 23/24 inspections to 40.2 mb.
  • As of June 27, funds reduced their net short position in Chicago wheat from about 90,000 contracts to about 55,000 contracts.
  • Weather over the next seven days is expected to bring more rain to the western corn belt, which may continue to slow harvest in Kansas and Nebraska.

Chicago Wheat Action Plan Summary

  • No new action is recommended for 2023 New Crop. In the month of June, the September Chicago wheat contract posted a 163-cent range and has largely been a follower of the corn market which has been mostly driven by weather. While demand remains weak, production concerns in parts of the country remain, as does uncertainty surrounding the Black Sea region and the potential for major exporting countries’ inventory to hit 16-year lows. While Grain Market Insider will continue to monitor the downside for any violation of major support, following the recent sales recommendation it may be after harvest or near the end of summer before we consider recommending any additional sales for the 2023 crop.
  • No action is currently recommended for 2024 Chicago wheat. Price volatility has risen in the last couple of weeks due to the changing weather forecasts and current events in the Black Sea. While prices have fallen off their recent highs, plenty of time remains to market next year’s crop. War continues in the Black Sea region, major exporting countries’ stocks expected to fall to 16-year lows, and no one knows what the weather will bring, leaving the market vulnerable to many uncertainties.  For now, after recently recommending making a sale for the 2024 crop, and while keeping an eye on the market to see if any major support is broken, Grain Market Insider would need to see prices north of 800 before considering recommending any additional sales.
  •  No Action is currently recommended for 2025 Chicago Wheat. 2025 markets are very illiquid right now, and it may be some time before conditions are conducive to consider making any recommendations. Be patient as we monitor the markets for signs of improvement.

Above: September wheat rallied nearly 200 cents from the May low to its June high when it encountered heavy resistance and posted a bearish reversal. This technical formation on the price chart is considered bearish and momentum may be adding to the bearish tone. Support below the market may be found between 650 – 610, while resistance above the market rests between 770 – 810.

Chicago Wheat Managed Money Funds net position as of Tuesday, June 27. Net position in Green versus price in Red. Money Managers net bought 31,966 contracts between June 20 – June 27, bringing their total position to a net short 52,168 contracts.

KC Wheat Action Plan Summary

  • We continue to look for better prices before making any 2023 sales. While Crop ratings have improved and the Black Sea export corridor remains open, questions remain about the size of the HRW crop, whether Russia will continue to agree to keep the Black Sea corridor open, and what production looks like in Europe and Australia. We continue to target 950 – 1000 in the July futures as a potential level to suggest the next round of New Crop sales.
  • Patience is warranted for the 2024 crop. With continued issues in the Black Sea region and with major exporting countries’ stocks expected to fall to 16-year lows, we are willing to be patient with further sales of New Crop HRW wheat. We are targeting just below the 900 level on the upside while keeping an eye on recent lows for any violation of support.
  • No Action is currently recommended for 2025 Chicago Wheat. 2025 markets are very illiquid right now, and it may be some time before conditions are conducive to consider making any recommendations. Be patient as we monitor the markets for signs of improvement.

Above: Balancing both production and demand concerns, the September contract continues to trade within the 736 – 919 range established in May. The recent downturn in the market has established heavy resistance above the market between 890 – 920, with initial support coming in between 778 – 763 and key support near the May low of 736.

K.C. Wheat Managed Money Funds net position as of Tuesday, June 27. Net position in Green versus price in Red. Money Managers net bought 6,475 contracts between June 20 – 27, bringing their total position to a net long 12,419 contracts.

Mpls Wheat Action Plan Summary

  • No new action for 2022 Old Crop MINNEAPOLIS Wheat. The market had a nearly 116-cent swing from the May low to the June high and back on weather. While weather and geopolitical events can still affect Old Crop prices, the marketing year for Old Crop is quickly winding down, and any additional upside opportunities may be more difficult to come by before New Crop harvest. Use any remaining bounces in the market to price what Old Crop bushels you may have, if any. We won’t have any “New Alerts” for the 2022 crop (Cash, Calls, or Puts) as we have moved focus onto 2023 and 2024 Crop Year opportunities.
  • There continues to be an opportunity to sell 2023 New Crop MINNEAPOLIS Wheat. Weather dominates the market right now, and friendlier forecasts have pushed prices below the 822 support level. Closing below that 822 support signals that the recent uptrend off the May lows may have ended, which poses the risk that the change in trend could erode the price further in the weeks ahead. The first risk being, price drops to the May low of 771, which is where first support comes in. If that level doesn’t hold, then the next risk could be in the 680-710 window. Although making a sale in a down market may be uncomfortable, it’s important at times to have a Plan B with the objective of trying to avoid having to sell bushels at even lower prices in the future if a downtrend takes hold.
  • We continue to hold on pricing the 2024 crop. With the September ‘24 contract about 60 cents from its May 22 low, continued issues in the Black Sea region and major exporting countries’ stocks expected to fall to 16-year lows, we are entering the time frame where we would consider suggesting making sales recommendations while also keeping an eye on the recent lows for any violation of support. 

Above: The September contract rallied out of its congestion area on the Front Month Continuous chart towards the 200-day moving average and into resistance between 889 and 940, the April and December highs respectively.  With the market trading lower, it will need additional bullish news to turn it back around. Should the market continue to fall, support may be found between 770 and 730. 

Minneapolis Wheat Managed Money Funds net position as of Tuesday, June 27. Net position in Green versus price in Red. Money Managers net bought 6,263 contracts between June 20 – June 27, bringing their total position to a net long 3,001 contracts.

Other Charts / Weather

|

Midday Update: July 3, 2023

The CME and Total Farm Marketing offices will be closed
Tuesday, July 4, in observance of Independence Day

All prices as of 10:30 am Central Time

Corn
SEP ’23 491.25 2.75
DEC ’23 496.75 2
DEC ’24 499.5 2.75
Soybeans
AUG ’23 1483 41
NOV ’23 1367.5 24.25
NOV ’24 1244.25 37.5
Chicago Wheat
SEP ’23 651.5 0.5
DEC ’23 670.25 1
JUL ’24 700 2.25
K.C. Wheat
SEP ’23 818.25 18.25
DEC ’23 818.75 18.5
JUL ’24 779.75 11.5
Mpls Wheat
SEP ’23 828.75 11.75
DEC ’23 837.5 11
SEP ’24 778 -16
S&P 500
SEP ’23 4487 -1.25
Crude Oil
SEP ’23 70.8 0.02
Gold
OCT ’23 1954.2 5.7

  • Corn began higher in the overnight but has faded and is now relatively unchanged. Friday’s USDA report was bearish for corn after planted acres were forecast to be higher.
  • Very beneficial rains fell over some of the driest areas of the Corn Belt this weekend, but there was also some hail and rain damage in some fields.
  • Last week’s acreage number came in 2.1 million acres higher than in March which pressured futures, but the June 1 stocks number was lower than expected and down 155 mb from pre report estimates.
  • This afternoon’s Crop Progress report will let traders know whether or not the recent rains were enough to help the crop turn around. Good to excellent ratings will likely increase.

  • Soybeans are still riding the high from Friday’s very bullish USDA report but have faded slightly from overnight highs which hit the highest prices since February 24.
  • Friday’s NASS stocks and seeding report showed that soybean stocks were 16 mb below estimates and 172 mb below a year ago, but the huge bullish news was soybean acres falling 4 million below March intentions.
  • Soy products in China followed the lead of US markets and moved higher with soybean oil on the Dalian exchange rising 6%.
  • World veg oils have been moving significantly higher with Malaysian palm oil futures up 5.2% which is the highest level since March. US soybean oil futures are at their highest levels since December of last year.

  • Wheat has bounced around today, opening lower but now trading significantly higher in the KC wheat contract, while Chicago is a bit higher and Minn. wheat lower.
  • Friday’s USDA report showed wheat stocks to be lower than expected at 580 mb, 31 mb lower than expectations and what would be the lowest in 16 years.
  • The EU is weighing concessions to a Russian bank over the Black Sea grain deal in hopes that Russia will agree to extend the deal.
  • Friday’s CFTC report showed funds buying back a big chunk of their short position. They bought back 31,966 contracts, reducing their net short position to 52,168 contracts.

Grain Market Insider is provided by Stewart-Peterson Inc., a publishing company.

Futures and options trading involve significant risk of loss and may not be suitable for everyone. Therefore, carefully consider whether such trading is suitable for you in light of your financial condition. The data contained herein is believed to be drawn from reliable sources but cannot be guaranteed. This material has been prepared by a sales or trading employee or agent of Total Farm Marketing by Stewart-Peterson and is, or is in the nature of, a solicitation. Any decisions you may make to buy, sell or hold a futures or options position on such research are entirely your own and not in any way deemed to be endorsed by or attributed to Stewart-Peterson Inc. Reproduction of this information without prior written permission is prohibited. Hypothetical performance results have many inherent limitations. No representation is being made that any account will or is likely to achieve profits or losses similar to those shown. The data contained herein is believed to be drawn from reliable sources but cannot be guaranteed. Reproduction and distribution of this information without prior written permission is prohibited. This material has been prepared by a sales or trading employee or agent of Total Farm Marketing and is, or is in the nature of, a solicitation. Any decisions you may make to buy, sell or hold a position on such research are entirely your own and not in any way deemed to be endorsed by or attributed to Total Farm Marketing.

Stewart-Peterson Inc., Stewart-Peterson Group Inc., and SP Risk Services LLC are each part of the family of companies within Total Farm Marketing (TFM). Stewart-Peterson Inc. is a publishing company. Stewart-Peterson Group Inc. is registered with the Commodity Futures Trading Commission (CFTC) as an introducing broker and is a member of National Futures Association. SP Risk Services LLC is an insurance agency. A customer may have relationships with any or all three companies. 

|

Opening Update: July 3, 2023

All prices as of 6:30 am Central Time

Corn
SEP ’23 491.25 2.75
DEC ’23 496.5 1.75
DEC ’24 504.25 7.5
Soybeans
AUG ’23 1495 53
NOV ’23 1378.75 35.5
NOV ’24 1242.25 35.5
Chicago Wheat
SEP ’23 647.75 -3.25
DEC ’23 665.75 -3.5
JUL ’24 696 -1.75
K.C. Wheat
SEP ’23 803.5 3.5
DEC ’23 805.75 5.5
JUL ’24 767.25 -1
Mpls Wheat
SEP ’23 822.75 5.75
DEC ’23 822.5 -4
SEP ’24 778 -16
S&P 500
SEP ’23 4488.5 0.25
Crude Oil
SEP ’23 71.27 0.49
Gold
OCT ’23 1939.5 -9

  • Corn is trading higher this morning despite last week’s bearish USDA report but is likely following soybeans today with their large gains.
  • Friday’s corn planting estimate was 94.1 million acres by the USDA, the most since 2013. This makes it more likely for 23/24 ending stocks to rise.
  • The Corn Belt received significant rains in most areas with some of those areas in the most need, so today’s crop progress report will show if good to excellent ratings start moving back up.
  • Funds were net sellers as of June 28 reducing their net long position by 5,454 contracts reducing it to 52,845 contracts.

  • Soybeans are continuing their ascent this morning on the heels of Friday’s very bullish USDA report. Both soybean meal and soybean oil are significantly higher.
  • The USDA’s acreage report on Friday said that only 83.5 million acres of soybeans are expected to be planted in 2023, but 8.2 million acres of those aren’t planted yet and may not get planted.
  • The National Atmospheric and Oceanic Administration issued a new Seasonal Drought Outlook on Friday which showed drought persisting but improving in the central Midwest while worsening in Wisconsin and Michigan.
  • Friday’s CFTC report showed funds as buyers of soybeans by 22,530 contracts, increasing their net long position to 99,480 contracts.

  • Wheat is trading lower this morning despite gains in both corn and soybeans, and KC wheat is leading the way lower as weather improves and exports remain stagnant.
  • Friday’s report which showed more corn acres being planted would give the US a surplus of corn to feed that would cut into wheat use for feed and is a bearish factor.
  • Over the weekend, ABC News reported that Ukraine’s nuclear power plant was doing drills to prepare for possible emergency radiation exposure after the government said that Russia planted explosives at the power plant.
  • Friday’s CFTC report showed funds buying back a big chunk of their short position. They bought back 31,966 contracts, reducing their net short position to 52,168 contracts.

Grain Market Insider is provided by Stewart-Peterson Inc., a publishing company.

Futures and options trading involve significant risk of loss and may not be suitable for everyone. Therefore, carefully consider whether such trading is suitable for you in light of your financial condition. The data contained herein is believed to be drawn from reliable sources but cannot be guaranteed. This material has been prepared by a sales or trading employee or agent of Total Farm Marketing by Stewart-Peterson and is, or is in the nature of, a solicitation. Any decisions you may make to buy, sell or hold a futures or options position on such research are entirely your own and not in any way deemed to be endorsed by or attributed to Stewart-Peterson Inc. Reproduction of this information without prior written permission is prohibited. Hypothetical performance results have many inherent limitations. No representation is being made that any account will or is likely to achieve profits or losses similar to those shown. The data contained herein is believed to be drawn from reliable sources but cannot be guaranteed. Reproduction and distribution of this information without prior written permission is prohibited. This material has been prepared by a sales or trading employee or agent of Total Farm Marketing and is, or is in the nature of, a solicitation. Any decisions you may make to buy, sell or hold a position on such research are entirely your own and not in any way deemed to be endorsed by or attributed to Total Farm Marketing.

Stewart-Peterson Inc., Stewart-Peterson Group Inc., and SP Risk Services LLC are each part of the family of companies within Total Farm Marketing (TFM). Stewart-Peterson Inc. is a publishing company. Stewart-Peterson Group Inc. is registered with the Commodity Futures Trading Commission (CFTC) as an introducing broker and is a member of National Futures Association. SP Risk Services LLC is an insurance agency. A customer may have relationships with any or all three companies. 

|

Grain Market Insider: June 30, 2023

The CME and Total Farm Marketing offices will be closed
Tuesday, July 4, in observance of Independence Day

All prices as of 1:45 pm Central Time

Grain Market Highlights

  • While corn stocks reported by the USDA as of June 1 were 150 mb below expectations, it was the incredibly bearish surprise increase of 2.3 mil. acres that shocked the market and sent it reeling sharply lower.
  • The USDA’s soybean stocks and planted acreage numbers came in well below expectations at 796 mb and 83.5 mil. acres respectively and launched soybeans higher, wiping out losses back to June 22.
  • Soybean meal and oil joined in the fun trading higher and added support to soybeans as Dec meal closed with a gain of $16.80 (4.4%), and Dec bean oil closed limit up with a gain of 4.00 cents (7.3%).
  • The wheat complex ended the day mixed, as pressure spilled over from lower corn, and planted acres for wheat were mostly as expected, with June 1 stocks 31 mb below expectations.
  • A lower US Dollar was unable to lend any support to the corn or wheat markets as it traded lower, eclipsing yesterday’s gains.
  • To see the updated USDA Planted Acreage maps, scroll down to the Other Charts/Weather Section.

Note – For the best viewing experience, some Grain Market Insider content is best viewed with your phone held horizontally.

Corn

Corn Action Plan Summary

  •  No new action is recommended for Old Crop. The market had a nearly 140-cent swing from the May low to the June high and back on weather. Use any remaining bounces in the market to price what Old Crop bushels you may have, if any. We won’t have any “New Alerts” for 2022 Corn (Cash, Calls, or Puts) as we have moved focus onto 2023 and 2024 Crop Year Opportunities.
  • No action is recommended for New Crop 2023 corn.  December corn rallied 139 cents from its May 18 low to its high on June 21 on weather and production concerns. The market is currently off that high on poor export sales figures and a forecast that shows increased chances of rain in the next couple of weeks. When Dec corn was trading over 620, Grain Market Insider recommended making a cash sale and buying Dec 580 puts to cover more downside. The Dec 580 puts, paired with the previously recommended Dec 610 calls, yields a combination of options commonly known as a Strangle, which benefits from dramatic market moves either up or down. Considering it is still early in the season, with drought and crop production uncertainty it is too soon to know if the market high is in or not. Either way, the Strangle position is prepared. If conditions improve from here and prices make new lows, unsold bushels will be protected with the 580 puts. If it doesn’t rain again and prices skyrocket to new highs, already sold bushels will be protected by the 610 calls.
  • Continue to hold current sales levels for the 2024 crop year.  The Dec 24 contract is trading weather much like the rest of the market and posted nearly an eighty-cent range between 5/18 and 6/21 as dry conditions affect the ’23 crop and the potential carryout for the 2024 crop year. For now, continue to be patient as Grain Market Insider would like to see prices in the 570 – 600 level before considering making additional sales recommendations for the 2024 crop.

  • A surprise jump in corn planted acres brought strong selling pressure in the corn market to end the week. December corn closed down 6.4% and posted its lowest daily close since October 2021. For the week, December corn futures dropped 93-1/4 cents.
  • The USDA Planted Acres report raised planted corn acres to 94.1 million acres, the highest total in 10 years, and up 2.3% from the March intentions report and 6.2% over last year.  Market analysts were expecting a total of 91.9 million acres.
  • USDA released quarterly Grain Stocks report, and total grain stocks were 4.106 billion bushels, down 150 million bushels from expectations and 5.6% from last year’s total. The supportive number was outweighed by the strong jump in planted acres during the session.
  • Weather forecasts remain more friendly for crop development as long-range forecasts hold a wetter and cooler bias across the corn belt into the middle of July.
  • The weak prices action and technical close will likely keep the corn market pressured going into the holiday trade next week. The December close below $5.00 is disappointing to market bulls and could trigger additional liquidation to start the week.

Above: The USDA’s Stocks and Acreage report added bearish news to the market with its higher acres estimate. Since the last week of June, prices have been racing towards the 490 – 505 support level which has been in place since January 2021. If the market breaks through the 490 area, there may not be much support until 390 – 415. Overhead lies strong resistance between 595 and 625.

Soybeans

Soybeans Action Plan Summary

  • No new action is being recommended for Old Crop. Any remaining old crop bushels should be getting priced into this rally. We won’t have any “New Alerts” for 2022 Soybeans (Cash, Calls, or Puts) as we have moved focus onto 2023 and 2024 Crop Year Opportunities. 
  • No action is being recommended for New Crop 2023 soybeans. Changes in weather forecasts and crop conditions will continue to dominate the market. With having just recommended making a cash sale, and with one of the most volatile USDA report days of the year coming this Friday, we would need to see the market rally to 1400 – 1450 area before we would consider recommending any additional sales for the 2023 crop. Otherwise, in light of current crop conditions, we will suggest holding tight on further cash sales for now.
  • Continue to hold off on pricing the 2024 crop. We look to make sales further into the 2023 growing season when selling opportunities tend to improve seasonally. 

  • Soybeans absolutely skyrocketed today following the USDA Acreage and Stocks report which saw fewer soybean acres planted in favor of corn. Soybean meal ended over 4% higher, and soybean oil closed over 7% higher in the December contracts.
  • The USDA has estimated soybeans at 83.5 million acres, far below the average trade guess of 87.7 million acres and the previous USDA estimate of 87.5 ma. US quarterly soy stocks came in at 796 million bushels, below the trade guess of 812 mb but overshadowed by the huge drop in acres.
  • Private exporters reported to the USDA export sales of 132,000 metric tons of soybeans for delivery to China during the 23/24 marketing year. This was the first flash sale to China that the US has seen in months.
  • While today’s report gave soybeans a significant rally, weekend weather is forecast to be wet in the driest areas of the Corn Belt, and the longer-term forecast is wet as well. It is possible that trade will go back to trading weather markets next week.

Above: The USDA’s Stocks and Acreage report gave the market a bullish shot in the arm with a much-reduced acreage estimate. If the market can continue to rally beyond the 1450 area, 1500 – 1550 could be its next target. If not, support could be found between 1340 and 1300 with further support near 1270.

Wheat

Market Notes: Wheat

  • Today the USDA estimated 2023 all wheat acreage basically in line with expectation at 49.6 mb vs 49.65 mb expected. This was, however, up 9% from 2022. Included in this change was spring wheat acreage, which increased from the expected 10.51 mb to 11.1 mb.
  • Today the USDA estimated June 1 wheat stocks at 580 million bushels. This was less than the 611 mb expectation and 698 mb last year. While this is somewhat friendly, wheat likely followed corn lower.
  • Yesterday the International Grains Council increased their projection of world wheat production by 6 mmt to 783 mmt for 23/24, which offered no support to the US wheat market today.
  • Technical momentum for wheat is downward on both stochastics and the RSI. Support for Dec Chicago wheat at the 21-day moving average, around 6.91, was violated today.
  • According to Russia’s foreign minister, Sergei Lavrov, he sees no arguments to extend the Black Sea export deal beyond the expiration of July 18.
  • Paris milling wheat could not hold onto earlier gains and posted losses for a fourth day out of the past five sessions.

Chicago Wheat Action Plan Summary

  • No new action is recommended for the 2022 crop. Grain Market Insider is done with the 2022 crop, and there will be no New Alerts posted for the 2022 crop going forward.
  • No new action is recommended for 2023 New Crop. In the month of June, the September Chicago wheat contract posted a 163-cent range and has largely been a follower of the corn market which has been mostly driven by weather. While demand remains weak, production concerns in parts of the country remain, as does uncertainty surrounding the Black Sea region and the potential for major exporting countries’ inventory to hit 16-year lows. While Grain Market Insider will continue to monitor the downside for any violation of major support, following the recent sales recommendation it may be after harvest or near the end of summer before we consider recommending any additional sales for the 2023 crop.
  • No action is currently recommended for 2024 Chicago wheat. Price volatility has risen in the last couple of weeks due to the changing weather forecasts and current events in the Black Sea. While prices have fallen off their recent highs, plenty of time remains to market next year’s crop. War continues in the Black Sea region, major exporting countries’ stocks expected to fall to 16-year lows, and no one knows what the weather will bring, leaving the market vulnerable to many uncertainties. For now, after recently recommending making a sale for the 2024 crop, and while keeping an eye on the market to see if any major support is broken, Grain Market Insider would need to see prices north of 800 before considering recommending any additional sales.  

Above: September wheat rallied nearly 200 cents from the May low to its June high when it encountered heavy resistance and posted a bearish reversal. This technical formation on the price chart is considered bearish and momentum may be adding to the bearish tone. Support below the market may be found between 650 – 610, while resistance above the market rests between 770 – 810.

KC Wheat Action Plan Summary

  • No new action is recommended for the 2022 crop. Though most, if not all, of your Old Crop 2022 wheat may be sold, consider storing any remaining Old Crop, if possible, in anticipation of a short new crop this year, and marketing it along with the new crop.
  • We continue to look for better prices before making any 2023 sales. While Crop ratings have improved and the Black Sea export corridor remains open, questions remain about the size of the HRW crop, whether Russia will continue to agree to keep the Black Sea corridor open, and what production looks like in Europe and Australia. We continue to target 950 – 1000 in the July futures as a potential level to suggest the next round of New Crop sales.
  • Patience is warranted for the 2024 crop. With continued issues in the Black Sea region and with major exporting countries’ stocks expected to fall to 16-year lows, we are willing to be patient with further sales of New Crop HRW wheat. We are targeting just below the 900 level on the upside while keeping an eye on recent lows for any violation of support.

Above: Balancing both production and demand concerns, the September contract continues to trade within the 736 – 919 range established in May. The recent downturn in the market has established heavy resistance above the market between 890 – 920, with initial support coming in between 778 – 763 and key support near the May low of 736.

Mpls Wheat Action Plan Summary

  • No new action for 2022 Old Crop MINNEAPOLIS Wheat.  The market had a nearly 116-cent swing from the May low to the June high and back on weather. While weather and geopolitical events can still affect Old Crop prices, the marketing year for Old Crop is quickly winding down, and any additional upside opportunities may be more difficult to come by before New Crop harvest. Use any remaining bounces in the market to price what Old Crop bushels you may have, if any. We won’t have any “New Alerts” for the 2022 crop (Cash, Calls, or Puts) as we have moved focus onto 2023 and 2024 Crop Year opportunities.
  • There continues to be an opportunity to sell 2023 New Crop MINNEAPOLIS Wheat. Weather dominates the market right now, and friendlier forecasts have pushed prices below the 822 support level. Closing below that 822 support signals that the recent uptrend off the May lows may have ended, which poses the risk that the change in trend could erode the price further in the weeks ahead. The first risk being, price drops to the May low of 771, which is where first support comes in. If that level doesn’t hold, then the next risk could be in the 680-710 window. Although making a sale in a down market may be uncomfortable, it’s important at times to have a Plan B with the objective of trying to avoid having to sell bushels at even lower prices in the future if a downtrend takes hold.
  • We continue to hold on pricing the 2024 crop. With the September ‘24 contract about 60 cents from its May 22 low, continued issues in the Black Sea region and major exporting countries’ stocks expected to fall to 16-year lows, we are entering the time frame where we would consider suggesting making sales recommendations while also keeping an eye on the recent lows for any violation of support. 

Above: The September contract rallied out of its congestion area on the Front Month Continuous chart towards the 200-day moving average and into resistance between 889 and 940, the April and December highs respectively.  With the market trading lower, it will need additional bullish news to turn it back around. Should the market continue to fall, support may be found between 770 and 730. 

Other Charts / Weather

|

Midday Update: June 30, 2023

The CME and Total Farm Marketing offices will be closed
Tuesday, July 4, in observance of Independence Day

All prices as of 10:30 am Central Time

Corn
JUL ’23 585 4
DEC ’23 530.5 2
DEC ’24 511.25 4.25
Soybeans
JUL ’23 1505 22
NOV ’23 1289.5 23.75
NOV ’24 1212 6
Chicago Wheat
JUL ’23 654.75 1.75
SEP ’23 669 1.5
JUL ’24 710.5 2
K.C. Wheat
JUL ’23 818 23.75
SEP ’23 819 19
JUL ’24 786 12.25
Mpls Wheat
JUL ’23 825 17.5
SEP ’23 837.5 12
SEP ’24 794 0.75
S&P 500
SEP ’23 4483.75 48
Crude Oil
AUG ’23 70.83 0.97
Gold
AUG ’23 1923.2 5.3

  • It is estimated that 70% of the US corn crop remains in drought. This is up from last week at 64%.
  • The storm system yesterday brought reports of hail and wind damage in several areas of the Midwest. The National Weather Service is officially calling this a derecho due to the strength of the winds over a widespread area.
  • The seven-day forecast continues to show rain for a large part of the corn belt, including some of the driest areas that received rain yesterday.
  • After the recent downtrend, corn futures are now at or near oversold levels on daily stochastics.
  • According to CONAB, Brazil’s government is ready to buy 500,000 mt of corn in an effort to rebuild food stocks.

  • It is estimated that 63% of the US soybean crop is in drought. This is up from 57% last week.
  • Private exporters reported sales of 132,000 mt of soybeans for delivery to China during the 23/24 marketing year.
  • Soybean oil is more than 2 cents higher this morning, which may be fueled by a higher palm oil market. This in turn may be offering support to soybean futures which currently show double-digit gains for the day.
  • After today’s Stock and Acreage reports, the next USDA report will be the WASDE on July 12. Due to worsening crop conditions for soybeans (and corn), there is a good chance they will lower yields at that time. The big question is whether or not that will be enough to offset poor export demand, with commitments to date behind the USDA’s goal.
  • Argentina’s soybean harvest is now complete, and yields are said to be 45% behind the 5-year average, according to the Buenos Aires Grain Exchange.

  • KC wheat is leading the US wheat complex higher this morning. Paris milling wheat futures are also higher for the second day in a row – France reported another decline in their crop condition to 81% good to excellent.
  • South Korean flour mills are reported to have purchased 50,000 mt of US wheat overnight.
  • Chicago wheat futures have downward momentum on both daily stochastics and the RSI. However, December Chicago wheat may be finding support near the 21-day moving average, which today is at 6.90-3/4.
  • Not only is today a report day, but it is also month and quarter end. This could result in position squaring and increased volatility. The upcoming shortened Independence Day holiday week could have a similar result, especially if the weather forecast has any major changes this weekend.
  • Russia’s foreign minister, Sergei Lavrov, told reporters that he sees no arguments to extend the Black Sea Grain Initiative. The current deal is set to expire on July 18.

Grain Market Insider is provided by Stewart-Peterson Inc., a publishing company.

Futures and options trading involve significant risk of loss and may not be suitable for everyone. Therefore, carefully consider whether such trading is suitable for you in light of your financial condition. The data contained herein is believed to be drawn from reliable sources but cannot be guaranteed. This material has been prepared by a sales or trading employee or agent of Total Farm Marketing by Stewart-Peterson and is, or is in the nature of, a solicitation. Any decisions you may make to buy, sell or hold a futures or options position on such research are entirely your own and not in any way deemed to be endorsed by or attributed to Stewart-Peterson Inc. Reproduction of this information without prior written permission is prohibited. Hypothetical performance results have many inherent limitations. No representation is being made that any account will or is likely to achieve profits or losses similar to those shown. The data contained herein is believed to be drawn from reliable sources but cannot be guaranteed. Reproduction and distribution of this information without prior written permission is prohibited. This material has been prepared by a sales or trading employee or agent of Total Farm Marketing and is, or is in the nature of, a solicitation. Any decisions you may make to buy, sell or hold a position on such research are entirely your own and not in any way deemed to be endorsed by or attributed to Total Farm Marketing.

Stewart-Peterson Inc., Stewart-Peterson Group Inc., and SP Risk Services LLC are each part of the family of companies within Total Farm Marketing (TFM). Stewart-Peterson Inc. is a publishing company. Stewart-Peterson Group Inc. is registered with the Commodity Futures Trading Commission (CFTC) as an introducing broker and is a member of National Futures Association. SP Risk Services LLC is an insurance agency. A customer may have relationships with any or all three companies. 

|

Opening Update: June 30, 2023

All prices as of 6:30 am Central Time

Corn
JUL ’23 582 1
DEC ’23 531.25 2.75
DEC ’24 508.75 1.75
Soybeans
JUL ’23 1509.75 26.75
NOV ’23 1282.25 16.5
NOV ’24 1214.75 8.75
Chicago Wheat
JUL ’23 657.5 4.5
SEP ’23 672 4.5
JUL ’24 712.25 3.75
K.C. Wheat
JUL ’23 814 19.75
SEP ’23 808.5 8.5
JUL ’24 780 6.25
Mpls Wheat
JUL ’23 807.5 3.75
SEP ’23 834 8.5
SEP ’24 794 0.75
S&P 500
SEP ’23 4451.5 15.75
Crude Oil
AUG ’23 69.79 -0.07
Gold
AUG ’23 1913.5 -4.4

  • Corn is trading slightly higher this morning after yesterday’s Derecho winds across the Midwest that brought rain but strong winds and large hail as well.
  • There were 64 reports of large hail yesterday and 477 reports of wind damage with three counties in Illinois reporting gusts over 100 mph.
  • Despite the storm and damage, Illinois was in desperate need of rain which it received a decent amount of.
  • The planted acreage report will be released today and trade estimates are guessing that corn acres will be at 91.85 million acres, down 150,000 acres from March intentions, some of these acres may be going towards soybeans.

  • Soybeans are trading higher with July leading and both soybean meal and oil higher as well. Yesterday’s storm and the damage it caused is helping futures out today.
  • Soybean oil has gotten support from a rise in world veg oil prices with palm oil up today, and concerns about smaller southeast Asian palm oil production.
  • Today’s USDA acreage report is expected to show a small increase in soybean acres with likely increases in Minnesota and North Dakota. Stocks are expected to be tighter.
  • Argentina has completed their soybean harvest with yields coming in 45% less than normal, another bullish factor today.

  • Wheat is trading higher this morning with KC leading the way up after forecasts turned slightly drier for spring wheat areas.
  • The USDA acreage report is expecting to show slightly lower spring wheat acreage and about 200,000 acres of declines in all wheat. Wheat stocks are forecast to be 611 mb compared to current ending stocks of 598 mb.
  • Global wheat production is now estimated higher at 786 mmt from 783 mmt, but stockpile estimates are expected to fall to 264 mmt from 271 mmt as consumption expands.
  • Ukraine’s wheat crop is being estimated at 17.9 mmt which is down 12% year over year.

Grain Market Insider is provided by Stewart-Peterson Inc., a publishing company.

Futures and options trading involve significant risk of loss and may not be suitable for everyone. Therefore, carefully consider whether such trading is suitable for you in light of your financial condition. The data contained herein is believed to be drawn from reliable sources but cannot be guaranteed. This material has been prepared by a sales or trading employee or agent of Total Farm Marketing by Stewart-Peterson and is, or is in the nature of, a solicitation. Any decisions you may make to buy, sell or hold a futures or options position on such research are entirely your own and not in any way deemed to be endorsed by or attributed to Stewart-Peterson Inc. Reproduction of this information without prior written permission is prohibited. Hypothetical performance results have many inherent limitations. No representation is being made that any account will or is likely to achieve profits or losses similar to those shown. The data contained herein is believed to be drawn from reliable sources but cannot be guaranteed. Reproduction and distribution of this information without prior written permission is prohibited. This material has been prepared by a sales or trading employee or agent of Total Farm Marketing and is, or is in the nature of, a solicitation. Any decisions you may make to buy, sell or hold a position on such research are entirely your own and not in any way deemed to be endorsed by or attributed to Total Farm Marketing.

Stewart-Peterson Inc., Stewart-Peterson Group Inc., and SP Risk Services LLC are each part of the family of companies within Total Farm Marketing (TFM). Stewart-Peterson Inc. is a publishing company. Stewart-Peterson Group Inc. is registered with the Commodity Futures Trading Commission (CFTC) as an introducing broker and is a member of National Futures Association. SP Risk Services LLC is an insurance agency. A customer may have relationships with any or all three companies. 

|

Grain Market Insider: June 29, 2023

All prices as of 1:45 pm Central Time

Grain Market Highlights

  • Continued long liquidation and technical selling, paired with less than stellar export sales, pressured the corn market ahead of tomorrow’s USDA Stocks and Acreage report.
  • First Notice Day is tomorrow, and with reduced position limits for the July contract, it appears short July position holders were in a race to cover positions with July closing sharply higher and the July/August spread gaining 26 cents.
  • New Crop soybean contracts closed nearly unchanged, balanced by higher soybean meal and lower soybean oil. With traders squaring meal positions ahead of tomorrow’s report while bean oil saw more technical follow through selling after yesterday’s bearish reversal.
  • Weak export sales and a higher US Dollar added resistance to the wheat markets with Chicago and K.C. following corn lower, while Minneapolis closed higher.  
  • The US Dollar broke out of its recent range to the upside and traded to a high of 103.44, on hawkish comments from Jerome Powell and a better-than-expected GDP report. The move higher may add a layer of resistance to the grain markets if it continues.
  • To see the current US Drought Monitor and US 7-day Precipitation forecast, scroll down to the Other Charts/Weather Section.

Note – For the best viewing experience, some Grain Market Insider content is best viewed with your phone held horizontally.

Corn

Corn Action Plan Summary

  •  No new action is recommended for Old Crop. The market had a nearly 140-cent swing from the May low to the June high and back on weather. Use any remaining bounces in the market to price what Old Crop bushels you may have, if any. We won’t have any “New Alerts” for 2022 Corn (Cash, Calls, or Puts) as we have moved focus onto 2023 and 2024 Crop Year Opportunities.
  • No action is recommended for New Crop 2023 corn.  December corn rallied 139 cents from its May 18 low to its high on June 21 on weather and production concerns. The market is currently off that high on poor export sales figures and a forecast that shows increased chances of rain in the next couple of weeks. When Dec corn was trading over 620, Grain Market Insider recommended making a cash sale and buying Dec 580 puts to cover more downside. The Dec 580 puts, paired with the previously recommended Dec 610 calls, yields a combination of options commonly known as a Strangle, which benefits from dramatic market moves either up or down. Considering it is still early in the season, with drought and crop production uncertainty it is too soon to know if the market high is in or not. Either way, the Strangle position is prepared. If conditions improve from here and prices make new lows, unsold bushels will be protected with the 580 puts. If it doesn’t rain again and prices skyrocket to new highs, already sold bushels will be protected by the 610 calls.
  • Continue to hold current sales levels for the 2024 crop year.  The Dec 24 contract is trading weather much like the rest of the market and posted nearly an eighty-cent range between 5/18 and 6/21 as dry conditions affect the ’23 crop and the potential carryout for the 2024 crop year. For now, continue to be patient as Grain Market Insider would like to see prices in the 570 – 600 level before considering making additional sales recommendations for the 2024 crop.

  • Further technical selling and long liquidation pushed the corn market moderately lower.  December corn failed to find support at the June 8 price gap at $6.33 ½. Confirmation of rainfall in recent forecasts and longer-term weather models holding a wetter and cooler bias pressure the market.
  • The selling in December corn futures has been aggressive as prices have lost nearly 16% over the past six trading sessions and has been measured as one of the steepest six-session drops in corn prices during the month of June over the past three decades.
  • Export demand remains a concern as the weekly USDA Export Sales report showed new sales of 140,400 MT of old crop and 123,500 MT of new crop. The total sales were at the lower end of analysts’ expectations.
  • Weather models remain bearish for prices, as the 8-14 day forecast is looking at trending overall cooler temperature and above average precipitation over the majority of the corn belt.  Rainfall looks to be targeted over Iowa, Illinois and into Indiana, areas that shifted drier on the latest drought monitor maps.
  • Drought monitor maps are reflecting the dry conditions, as the estimate is up to 70% of corn acres in the U.S. are experiencing some form of drought, up 10% from last week.
  • The market may be poised for some short covering before Friday’s 11:00 am USDA Planted Acreage and Grain Stocks report, as traders could look to square positions. Expectations are for corn acres to be at 91.8 million acres, down slightly from the March planting estimates. Grain stocks for the quarter are expected to be near 4.25 billion bushels, down 2.3% from last year.

Above: The weather has been a dominant feature of the current market and since May 18, September corn has had a 127-cent swing and back, testing 625 resistance and falling through 540 support. Without more bullish news, prices could slide further, where support may be found around the psychological level of 500, between 490 – 505, with key resistance above the market near 625.

Soybeans

Soybeans Action Plan Summary

  • No new action is being recommended for Old Crop. Any remaining old crop bushels should be getting priced into this rally. We won’t have any “New Alerts” for 2022 Soybeans (Cash, Calls, or Puts) as we have moved focus onto 2023 and 2024 Crop Year Opportunities. 
  • No action is being recommended for New Crop 2023 soybeans. Changes in weather forecasts and crop conditions will continue to dominate the market. With having just recommended making a cash sale, and with one of the most volatile USDA report days of the year coming this Friday, we would need to see the market rally to 1400 – 1450 area before we would consider recommending any additional sales for the 2023 crop. Otherwise, in light of current crop conditions, we will suggest holding tight on further cash sales for now.
  • Continue to hold off on pricing the 2024 crop. We look to make sales further into the 2023 growing season when selling opportunities tend to improve seasonally. 

  • Soybeans ended significantly higher in the July contract as First Notice Day approaches tomorrow, but deferred contracts only ended slightly higher. Soybean meal closed higher while only July and August soybean oil ended higher.
  • The USDA’s Planted Acreage and Stocks report will be released tomorrow, and analysts are expecting soybean acres to increase slightly, while stocks are estimated to decline.
  • Significant rains are currently moving through central Illinois, but they are accompanied by strong winds in some areas with reports of up to 70 and 80 mph. More rain is in the forecast for Iowa, Illinois, and Indiana over the next 5 days.
  • Weekly export sales were disappointing again with an increase of 8.4 mb for 22/23 and an increase of 0.6 mb for 23/24. Sales were down 28% from the prior 4-year average. Last week’s export shipments of 7.0 mb were below the 11.4 mb needed each week to achieve the USDA’s export estimates.

Above: The market continues to keep its eye on the weather. The August contract rallied in June and tested the 1450 resistance area near the 100 and 200-day moving averages before it slid back. If the market receives additional bullish news and can rally beyond the 1450 area, 1500 – 1550 could be its next target. If not, support could be found between 1340 and 1300 with further support near 1270.

Wheat

Market Notes: Wheat

  • Despite holding in positive territory for much of the day, Chicago wheat posted small losses at the close. The silver lining may be that the market is probing for a bottom at these lower support levels.
  • The USDA reported an increase of 5.7 mb of wheat export sales for 23/24. The USDA is estimating 725 mb of wheat exports for 23/24 and last week’s shipments of 5.8 mb are behind the 14.1 mb pace needed to meet that goal.
  • The US Dollar Index is trending higher today and above the 103 level. Along with poor export data, these factors are likely limiting the upside for wheat futures.
  • Also offering resistance to US wheat is the fact that Canada revised higher their spring wheat seeding to the largest acreage since 2001. Recent rains in the northern US are likely to improve spring wheat conditions as well. Interestingly, Minneapolis wheat was the only US class to post gains today in the face of these negative factors.
  • The US Ag Attaché in Australia is projecting their wheat crop at 29 mmt, down about 10 mmt from last year. The reduction is a result of anticipated drought conditions caused by the El Nino weather pattern.

Chicago Wheat Action Plan Summary

  • No new action is recommended for the 2022 crop. Grain Market Insider is done with the 2022 crop, and there will be no New Alerts posted for the 2022 crop going forward.
  • No new action is recommended for 2023 New Crop. In the month of June, the September Chicago wheat contract posted a 163-cent range and has largely been a follower of the corn market which has been mostly driven by weather. While demand remains weak, production concerns in parts of the country remain, as does uncertainty surrounding the Black Sea region and the potential for major exporting countries’ inventory to hit 16-year lows. While Grain Market Insider will continue to monitor the downside for any violation of major support, following the recent sales recommendation it may be after harvest or near the end of summer before we consider recommending any additional sales for the 2023 crop.
  • No action is currently recommended for 2024 Chicago wheat. Price volatility has risen in the last couple of weeks due to the changing weather forecasts and current events in the Black Sea. While prices have fallen off their recent highs, plenty of time remains to market next year’s crop. War continues in the Black Sea region, major exporting countries’ stocks expected to fall to 16-year lows, and no one knows what the weather will bring, leaving the market vulnerable to many uncertainties. For now, after recently recommending making a sale for the 2024 crop, and while keeping an eye on the market to see if any major support is broken, Grain Market Insider would need to see prices north of 800 before considering recommending any additional sales.  

Above: September wheat rallied nearly 200 cents from the May low to its June high when it encountered heavy resistance and posted a bearish reversal. This technical formation on the price chart is considered bearish and momentum may be adding to the bearish tone. Support below the market may be found between 650 – 610, while resistance above the market rests between 770 – 810.

KC Wheat Action Plan Summary

  • No new action is recommended for the 2022 crop. Though most, if not all, of your Old Crop 2022 wheat may be sold, consider storing any remaining Old Crop, if possible, in anticipation of a short new crop this year, and marketing it along with the new crop.
  • We continue to look for better prices before making any 2023 sales. While Crop ratings have improved and the Black Sea export corridor remains open, questions remain about the size of the HRW crop, whether Russia will continue to agree to keep the Black Sea corridor open, and what production looks like in Europe and Australia. We continue to target 950 – 1000 in the July futures as a potential level to suggest the next round of New Crop sales.
  • Patience is warranted for the 2024 crop. With continued issues in the Black Sea region and with major exporting countries’ stocks expected to fall to 16-year lows, we are willing to be patient with further sales of New Crop HRW wheat. We are targeting just below the 900 level on the upside while keeping an eye on recent lows for any violation of support.

Above: Balancing both production and demand concerns, the September contract continues to trade within the 736 – 919 range established in May. The recent downturn in the market has established heavy resistance above the market between 890 – 920, with initial support coming in between 778 – 763 and key support near the May low of 736.

Mpls Wheat Action Plan Summary

  • No new action for 2022 Old Crop MINNEAPOLIS Wheat.  The market had a nearly 116-cent swing from the May low to the June high and back on weather. While weather and geopolitical events can still affect Old Crop prices, the marketing year for Old Crop is quickly winding down, and any additional upside opportunities may be more difficult to come by before New Crop harvest. Use any remaining bounces in the market to price what Old Crop bushels you may have, if any. We won’t have any “New Alerts” for the 2022 crop (Cash, Calls, or Puts) as we have moved focus onto 2023 and 2024 Crop Year opportunities.
  • There continues to be an opportunity to sell 2023 New Crop MINNEAPOLIS Wheat. Weather dominates the market right now, and friendlier forecasts have pushed prices below the 822 support level. Closing below that 822 support signals that the recent uptrend off the May lows may have ended, which poses the risk that the change in trend could erode the price further in the weeks ahead. The first risk being, price drops to the May low of 771, which is where first support comes in. If that level doesn’t hold, then the next risk could be in the 680-710 window. Although making a sale in a down market may be uncomfortable, it’s important at times to have a Plan B with the objective of trying to avoid having to sell bushels at even lower prices in the future if a downtrend takes hold.
  • We continue to hold on pricing the 2024 crop. With the September ‘24 contract about 60 cents from its May 22 low, continued issues in the Black Sea region and major exporting countries’ stocks expected to fall to 16-year lows, we are entering the time frame where we would consider suggesting making sales recommendations while also keeping an eye on the recent lows for any violation of support. 

Above: The September contract rallied out of its congestion area on the Front Month Continuous chart towards the 200-day moving average and into resistance between 889 and 940, the April and December highs respectively.  With the market trading lower, it will need additional bullish news to turn it back around. Should the market continue to fall, support may be found between 770 and 730. 

Other Charts / Weather

US 7 day precipitation forecast courtesy of NOAA, Weather Prediction Center.

|

Midday Update: June 29, 2023

All prices as of 10:30 am Central Time

Corn
JUL ’23 581 -9
DEC ’23 532.25 -4.5
DEC ’24 512.25 -1.75
Soybeans
JUL ’23 1459 8
NOV ’23 1268.75 3.75
NOV ’24 1210.75 3.25
Chicago Wheat
JUL ’23 658.25 2.5
SEP ’23 673 3.25
JUL ’24 714 1.25
K.C. Wheat
JUL ’23 800.5 -0.25
SEP ’23 808.25 2.5
JUL ’24 785.5 1.75
Mpls Wheat
JUL ’23 811.75 8
SEP ’23 830 11.75
SEP ’24 793.25 -16.75
S&P 500
SEP ’23 4427.25 9.75
Crude Oil
AUG ’23 69.13 -0.43
Gold
AUG ’23 1918.8 -3.4

  • The USDA reported an increase of 5.5 mb of corn export sales for 22/23 and an increase of 4.9 mb for 23/24.
  • Weather still appears to be the main driver of the grain complex. Rain is forecasted for some of the drier areas of the central Midwest. However, grain markets are mixed at midday, suggesting that they are finding some support at these lower levels.  
  • Yesterday’s announced purchase of US corn by Mexico is supportive but does once again bring up the question of their impending GMO ban on imports down the road.
  • A South Korean feed company is tendering for 130,000 mt of feed corn. Given the discount of South American exports vs US, as well as grain still flowing out of the Black Sea, it is unlikely to be sourced from here.

  • The USDA reported an increase of 8.4 mb of soybean export sales for 22/23 and an increase of 0.6 mb for 23/24.
  • Soybean meal and oil are slightly higher at midday, which may be keeping soybean futures afloat. The Malaysian palm oil futures market is on holiday so there is no influence on US markets currently.
  • Reportedly, South American soybean meal offers dropped $18 per ton, compared with the previous day. This is sure to keep pressure on the US export market, which is still not performing well.
  • Right now, bulls and bears are battling between poor crop ratings, vs rain in the forecast and poor exports. Tomorrow’s reports could help provide some direction – the stocks number will likely be more of a factor and there is some anticipation that June 1 soybean stocks will be tighter than expected.  

  • The USDA reported an increase of 5.7 mb of wheat export sales for 23/24.
  • US wheat futures appear to be probing for a bottom this morning. Some support may be coming from higher Matif wheat futures, which have a gap above the market that may yet be filled.
  • Offering resistance to US wheat is the fact that Canda revised their spring wheat seeding higher, to the largest acreage since 2001.
  • The US Ag Attaché in Australia is estimating their wheat crop at 29 mmt. That is a reduction of about 10 mmt from last year in anticipation of the El Nino drought conditions.

Grain Market Insider is provided by Stewart-Peterson Inc., a publishing company.

Futures and options trading involve significant risk of loss and may not be suitable for everyone. Therefore, carefully consider whether such trading is suitable for you in light of your financial condition. The data contained herein is believed to be drawn from reliable sources but cannot be guaranteed. This material has been prepared by a sales or trading employee or agent of Total Farm Marketing by Stewart-Peterson and is, or is in the nature of, a solicitation. Any decisions you may make to buy, sell or hold a futures or options position on such research are entirely your own and not in any way deemed to be endorsed by or attributed to Stewart-Peterson Inc. Reproduction of this information without prior written permission is prohibited. Hypothetical performance results have many inherent limitations. No representation is being made that any account will or is likely to achieve profits or losses similar to those shown. The data contained herein is believed to be drawn from reliable sources but cannot be guaranteed. Reproduction and distribution of this information without prior written permission is prohibited. This material has been prepared by a sales or trading employee or agent of Total Farm Marketing and is, or is in the nature of, a solicitation. Any decisions you may make to buy, sell or hold a position on such research are entirely your own and not in any way deemed to be endorsed by or attributed to Total Farm Marketing.

Stewart-Peterson Inc., Stewart-Peterson Group Inc., and SP Risk Services LLC are each part of the family of companies within Total Farm Marketing (TFM). Stewart-Peterson Inc. is a publishing company. Stewart-Peterson Group Inc. is registered with the Commodity Futures Trading Commission (CFTC) as an introducing broker and is a member of National Futures Association. SP Risk Services LLC is an insurance agency. A customer may have relationships with any or all three companies. 

|

Opening Update: June 29, 2023

All prices as of 6:30 am Central Time

Corn
JUL ’23 594.5 4.5
DEC ’23 536.5 -0.25
DEC ’24 513.5 -0.5
Soybeans
JUL ’23 1450.75 -0.25
NOV ’23 1263.25 -1.75
NOV ’24 1204 -3.5
Chicago Wheat
JUL ’23 656 0.25
SEP ’23 669.25 -0.5
JUL ’24 712.75 0
K.C. Wheat
JUL ’23 802.75 2
SEP ’23 806.25 0.5
JUL ’24 785 1.25
Mpls Wheat
JUL ’23 808.75 5
SEP ’23 820.25 2
SEP ’24 793.25 -16.75
S&P 500
SEP ’23 4430.75 13.25
Crude Oil
AUG ’23 69.87 0.31
Gold
AUG ’23 1917.8 -4.4

  • Corn is trading relatively unchanged this morning after two days of sharp selloffs. July is slightly higher while deferred contracts are about a cent lower.
  • Yesterday, a front moved through Iowa, Missouri, and Illinois, but 24-hour precipitation totals showed that most areas received about 1/4 inch.
  • There is still significant rain in the 5-day forecast with large amounts expected in the parts of Illinois that are the driest.
  • US ethanol stocks rose by 0.8% to 22.979 mln bbl with analysts having expected 22.755 mln bbl.

  • Soybeans are trading slightly lower with losses in soybean meal but gains in July and Aug soybean oil. Yesterday’s rain was beneficial, but the important weather is still ahead.
  • Brazilian soy exports have reached up to 14.2 mmt in June compared to the 14.3 mmt forecast the previous week as the world looks to Brazil for soybeans.
  • Brazil’s crop is now expected to reach a record breaking 156 mmt of soybeans harvested, far above the initial analyst guesses earlier this year.
  • Friday morning’s acreage report is expected to show soybean acres up slightly from May intentions with average trade guesses at 87.67 ma, up from the previous estimate.

  • Wheat is mixed this morning with Chicago and KC slightly lower but Minn around 3 cents higher as the market trades quietly ahead of Friday’s planted acreage report.
  • Friday’s USDA stocks report is expected to show June 1 wheat stocks down near 335 mb vs 611 mb a year ago.
  • Despite support from the anticipated end of the Black Sea grain deal next month, Ukraine is now expected to raise a wheat crop as high as 24.4 mmt compared to estimates ranging between 16 to 18 mmt.
  • Canadian wheat planting was only slightly lower than previously expected at 26.9 million acres with canola at 22.1.

Grain Market Insider is provided by Stewart-Peterson Inc., a publishing company.

Futures and options trading involve significant risk of loss and may not be suitable for everyone. Therefore, carefully consider whether such trading is suitable for you in light of your financial condition. The data contained herein is believed to be drawn from reliable sources but cannot be guaranteed. This material has been prepared by a sales or trading employee or agent of Total Farm Marketing by Stewart-Peterson and is, or is in the nature of, a solicitation. Any decisions you may make to buy, sell or hold a futures or options position on such research are entirely your own and not in any way deemed to be endorsed by or attributed to Stewart-Peterson Inc. Reproduction of this information without prior written permission is prohibited. Hypothetical performance results have many inherent limitations. No representation is being made that any account will or is likely to achieve profits or losses similar to those shown. The data contained herein is believed to be drawn from reliable sources but cannot be guaranteed. Reproduction and distribution of this information without prior written permission is prohibited. This material has been prepared by a sales or trading employee or agent of Total Farm Marketing and is, or is in the nature of, a solicitation. Any decisions you may make to buy, sell or hold a position on such research are entirely your own and not in any way deemed to be endorsed by or attributed to Total Farm Marketing.

Stewart-Peterson Inc., Stewart-Peterson Group Inc., and SP Risk Services LLC are each part of the family of companies within Total Farm Marketing (TFM). Stewart-Peterson Inc. is a publishing company. Stewart-Peterson Group Inc. is registered with the Commodity Futures Trading Commission (CFTC) as an introducing broker and is a member of National Futures Association. SP Risk Services LLC is an insurance agency. A customer may have relationships with any or all three companies.