The CME and Total Farm Marketing offices will be closed Monday, September 4, in observance of Labor Day
All prices as of 10:30 am Central Time
Corn
SEP ’23
465
3.25
DEC ’23
483.25
2.5
DEC ’24
510.75
0.75
Soybeans
NOV ’23
1381
-5.75
JAN ’24
1393.75
-6
NOV ’24
1304.5
-6
Chicago Wheat
SEP ’23
582
5.25
DEC ’23
609
2
JUL ’24
662.5
3.5
K.C. Wheat
SEP ’23
727
7.75
DEC ’23
729.25
-2.5
JUL ’24
728
-4
Mpls Wheat
SEP ’23
741.5
-7.25
DEC ’23
771.5
-8
SEP ’24
795.75
-7
S&P 500
SEP ’23
4529.75
5.5
Crude Oil
OCT ’23
82.53
0.9
Gold
OCT ’23
1950.1
-3.9
Corn is trading slightly higher after opening lower last night as trade remains quiet, but the hot and dry weather forecast may be giving prices some support.
Corn export sales for 22/23 were 71,700 mt which was down 39% from the prior 4-week average. Sales for 23/24 were 991,800 mt, and exports were 663,400 mt, which was up 34% from the previous week.
Temperatures in the Corn Belt are expected to reach the 90’s and 100’s with virtually no rain expected which could cause the crop to mature too quickly.
The EIA reported yesterday that ethanol production in the US fell by 5.2% last week, but inventory was down 50 million gallons due to increased gasoline demand.
Soybeans are trading lower at midday with soybean meal lower as well, but soybean oil higher with support from higher crude oil.
Export sales were good overall despite net sales reductions for 22/23 of 50,700 mt which was a marketing year low. For 23/24, sales were 1,123,800 mt and were primarily to unknown destinations and China. Exports of 319,700 mt were down 29% from the previous week.
Some crop scouts and analysts are expecting yields for the soybean crop to fall below 50 bpa which would be down 2 bpa from current USDA projections.
In India, record low levels of rain are being reported which may require larger imports of vegetable oils for the month of August.
Wheat began the day lower but has recovered and is now trading higher in Chicago wheat while KC is unchanged, and Minneapolis is lower.
There were significant deliveries against the September wheat contracts with 1,113 contracts of Chicago wheat delivered, which was more than expected, 168 contracts against KC, and very few commercial takers of the deliveries.
Egypt’s GASC tendered yesterday for wheat and ended up buying 120,000 mt of French and 120,000 mt of Romanian wheat, and both were offered more cheaply than Russian wheat.
The consultant firm IKAR raised their estimate for Russian wheat production to 91 mmt and are projecting wheat exports there to be 49.5 mmt.
Grain Market Insider is provided by Stewart-Peterson Inc., a publishing company.
Futures and options trading involve significant risk of loss and may not be suitable for everyone. Therefore, carefully consider whether such trading is suitable for you in light of your financial condition. The data contained herein is believed to be drawn from reliable sources but cannot be guaranteed. This material has been prepared by a sales or trading employee or agent of Total Farm Marketing by Stewart-Peterson and is, or is in the nature of, a solicitation. Any decisions you may make to buy, sell or hold a futures or options position on such research are entirely your own and not in any way deemed to be endorsed by or attributed to Stewart-Peterson Inc. Reproduction of this information without prior written permission is prohibited. Hypothetical performance results have many inherent limitations. No representation is being made that any account will or is likely to achieve profits or losses similar to those shown. The data contained herein is believed to be drawn from reliable sources but cannot be guaranteed. Reproduction and distribution of this information without prior written permission is prohibited. This material has been prepared by a sales or trading employee or agent of Total Farm Marketing and is, or is in the nature of, a solicitation. Any decisions you may make to buy, sell or hold a position on such research are entirely your own and not in any way deemed to be endorsed by or attributed to Total Farm Marketing.
Stewart-Peterson Inc., Stewart-Peterson Group Inc., and SP Risk Services LLC are each part of the family of companies within Total Farm Marketing (TFM). Stewart-Peterson Inc. is a publishing company. Stewart-Peterson Group Inc. is registered with the Commodity Futures Trading Commission (CFTC) as an introducing broker and is a member of National Futures Association. SP Risk Services LLC is an insurance agency. A customer may have relationships with any or all three companies.
Markets are treading quietly this morning with corn up only a penny as technical trade is bearish and weather bullish.
This weekend, hot temperatures are expected to return with virtually no rainfall in the forecast. Minnesota and Iowa have better rain chances over the next 7 days,
The weather conditions may be causing the crop to mature too rapidly with many producers seeing ears drop already.
US ethanol stocks fell by 5% to 21.609 million barrels and analysts had been expecting 22.599 mln bbl.
Soybeans are unchanged this morning while soybean meal is lower and soybean oil higher.
The 14 dollar level remains significant resistance for November soybeans as producers have been more willing to sell at that level.
Today’s export sales report should show a large increase in commitments to China or unknown destinations after the recent string of sales.
South American soybean meal was offered as much as 9 dollars a ton lower yesterday with the market under pressure as trade anticipates an expansion of US soybean plantings.
Wheat is trading lower this morning with a new contract low in Dec Chicago wheat and KC wheat with a new yearly low.
SRW values are now approaching parity with other world exporters which could finally see US exports begin to pick up.
Russia has said they would talk to Turkey about an alternative to renewing the grain deal where they would sell grain to Turkey at a discounted price with financial support from Qatar.
Wheat production in Canada is expected to be 14.2% lower than last year’s crop, according to estimates released Tuesday by Statistics Canada on its website.
Grain Market Insider is provided by Stewart-Peterson Inc., a publishing company.
Futures and options trading involve significant risk of loss and may not be suitable for everyone. Therefore, carefully consider whether such trading is suitable for you in light of your financial condition. The data contained herein is believed to be drawn from reliable sources but cannot be guaranteed. This material has been prepared by a sales or trading employee or agent of Total Farm Marketing by Stewart-Peterson and is, or is in the nature of, a solicitation. Any decisions you may make to buy, sell or hold a futures or options position on such research are entirely your own and not in any way deemed to be endorsed by or attributed to Stewart-Peterson Inc. Reproduction of this information without prior written permission is prohibited. Hypothetical performance results have many inherent limitations. No representation is being made that any account will or is likely to achieve profits or losses similar to those shown. The data contained herein is believed to be drawn from reliable sources but cannot be guaranteed. Reproduction and distribution of this information without prior written permission is prohibited. This material has been prepared by a sales or trading employee or agent of Total Farm Marketing and is, or is in the nature of, a solicitation. Any decisions you may make to buy, sell or hold a position on such research are entirely your own and not in any way deemed to be endorsed by or attributed to Total Farm Marketing.
Stewart-Peterson Inc., Stewart-Peterson Group Inc., and SP Risk Services LLC are each part of the family of companies within Total Farm Marketing (TFM). Stewart-Peterson Inc. is a publishing company. Stewart-Peterson Group Inc. is registered with the Commodity Futures Trading Commission (CFTC) as an introducing broker and is a member of National Futures Association. SP Risk Services LLC is an insurance agency. A customer may have relationships with any or all three companies.
The EIA reported ethanol production numbers today that were the lowest in 3 months and added to the technical weakness potential influence of first notice day in the corn market, as prices turned south early in the session giving up the gains made overnight.
After briefly trading above $14 in the overnight session, and despite another flash sale to unknown destinations, November soybeans turned sellers on the opening bell, and traded lower throughout the day to fill a gap left at 1390-1/2 and close 6 cents off the day’s low.
While both soybean meal and oil posted losses alongside soybeans, domestic demand for soybeans should remain strong with cash crush margins reportedly in excess of $3/bu.
The wheat complex ended the day mixed with Chicago and nearby KC contracts closing higher, and deferred KC contracts and Minneapolis lower, as estimates of the Canadian wheat crop by StatsCan came in 14.2% below last year, and the US State Deptartment reportedly continues to work with Ukraine and Romania to increase exports via the Danube River.
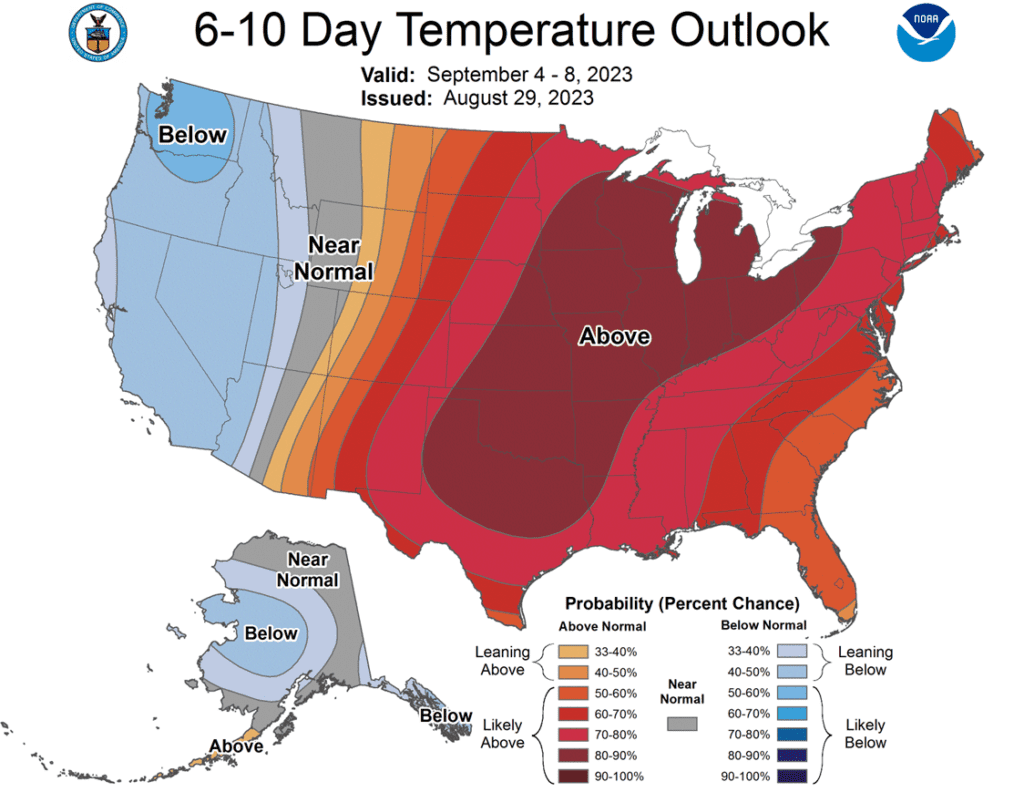
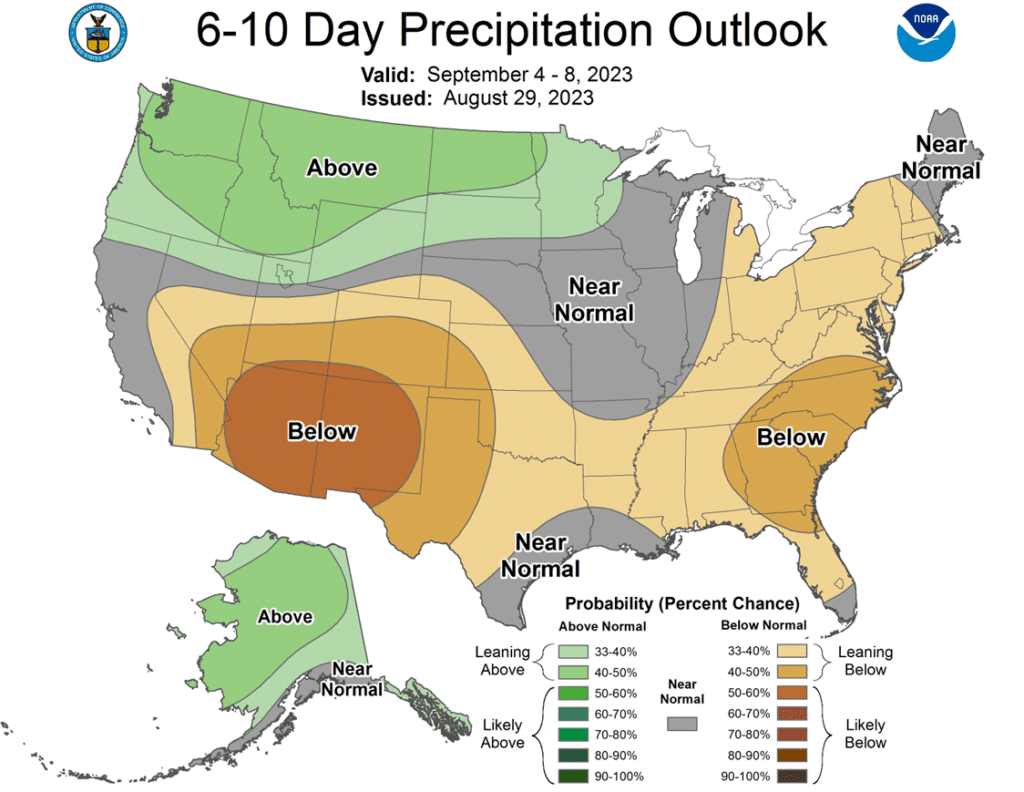
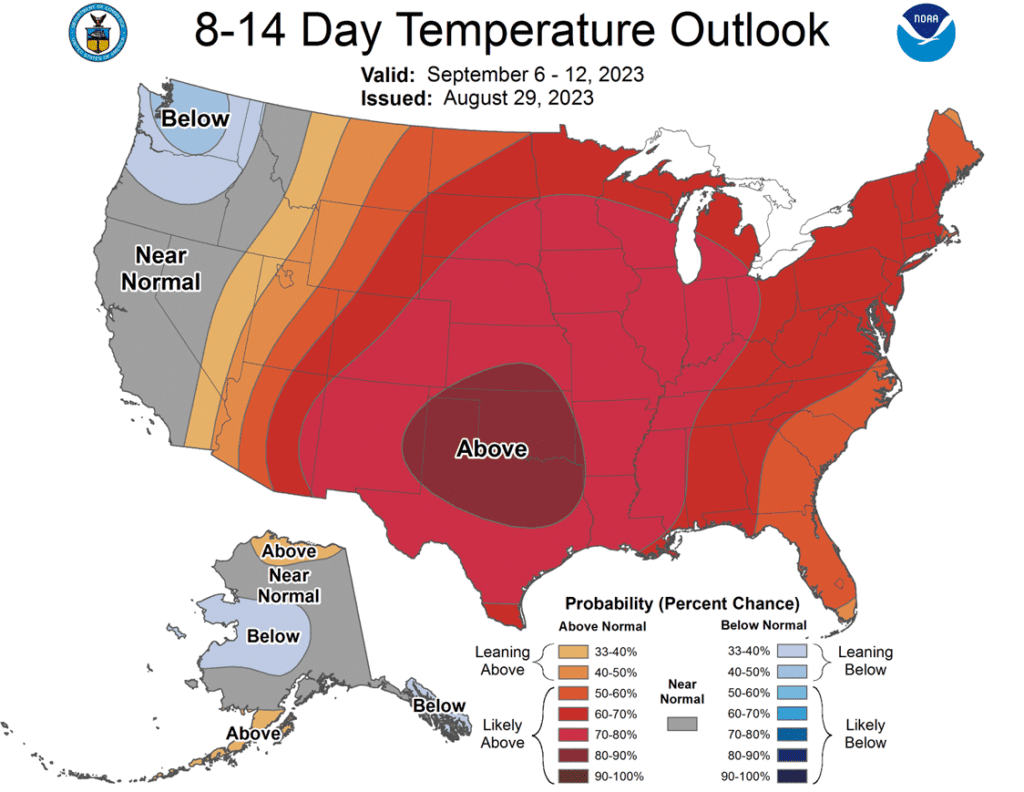
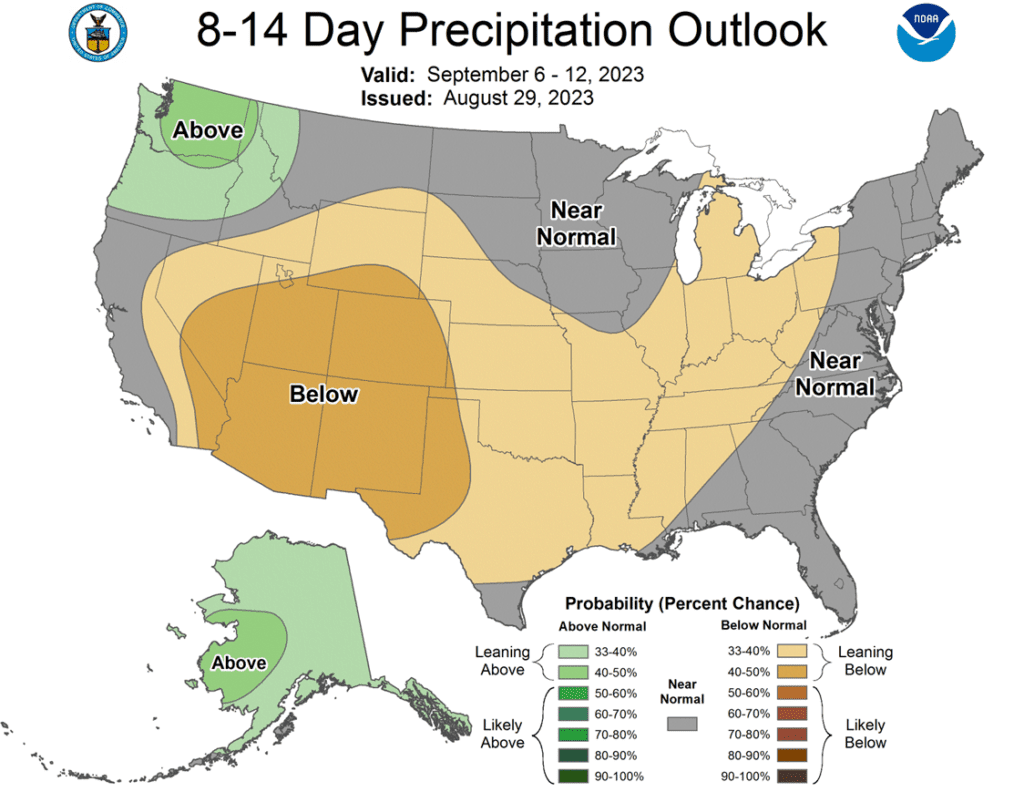
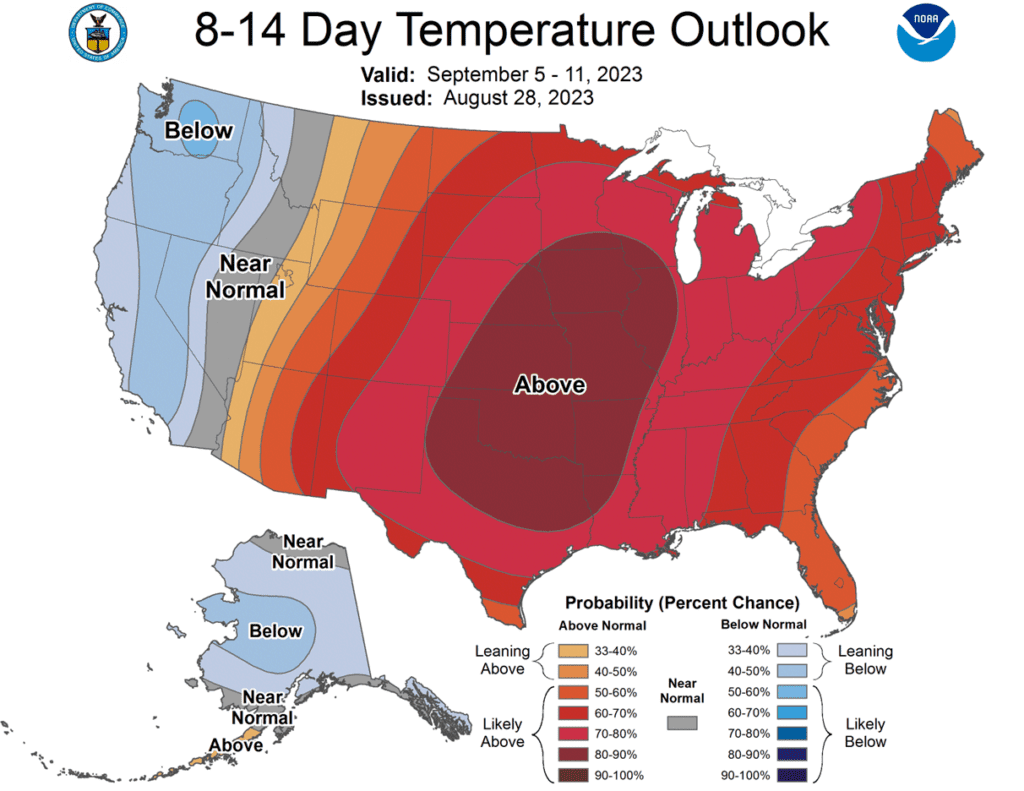
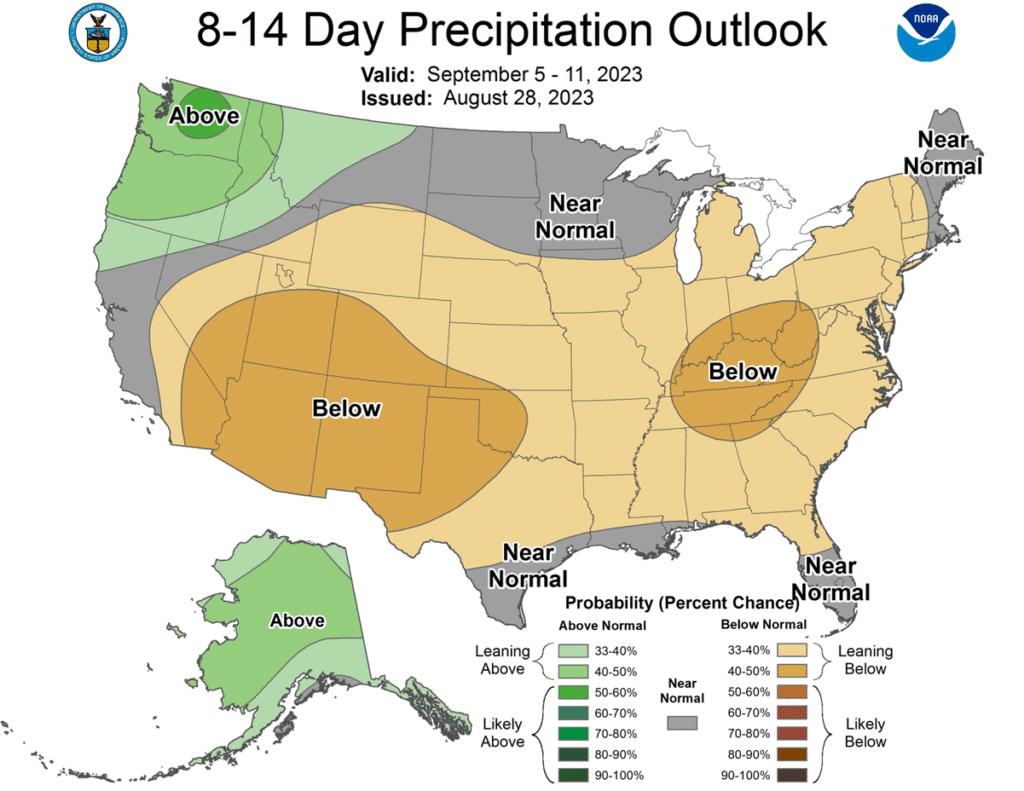
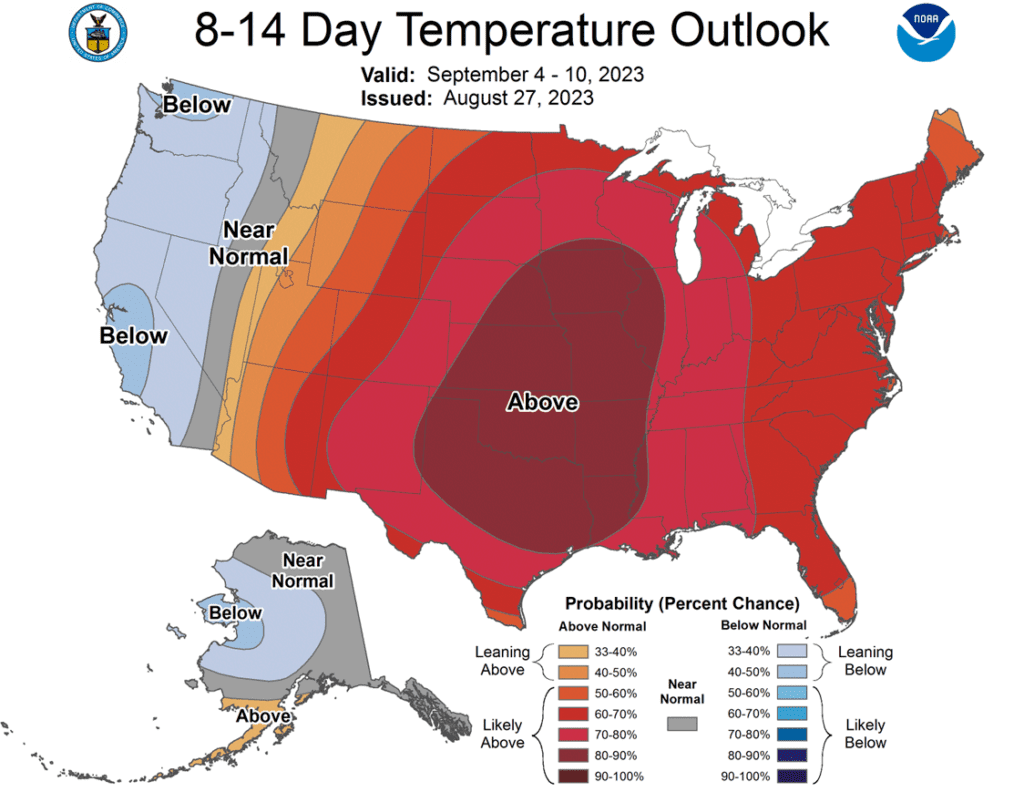
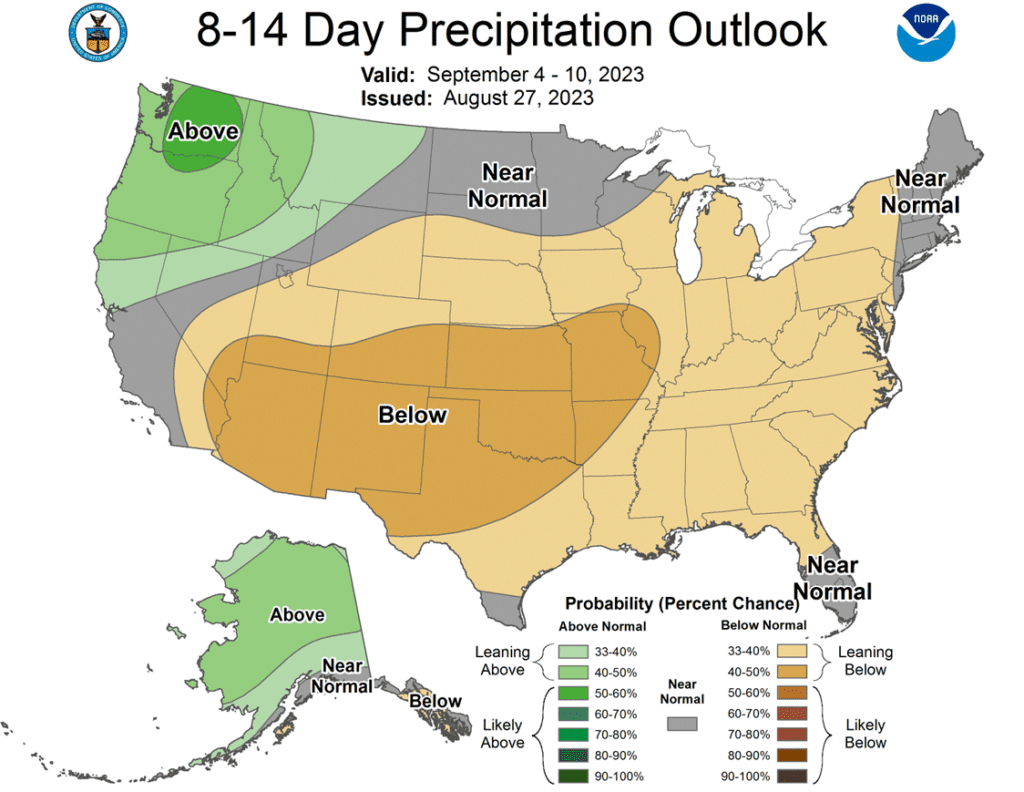
To see the current US 6 – 10 and 8 – 14 day Temperature and Precipitation Outlooks from NOAA, scroll down to the other Charts/Weather Section.
Note – For the best viewing experience, some Grain Market Insider content is best viewed with your phone held horizontally.
Corn
Corn Action Plan Summary
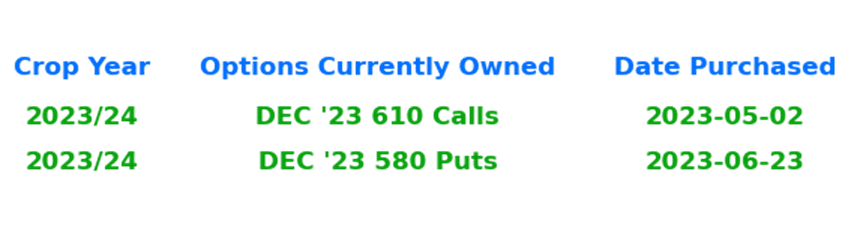
No action is recommended for the 2023 corn crop. This year’s growing season has been marked by dry conditions and changing weather forecasts, which have swung prices nearly 150 cents from high to low. Though dry conditions remain, with a great amount of variability in crop conditions from region to region, it may not be until after harvest before we know the full effect this growing season had on yields. Just as Insider recently recommended selling half of the previously recommended DEC 580 puts to lock in gains in case the market turns higher, Insider will continue to monitor market conditions and may consider recommending selling the remaining DEC 580 puts if conditions warrant it. While many unknowns could still shock the market higher, seasonality and current trends suggest we may not see a shift to higher prices until after harvest.
No action is currently recommended for 2024 corn.In 2012, the best pricing opportunities for Dec 2013 corn were during the 2012 summer runup. Despite the significant yield losses to the 2012 crop, and the fear of running out of corn, the Dec 2013 contract peaked in the summer of 2012, and by Jan 2 of 2013, the price was already down about 12% from the high. We continue to watch the calendar for 2024 corn as this 2023 summer volatility could provide some additional opportunities to get some good early sales on the books in the event of a 2013 type repeat. Insider recently recommended making a sale on your 2024 crop, and we’ll be watching for another opportunity to suggest adding to prior early sales levels between now and the beginning of September.
No Action is currently recommended for 2025 corn.2025 markets are very illiquid right now, and it may be some time before conditions are conducive to consider making any recommendations. Be patient as we monitor the markets for signs of improvement.
Selling pressure weighed on the corn market as the influence of first notice day for September futures and technical weakness saw liquidation. September corn posted a new low for the moves, and December futures lost 6 cents on the session.
September futures are at “First Notice Day” tomorrow, and long positions need to be liquidated or risk the chance of delivery against the futures. This typically can bring additional volatility into the market. Expectations are for deliveries against September futures to be limited.
Brazilian export shipments for the marketing year are running ahead of pace, keeping pressure on US corn prices. The target for corn exports in Brazil is 50mmt this marketing year, but that total may need to be adjusted higher if the export pace remains strong.
The USDA will release weekly export sales on Thursday morning. Expectations for corn are –150,000 mt – 150,000 mt for old crop and 400,000 – 1.1 mmt for new crop sales. The old crop marketing year ends on Thursday, August 31.
As harvest moves closer, basis levels could be under pressure as end users become more comfortable with front-end supplies, as well as receiving freshly harvested corn. The National Average Corn basis has trended lower in recent weeks. The possibly softer cash market tone will likely weigh on futures prices.
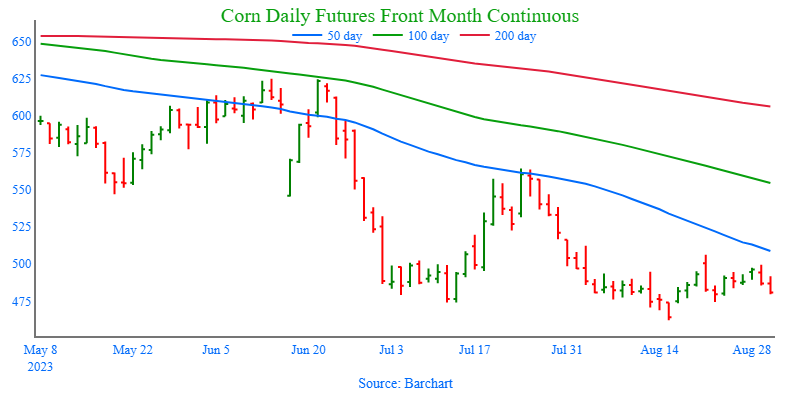
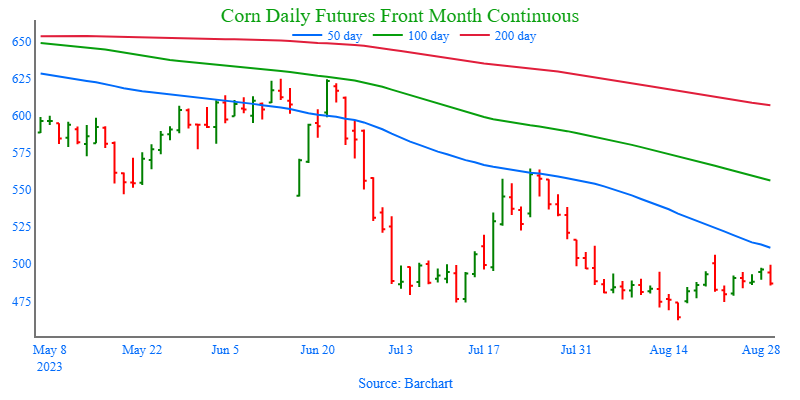
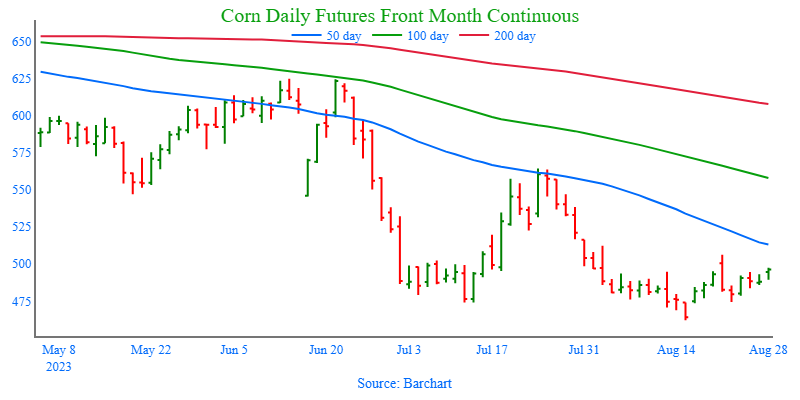
Above: After trading mostly sideways since the end of July, December corn posted a bearish reversal on 8/21 after testing the 495 – 516 resistance level. While the reversal is a bearish development, prices could turn higher if the market receives additional bullish input. Should that happen, resistance above the market remains between 495 – 516. If not and prices turn lower, support may be found near 460 and again near 415.
Soybeans
Soybeans Action Plan Summary
No action is recommended for 2023 soybeans.This season the market has experienced a lot of volatility, not only from USDA reports but also from the changing weather forecasts, crop conditions, and export sales. We ended the month of July experiencing hot conditions with little rainfall and weak export sales. Since then, conditions have become more favorable, and export sales have picked up. While much of the crop remains in drought conditions, which can maintain upside potential, timely rains may come and push prices lower. Much like in 2012, when July was dry, and the pattern changed in August, when decent rain fell in parts of the western Corn Belt and IL, sending Nov ’12 soybeans down 20%. For now, Insider may not consider suggesting any additional sales until after harvest. Although, we will continue to monitor the market for any upside opportunities in the coming weeks.
No action is recommended for 2024 crop. Grain Market Insider continues to monitor any developments for the 2024 crop, though it may not be until after harvest or toward year’s end before we will consider recommending any 2024 crop sales.
No Action is currently recommended for 2025 Soybeans. 2025 markets are very illiquid right now, and it may be some time before conditions are conducive to consider making any recommendations. Be patient as we monitor the markets for signs of improvement.
Soybeans ended the day lower despite a higher open. Soybean meal and oil both closed lower as well despite hot and dry forecasts and another good-sized export sale this morning. November soybeans are technically overbought and may need fresh bullish news to keep momentum moving higher.
This morning, the USDA reported a sale of 10.0 mb of new crop soybeans to unknown destinations which comes after a string of recent export sales. The US has become more competitive with Brazilian soybean offers for new crop which has resulted in improved sales.
Soybean crush demand has been firm as crush margins improve significantly. Based on October futures, one bushel of 14-dollar soybeans can be crushed into $17.35 worth of soybean meal and oil.
A Farm Futures magazine survey of US planting intentions for 2024 found that growers expect to reduce plantings of corn in the coming year while increasing soybean acres. Soybean plantings were seen at 85.402 billion acres which is up from 2.3% from the USDA’s 2023 estimate.
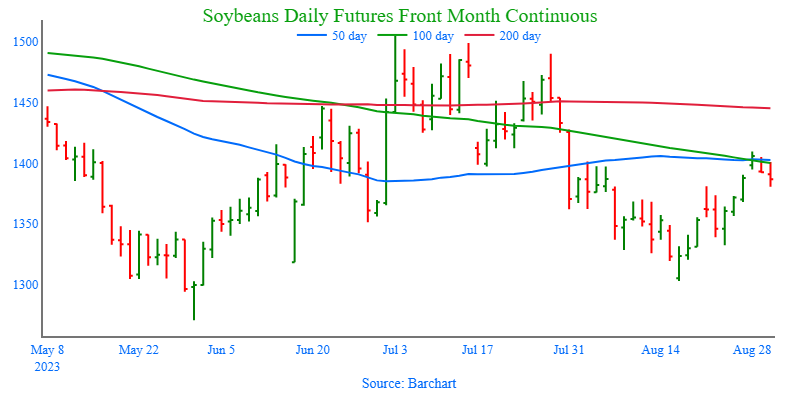
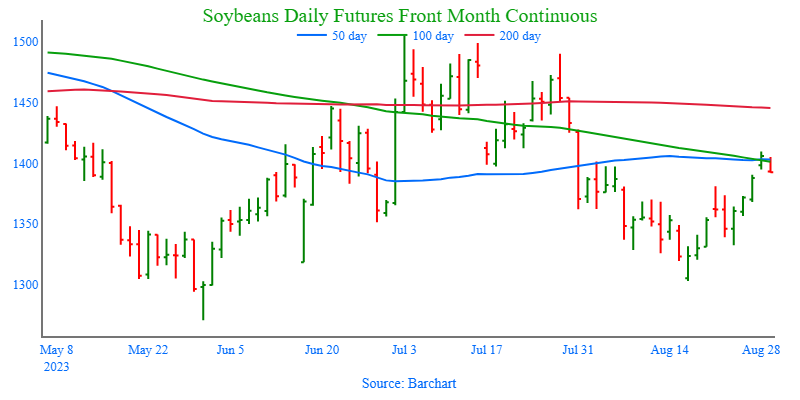
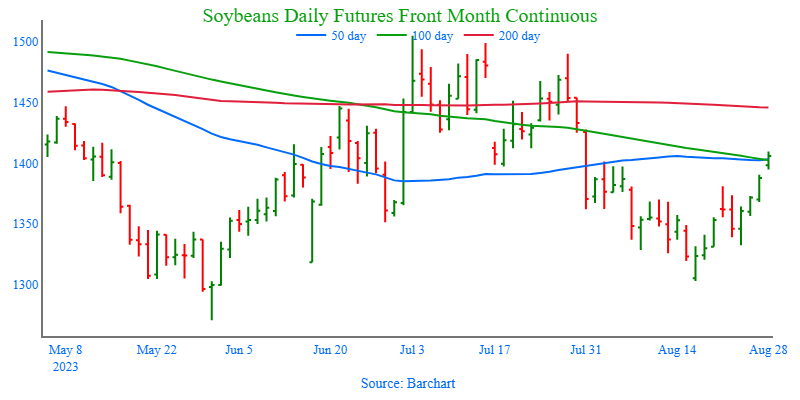
Above: On August 28 the market gapped higher and closed above the 1381 – 1401 resistance area, which may now become support. Though supportive, markets tend to fill gaps over time, and it may be drawn to fill the gap left between 1390-1/2 and 1394-3/4. For now, the next resistance level could be near 1450 and the 200-day moving average. If the market turns lower and trades through 1381 – 1401 support, further support could be found near 1330.
Wheat
Market Notes: Wheat
StatsCan released its estimate for Canada’s 2023 wheat production, and it came in at 29.5 mmt, 0.8 mmt lower than the 30.3 mmt expected by analysts. This year’s production is 14.2% lower than last year.
There are also reports that the US State Department is still working with Romania and Ukraine to increase ag exports via the Danube River.
Russian officials have stated without details, that Putin plans on meeting with Turkish President Erdogan. Russia has already offered to supply the country with 1 mmt of grain to be distributed to needy countries as an alternative to the Black Sea grain deal.
Fighting between Russia and Ukraine continues to escalate with reports of several Ukrainian drone attacks deep into Russian territory that damaged 4 large transport planes.
While US wheat is expecting its second lowest ending stocks-to-use ratio in 10 years, the lack of export demand continues to weigh on prices.
Chicago Wheat Action Plan Summary
No new action is recommended for 2023 crop. Since the end of May, the wheat market has been largely rangebound, influenced by weak demand, changing headlines from the Black Sea region, and the corn market with its own demand and weather concerns. With harvest in the rearview mirror, U.S. production has been better than expected and demand remains weak. Still, many supply questions remain unanswered from the Black Sea region, which could push prices in either direction. While Insider will continue to monitor the downside for any breach of major support, we would need to see prices pushed toward the 800 level before considering any additional sales.
Grain Market Insider recommendsBuying July ’24 590 Chicago Wheat Puts on a portion of your 2024 SRW Wheat crop for approximately 30 cents plus commission and fees. While weather has been a dominant feature of the market this year with dry growing conditions and harvest delays, slow export demand and cheap Russian exports remain major headwinds to prices. The market has turned lower in recent weeks and July Chicago Wheat broke through a major support area around 657. Closing below 657 support signals that the major trend may be turning down and poses the risk that prices could erode further in the weeks ahead, possibly to the next level of support, the May low of 573. If the 573 level fails, the next support could be the 468 – 514 level. Buying July ’24 590 Chicago Wheat puts on a portion of your SRW production should help protect future sales from further downside erosion, while still allowing for upside appreciation should the market turn higher.
No Action is currently recommended for 2025 Chicago Wheat. 2025 markets are very illiquid right now, and it may be some time before conditions are conducive to consider making any recommendations. Be patient as we monitor the markets for signs of improvement.
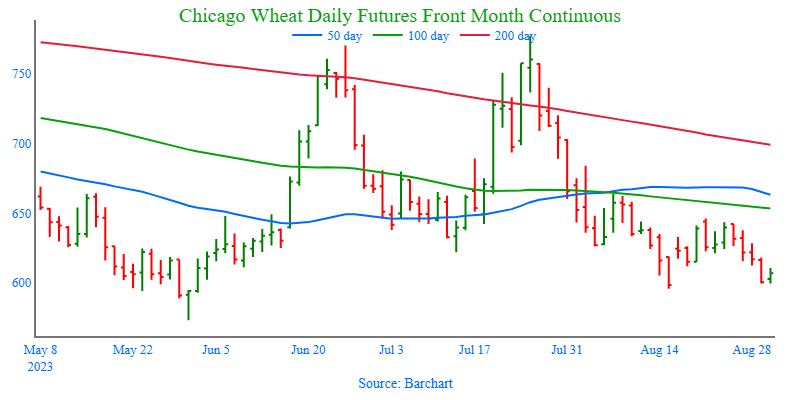
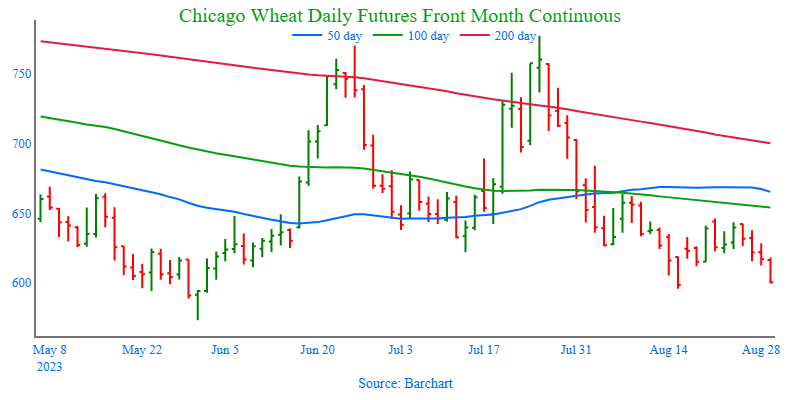
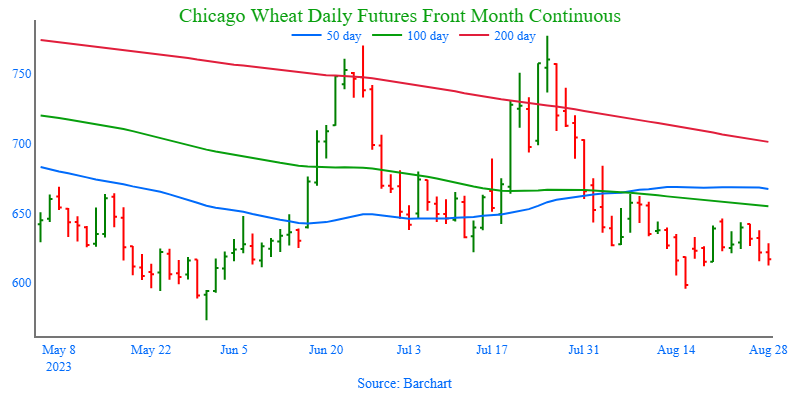
Above: The Chicago wheat market appears to be consolidating between 650 and 596. If the market breaks out to the upside, the next level of resistance may be found near 665, if not, and the market drifts lower, the next level of support below the market may be found near 573.
KC Wheat Action Plan Summary
We continue to look for better prices before making any 2023 sales. As more becomes known about this year’s crop with some reports of better than expected yields, questions remain about the world wheat supply. War continues in the Black Sea region, Ukraine’s export capabilities remain uncertain, and dryness continues in key production areas of the world. With a world stocks-to-use ratio at its lowest level in 8 years, we continue to target 950 – 1000 in the July futures as a potential level to suggest the next round of New Crop sales. At the same time, we continue to watch the bottom end of the range that prices have traded in since late 2022. A close below the bottom end would reduce the probability of getting to 950 – 1000 and would increase the risk of prices falling into the 600 – 650 range.
No Action is currently recommended for 2025 KC Wheat. 2025 markets are very illiquid right now, and it may be some time before conditions are conducive to consider making any recommendations. Be patient as we monitor the markets for signs of improvement.
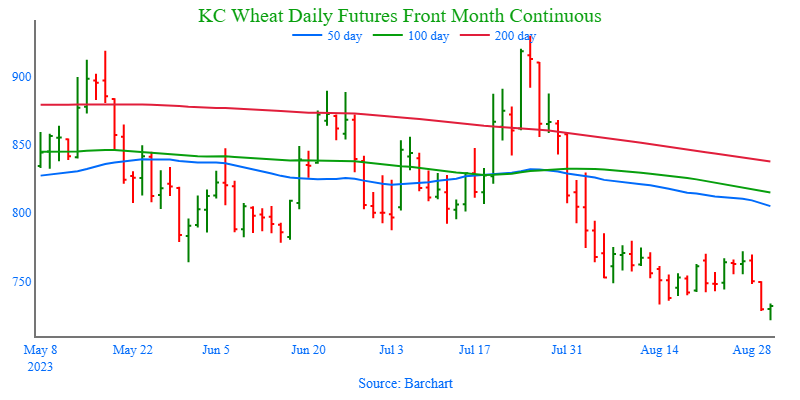
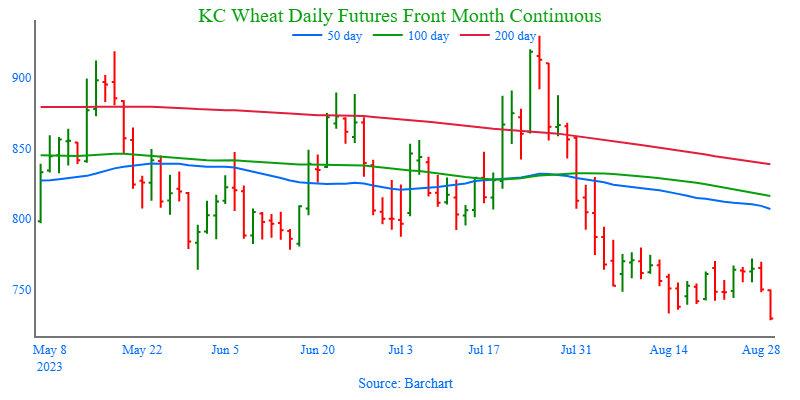
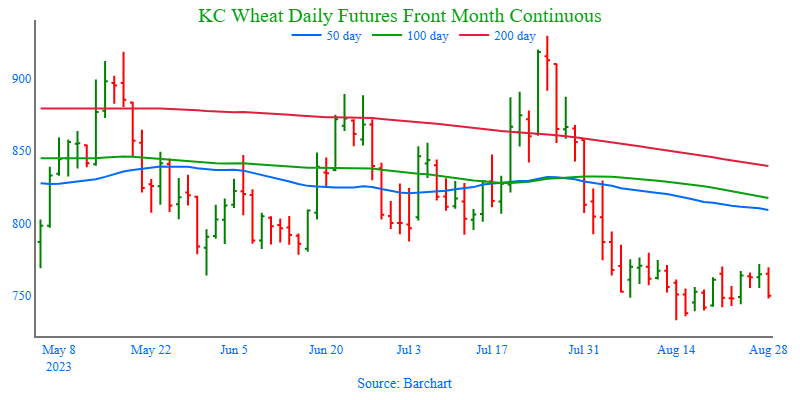
Above: December KC wheat broke through the bottom end of its trading range and may be poised to test the September ’21 low of 670 unless bullish input enters the market to turn prices higher. If so, initial resistance above the market may rest near 772 – 780.
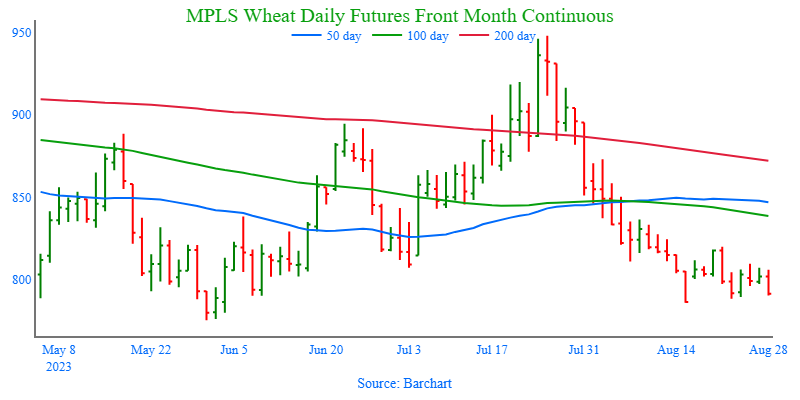
Mpls Wheat Action Plan Summary
No action is currently recommended for the 2023 New Crop. Weather has been a dominant feature to price volatility this growing season, with continued dryness concerns in not only the US, but also Canada and Australia. While there typically isn’t a strong likelihood of higher prices until after harvest is complete, both weather and geopolitical events can change suddenly to move prices higher. Insider will consider making sales suggestions if prices improve, while also continuing to watch the downside for any further violations of support.
No action is currently recommended for 2024 Minneapolis wheat. This year has been dominated by production concerns regarding the 2023 crop, and considering slow export demand and cheap Russian prices continue to be major headwinds for prices. Insider recently recommended buying July ’24 puts to protect unsold grain if prices continue to retreat further. While war persists in the Black Sea region, production concerns continue in the southern hemisphere due to El Nino, and the world stocks-to-use ratio remains at an 8-year low, there are still many uncertainties that could shock prices higher. For now, plenty of time remains to market the 2024 crop and Insider is content to see how the market develops before suggesting making any additional sales. After recommending buying July ’24 K.C. wheat 660 puts for the liquidity and high correlation to Minneapolis wheat’s price movements, unsold bushels will be protected if prices make new lows, and if prices turn around and rally higher, Insider will be looking for opportunities to consider recommending additional sales.
No Action is currently recommended for the 2025 Minneapolis wheat crop. 2025 markets are very illiquid right now, and it may be some time before conditions are conducive to consider making any recommendations. Be patient as we monitor the markets for signs of improvement.
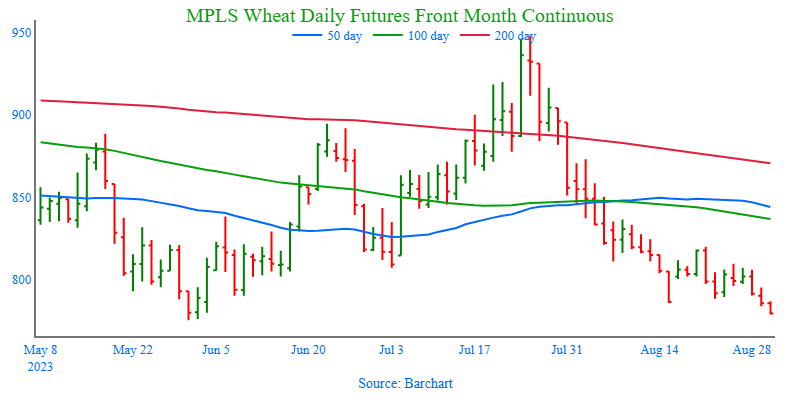
Above: The December contract recently broke out of the recent range to the downside. With recent support broken, the market could slide further to test the May low of 769. Next support below 769 could come in near the June ’21 low of 730. Above the market, the next area of resistance could be found near 810 – 820.
Corn began the morning trading higher but has slipped and is now lower despite a hot and dry forecast expected to last over the next 14 days.
There are concerns that water levels on the Mississippi River will be low again this year which would impact barge traffic and shipping.
Rains continue to fall in Brazil which is keeping the harvest pace slow but also may create an early planting possibility in September.
Brazilian corn exports in the month of August are expected to reach 9.19 million tons versus 6.89 million tons in the same month a year ago.
Soybeans also began the day on a higher note but have moved lower and have now filled the gap left over the weekend. Soybean meal is lower along with soybean oil front months, while deferred soybean oil contracts are higher.
The 14-day forecast which is hot and dry would be expected to offer support, but prices seem to be running into some resistance at the 14-dollar level in November.
This morning, the USDA reported a sale of 10.0 mb of new crop soybeans to unknown destinations which comes after a string of recent export sales.
Crush demand has been firm as margins increase with one bushel of 14-dollar soybeans reportedly able to be crushed into 17.35 worth of soybean meal and oil.
Wheat is mixed with Chicago trading higher but KC and Minn contracts lower as prices struggle to find support despite tight ending stocks.
Both US and HRW wheat are expecting their second-lowest ending stocks-to-use ratios in 10 years, but the lack of export demand is weighing on prices.
Wheat production in Canada is expected to be 14.2% lower than last year’s crop, according to estimates released Tuesday by Statistics Canada on its website.
Fighting escalated between Russia and Ukraine again last night after Ukraine fired several drones into Russia and reportedly destroyed some Russian military planes.
Grain Market Insider is provided by Stewart-Peterson Inc., a publishing company.
Futures and options trading involve significant risk of loss and may not be suitable for everyone. Therefore, carefully consider whether such trading is suitable for you in light of your financial condition. The data contained herein is believed to be drawn from reliable sources but cannot be guaranteed. This material has been prepared by a sales or trading employee or agent of Total Farm Marketing by Stewart-Peterson and is, or is in the nature of, a solicitation. Any decisions you may make to buy, sell or hold a futures or options position on such research are entirely your own and not in any way deemed to be endorsed by or attributed to Stewart-Peterson Inc. Reproduction of this information without prior written permission is prohibited. Hypothetical performance results have many inherent limitations. No representation is being made that any account will or is likely to achieve profits or losses similar to those shown. The data contained herein is believed to be drawn from reliable sources but cannot be guaranteed. Reproduction and distribution of this information without prior written permission is prohibited. This material has been prepared by a sales or trading employee or agent of Total Farm Marketing and is, or is in the nature of, a solicitation. Any decisions you may make to buy, sell or hold a position on such research are entirely your own and not in any way deemed to be endorsed by or attributed to Total Farm Marketing.
Stewart-Peterson Inc., Stewart-Peterson Group Inc., and SP Risk Services LLC are each part of the family of companies within Total Farm Marketing (TFM). Stewart-Peterson Inc. is a publishing company. Stewart-Peterson Group Inc. is registered with the Commodity Futures Trading Commission (CFTC) as an introducing broker and is a member of National Futures Association. SP Risk Services LLC is an insurance agency. A customer may have relationships with any or all three companies.
Corn is trading higher this morning following yesterday’s technically weak price action.
December Corn traded to 499-1/2 in yesterday’s session before facing sharp selling pressure and closing 9-1/2 cents lower.
Brazilian corn exports in the month of August are expected to reach 9.19 million tons versus 6.89 million tons in the same month a year ago.
Temperatures over the next two weeks are expected to be far above normal while precipitation is forecast to be below normal for the Corn Belt.
Soybeans are trading higher this morning along with both soybean meal and oil.
Heat and limited moisture in most of the Midwest over the next 10-days could speed along soybean maturity.
November soybeans are right back near the $14 level with futures technically oversold. November futures have closed above the $14 level just once in the month of August.
Canadian soybean production is expected to be 2.9% higher than last year according to a Statistics Canada estimate this week.
Winter wheat is trading higher this morning after sharply lower trade to end last week and start this week. Spring wheat futures are slightly lower this morning.
Wheat production in Canada is expected to be 14.2% lower than last year’s crop, according to estimates released Tuesday by Statistics Canada on its website.
A Farm Futures survey released this week expects US all-wheat seedings to be up 5.8% compared to last year.
The European Union’s soft-wheat exports in the season that began July 1 reached 4.49 million tons as of Aug. 27, compared with 6.31 million tons in a similar period a year earlier, the European Commission said on its website.
Grain Market Insider is provided by Stewart-Peterson Inc., a publishing company.
Futures and options trading involve significant risk of loss and may not be suitable for everyone. Therefore, carefully consider whether such trading is suitable for you in light of your financial condition. The data contained herein is believed to be drawn from reliable sources but cannot be guaranteed. This material has been prepared by a sales or trading employee or agent of Total Farm Marketing by Stewart-Peterson and is, or is in the nature of, a solicitation. Any decisions you may make to buy, sell or hold a futures or options position on such research are entirely your own and not in any way deemed to be endorsed by or attributed to Stewart-Peterson Inc. Reproduction of this information without prior written permission is prohibited. Hypothetical performance results have many inherent limitations. No representation is being made that any account will or is likely to achieve profits or losses similar to those shown. The data contained herein is believed to be drawn from reliable sources but cannot be guaranteed. Reproduction and distribution of this information without prior written permission is prohibited. This material has been prepared by a sales or trading employee or agent of Total Farm Marketing and is, or is in the nature of, a solicitation. Any decisions you may make to buy, sell or hold a position on such research are entirely your own and not in any way deemed to be endorsed by or attributed to Total Farm Marketing.
Stewart-Peterson Inc., Stewart-Peterson Group Inc., and SP Risk Services LLC are each part of the family of companies within Total Farm Marketing (TFM). Stewart-Peterson Inc. is a publishing company. Stewart-Peterson Group Inc. is registered with the Commodity Futures Trading Commission (CFTC) as an introducing broker and is a member of National Futures Association. SP Risk Services LLC is an insurance agency. A customer may have relationships with any or all three companies.
Spillover weakness from wheat and soybeans, combined with better than expected crop ratings pressured the corn market into the close after it traded on both sides of unchanged earlier in the session.
Flash sales totaling 350k mt of soybeans, soybean meal and cake to unknown destinations for the 23/24 marketing year were not enough to offset the bearishness of better than expected soybean crop ratings, as all three legs of the soybean complex closed the day in the red.
Global markets and Brazilian harvest pressure may be adding to the weakness in the wheat complex as prices for all three classes continued their slide lower.
The US dollar traded 0.42% lower today after reversing course yesterday and trading to its highest level since early June last Friday. The contract is showing signs of being overbought and could lend support to commodities if it follows through to the downside.
To see the current US 7-day Precipitation forecast and the 8 – 14 day Temperature and Precipitation Outlooks from NOAA, scroll down to the other Charts/Weather Section.
Note – For the best viewing experience, some Grain Market Insider content is best viewed with your phone held horizontally.
Corn
Corn Action Plan Summary
No action is recommended for the 2023 corn crop. This year’s growing season has been marked by dry conditions and changing weather forecasts, which have swung prices nearly 150 cents from high to low. Though dry conditions remain, with a great amount of variability in crop conditions from region to region, it may not be until after harvest before we know the full effect this growing season had on yields. Just as Insider recently recommended selling half of the previously recommended DEC 580 puts to lock in gains in case the market turns higher, Insider will continue to monitor market conditions and may consider recommending selling the remaining DEC 580 puts if conditions warrant it. While many unknowns could still shock the market higher, seasonality and current trends suggest we may not see a shift to higher prices until after harvest.
No action is currently recommended for 2024 corn.In 2012, the best pricing opportunities for Dec 2013 corn were during the 2012 summer runup. Despite the significant yield losses to the 2012 crop, and the fear of running out of corn, the Dec 2013 contract peaked in the summer of 2012, and by Jan 2 of 2013, the price was already down about 12% from the high. We continue to watch the calendar for 2024 corn as this 2023 summer volatility could provide some additional opportunities to get some good early sales on the books in the event of a 2013 type repeat. Insider recently recommended making a sale on your 2024 crop, and we’ll be watching for another opportunity to suggest adding to prior early sales levels between now and the beginning of September.
No Action is currently recommended for 2025 corn.2025 markets are very illiquid right now, and it may be some time before conditions are conducive to consider making any recommendations. Be patient as we monitor the markets for signs of improvement.
Selling pressure across the grain complex pressured corn futures as prices reversed off the session highs and Dec corn closed 9-1/2 cents lower on the day. The weak price action damaged the charts technically and could bring additional selling pressure for tomorrow’s session.
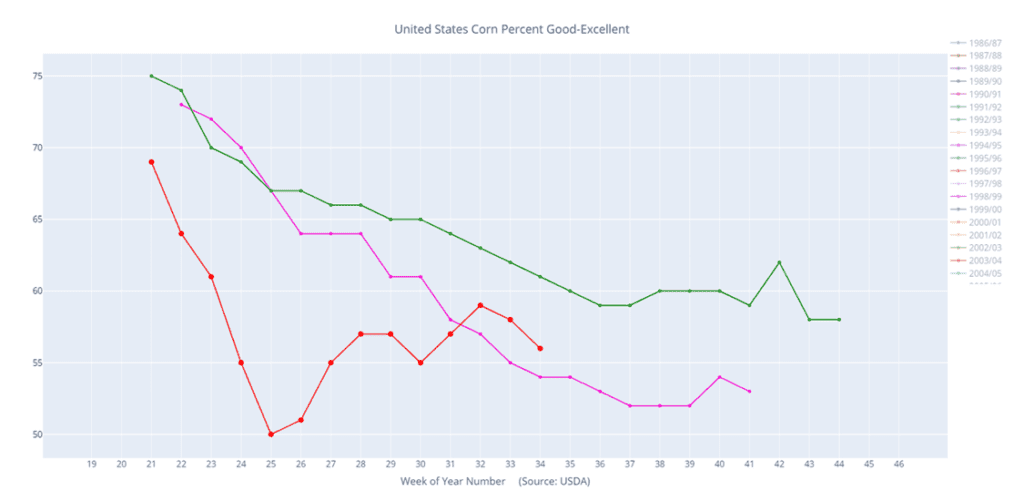
Weekly crop progress numbers showed corn rated good to excellent fell only 2% to 56%, where a 3% drop was expected, and 17% of the crop was rated poor to very poor. The eastern Corn Belt ratings improved week over week, despite the recent hot weather.
Weather forecasts are staying on the warmer and drier side, but the impact of Hurricane Idalia in the Gulf could trigger some moisture in the Corn Belt.
As harvest moves closer, basis levels could be under pressure as end users become more comfortable with front-end supplies, as well as receiving freshly harvested corn. The possibly softer cash market tone will likely weigh on futures prices.
Brazilian corn crop harvest is nearing completion at 83% harvested last week. The northern regions are starting planting of next spring’s new crop, with 7% of corn being planted as of last week.
Above: After trading mostly sideways since the end of July, December corn posted a bearish reversal on 8/21 after testing the 495 – 516 resistance level. While the reversal is a bearish development, prices could turn higher if the market receives additional bullish input. Should that happen, resistance above the market remains between 495 – 516. If not and prices turn lower, support may be found near 460 and again near 415.
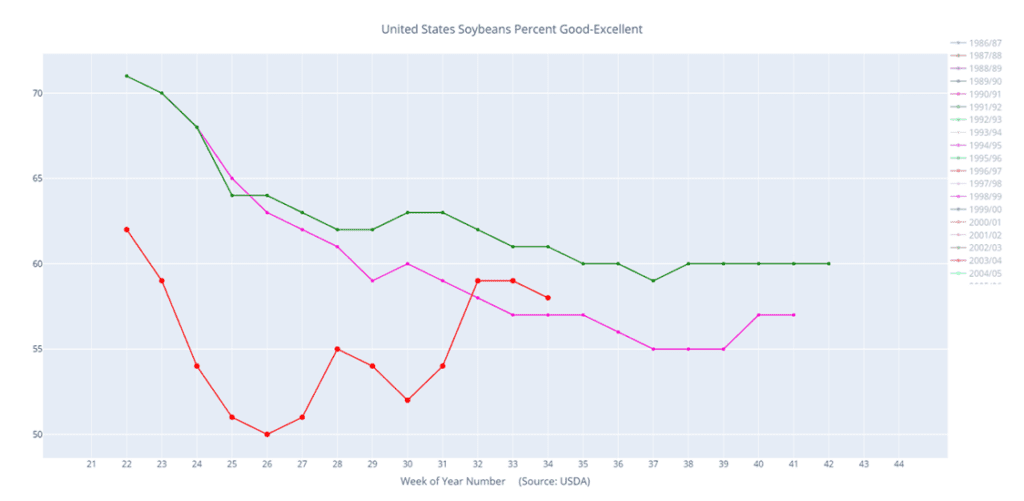
Above: 2023/24 Corn condition percent good-excellent (red) versus the 5-year average (green) and last year (pink).
Soybeans
Soybeans Action Plan Summary
No action is recommended for 2023 soybeans.This season the market has experienced a lot of volatility, not only from USDA reports but also from the changing weather forecasts, crop conditions, and export sales. We ended the month of July experiencing hot conditions with little rainfall and weak export sales. Since then, conditions have become more favorable, and export sales have picked up. While much of the crop remains in drought conditions, which can maintain upside potential, timely rains may come and push prices lower. Much like in 2012, when July was dry, and the pattern changed in August, when decent rain fell in parts of the western Corn Belt and IL, sending Nov ’12 soybeans down 20%. For now, Insider may not consider suggesting any additional sales until after harvest. Although, we will continue to monitor the market for any upside opportunities in the coming weeks.
No action is recommended for 2024 crop. Grain Market Insider continues to monitor any developments for the 2024 crop, though it may not be until after harvest or toward year’s end before we will consider recommending any 2024 crop sales.
No Action is currently recommended for 2025 Soybeans. 2025 markets are very illiquid right now, and it may be some time before conditions are conducive to consider making any recommendations. Be patient as we monitor the markets for signs of improvement.
Soybeans ended the day lower, along with both soybean meal and oil, after yesterday’s Crop Progress report showed very little crop degradation compared to what trade was expecting. Export sales this morning offered some support earlier in the day before prices faded again.
Yesterday’s crop progress data showed little degradation in the soybean crop with good to excellent ratings falling only one point to 58% despite the heat and dry conditions. Trade was expecting 56%. 91% of the crop is setting pods and 5% is dropping leaves.
As the US becomes more competitive with Brazil, exports have begun to pick up over the past few weeks with two sales being reported today. 246,100 metric tons of soybeans were sold to unknown destinations for the 23/24 marketing year, and 105,000 metric tons of soybean meal were sold to unknown destinations, also the 23/24 marketing year.
Weather forecasts over the next 14 days or more are showing above normal temperatures and below average precipitation which could cause crop ratings to fall more significantly in the coming weeks.
Above: On August 28 the market gapped higher and closed above the 1381 – 1401 resistance area, which may now become support. Though supportive, markets tend to fill gaps over time, and it may be drawn to fill the gap left between 1390-1/2 and 1394-3/4. For now, the next resistance level could be near 1450 and the 200-day moving average. If the market turns lower and trades through 1381 – 1401 support, further support could be found near 1330.
Above: 2023/24 Soybeans condition percent good-excellent (red) versus the 5-year average (green) and last year (pink).
Wheat
Market Notes: Wheat
US wheat futures may have inherited some weakness today from other global markets. Matif wheat futures closed lower, and harvest progress in Brazil is putting pressure on their prices as well.
According to Interfax and the Russian Grain Union, Russia’s grain exports increased 27% year on year. Wheat shipments specifically were up 29% from August 1st to 27th.
Concerns about China’s economy may be weighing on the grain complex as a whole. China is the world’s largest commodity buyer, so demand is a legitimate worry. China announced that they are going to reduce mortgage rates to help stimulate the economy, but so far, their attempts have had little success.
December Chicago wheat posted a new contract low today at 5.99-1/2 but was able to close just above support at 6.00. Technically, it is oversold and could be due for a correction to the upside but may not have the fundamental support to sustain any significant rally.
Chicago Wheat Action Plan Summary
No new action is recommended for 2023 crop. Since the end of May, the wheat market has been largely rangebound, influenced by weak demand, changing headlines from the Black Sea region, and the corn market with its own demand and weather concerns. With harvest in the rearview mirror, U.S. production has been better than expected and demand remains weak. Still, many supply questions remain unanswered from the Black Sea region, which could push prices in either direction. While Insider will continue to monitor the downside for any breach of major support, we would need to see prices pushed toward the 800 level before considering any additional sales.
No action is currently recommended for 2024 Chicago wheat. Since the middle of June price volatility has risen with updated USDA reports, changing weather forecasts, and current events in the Black Sea. While prices continue to be volatile, plenty of time remains to market the 2024 crop. War continues in the Black Sea region, the world stocks-to-use ratio is the lowest in 8 years, and no one knows what the weather will bring, leaving the market vulnerable to many uncertainties. For now, after recommending making a sale for the 2024 crop, and while keeping an eye on the market to see if any major support is broken, Grain Market Insider would need to see prices north of 800 before considering recommending any additional sales.
No Action is currently recommended for 2025 Chicago Wheat. 2025 markets are very illiquid right now, and it may be some time before conditions are conducive to consider making any recommendations. Be patient as we monitor the markets for signs of improvement.
Above: The Chicago wheat market appears to be consolidating between 650 and 596. If the market breaks out to the upside, the next level of resistance may be found near 665, if not, and the market drifts lower, the next level of support below the market may be found near 573.
KC Wheat Action Plan Summary
We continue to look for better prices before making any 2023 sales. As more becomes known about this year’s crop with some reports of better than expected yields, questions remain about the world wheat supply. War continues in the Black Sea region, Ukraine’s export capabilities remain uncertain, and dryness continues in key production areas of the world. With a world stocks-to-use ratio at its lowest level in 8 years, we continue to target 950 – 1000 in the July futures as a potential level to suggest the next round of New Crop sales. At the same time, we continue to watch the bottom end of the range that prices have traded in since late 2022. A close below the bottom end would reduce the probability of getting to 950 – 1000 and would increase the risk of prices falling into the 600 – 650 range.
No Action is currently recommended for 2025 KC Wheat. 2025 markets are very illiquid right now, and it may be some time before conditions are conducive to consider making any recommendations. Be patient as we monitor the markets for signs of improvement.
Above: December KC wheat broke through the bottom end of its trading range and may be poised to test the September ’21 low of 670 unless bullish input enters the market to turn prices higher. If so, initial resistance above the market may rest near 772 – 780.
Mpls Wheat Action Plan Summary
No action is currently recommended for the 2023 New Crop. Weather has been a dominant feature to price volatility this growing season, with continued dryness concerns in not only the US, but also Canada and Australia. While there typically isn’t a strong likelihood of higher prices until after harvest is complete, both weather and geopolitical events can change suddenly to move prices higher. Insider will consider making sales suggestions if prices improve, while also continuing to watch the downside for any further violations of support.
No action is currently recommended for 2024 Minneapolis wheat. This year has been dominated by production concerns regarding the 2023 crop, and considering slow export demand and cheap Russian prices continue to be major headwinds for prices. Insider recently recommended buying July ’24 puts to protect unsold grain if prices continue to retreat further. While war persists in the Black Sea region, production concerns continue in the southern hemisphere due to El Nino, and the world stocks-to-use ratio remains at an 8-year low, there are still many uncertainties that could shock prices higher. For now, plenty of time remains to market the 2024 crop and Insider is content to see how the market develops before suggesting making any additional sales. After recommending buying July ’24 K.C. wheat 660 puts for the liquidity and high correlation to Minneapolis wheat’s price movements, unsold bushels will be protected if prices make new lows, and if prices turn around and rally higher, Insider will be looking for opportunities to consider recommending additional sales.
No Action is currently recommended for the 2025 Minneapolis wheat crop. 2025 markets are very illiquid right now, and it may be some time before conditions are conducive to consider making any recommendations. Be patient as we monitor the markets for signs of improvement.
Above: Since the middle of August, the market has been consolidating between nearby support and resistance of 786 and 820. Should the market break out of the current range, key support below the market lies near the May low of 769, with the next support level near the June ’21 low of 730. Above the market, the next area of resistance could be found near 837.
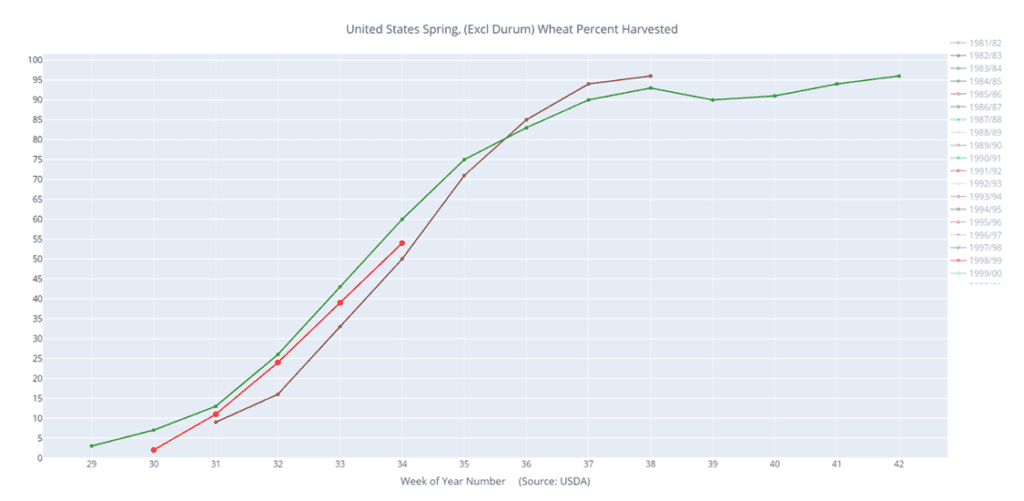
Above: 2023/24 Spring wheat percent harvested (red) versus the 5-year average (green) and last year (purple).
Other Charts / Weather
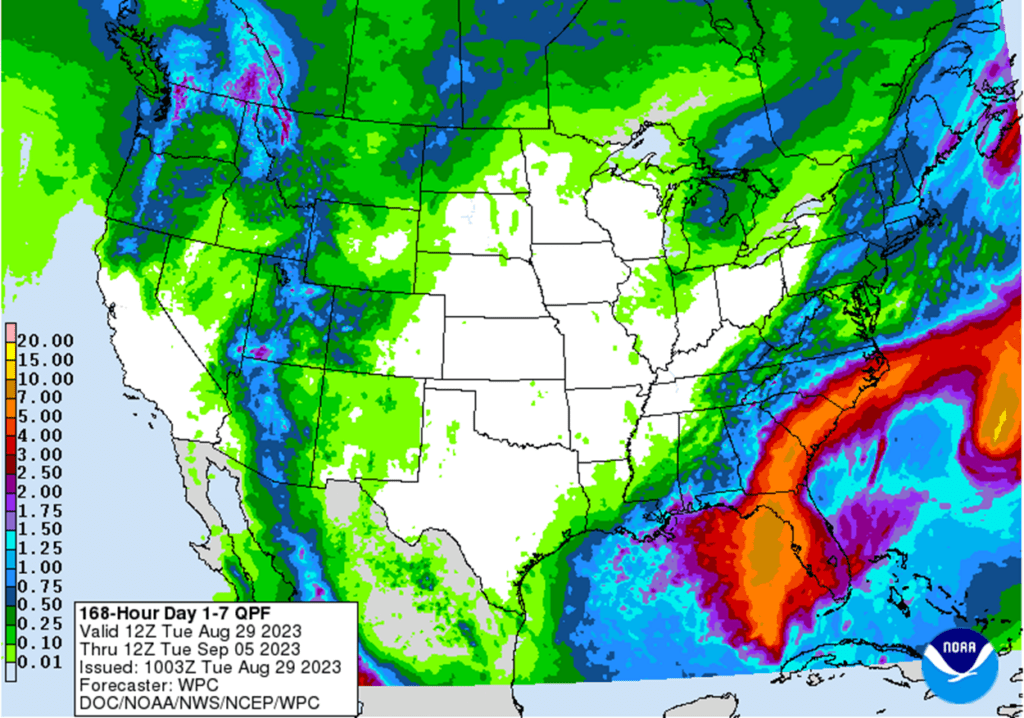
US 7-day precipitation forecast courtesy of NOAA, Weather Prediction Center.
Corn is trading slightly lower at midday following crop progress that showed less deterioration of the crop than previously expected by trade.
Temperatures were in the 60’s this morning through the Corn Belt with showers near the Oklahoma panhandle, but conditions are dry otherwise and are forecast to be hot and dry over the next 14 days.
Crop progress showed corn’s good to excellent rating falling to 56% from 58% last week and the average trade guess being 55%. 88% of the crop is in the dough stage, 51% is dented compared to 35% last week, and 9% is mature compared to 4% a week ago.
Brazil is currently harvesting their safrinha corn, but harvest pace is slow due to wet conditions in the South. Brazil’s total corn crop for 23/24 is projected at 133 mmt.
Soybeans are trading slightly lower and have come off the earlier morning lows with a recovery by soybean oil, while soybean meal trades lower.
Surprisingly, yesterday’s crop progress data showed little degradation in the soybean crop with good to excellent ratings falling only one point to 58% despite the heat and dry weather.
This morning private exporters reported a sale of 246,100 metric tons of soybeans to delivery to unknown destinations for 23/24, and a sale of 105,000 metric tons of soybean cake and meal to unknown destinations for 23/24.
Argentina is attempting to encourage farmer selling by possibly implementing a temporary forex ratefor processors where 75% of revenues are exchanged at the official rate of about 350 pesos per dollar and the other 25% could be sold on parallel markets trading at more than 700 pesos per dollar.
Wheat is trading lower again as it continues its lower trend, and December Chicago wheat has taken out its contract low as prices slump during harvest.
Yesterday’s crop progress said 54% of the spring wheat crop was harvested and 37% of it was rated good to excellent. Minnesota has the best crop ratings at 63% good to excellent and Washington is the worst at 25%.
Russia is currently harvesting their wheat crop which is estimated at a huge 85.0 mmt for 23/24 and will likely be big enough for them to maintain their hold on world wheat exports again.
The President of Turkey is expected to meet with Vladimir Putin next week to discuss the grain deal with hopes Russia will agree to renew it.
Grain Market Insider is provided by Stewart-Peterson Inc., a publishing company.
Futures and options trading involve significant risk of loss and may not be suitable for everyone. Therefore, carefully consider whether such trading is suitable for you in light of your financial condition. The data contained herein is believed to be drawn from reliable sources but cannot be guaranteed. This material has been prepared by a sales or trading employee or agent of Total Farm Marketing by Stewart-Peterson and is, or is in the nature of, a solicitation. Any decisions you may make to buy, sell or hold a futures or options position on such research are entirely your own and not in any way deemed to be endorsed by or attributed to Stewart-Peterson Inc. Reproduction of this information without prior written permission is prohibited. Hypothetical performance results have many inherent limitations. No representation is being made that any account will or is likely to achieve profits or losses similar to those shown. The data contained herein is believed to be drawn from reliable sources but cannot be guaranteed. Reproduction and distribution of this information without prior written permission is prohibited. This material has been prepared by a sales or trading employee or agent of Total Farm Marketing and is, or is in the nature of, a solicitation. Any decisions you may make to buy, sell or hold a position on such research are entirely your own and not in any way deemed to be endorsed by or attributed to Total Farm Marketing.
Stewart-Peterson Inc., Stewart-Peterson Group Inc., and SP Risk Services LLC are each part of the family of companies within Total Farm Marketing (TFM). Stewart-Peterson Inc. is a publishing company. Stewart-Peterson Group Inc. is registered with the Commodity Futures Trading Commission (CFTC) as an introducing broker and is a member of National Futures Association. SP Risk Services LLC is an insurance agency. A customer may have relationships with any or all three companies.
Corn is trading lower this morning following yesterday’s crop progress report but weather over the next two weeks is expected to be hot and dry.
Crop progress showed corn’s good to excellent rating falling to 56% from 58% last week and the average trade guess being 55%.
88% of the crop is doughing, 51% is dented compared to 35% last week, and 9% is mature compared to 4% a week ago.
While ratings didn’t fall much last week, temperatures over the next two weeks are expected to be far above normal while precipitation is forecast to be below normal for the Corn Belt.
Soybeans are trading lower this morning along with both soybean meal and oil as trade was expecting a much larger drop in crop ratings.
58% of the soybean crop was rated good to excellent vs 59% a week ago with trade expecting a rating of 56%. 91% of the crop is setting pods vs 86% a week ago, and 5% is dropping leaves.
November soybeans may be finding some resistance at the 14 dollar level with futures technically oversold and a gap lower on the chart at 13.90-1/2.
Brazil’s soybean crop for 23/24 is seen at 162.8 mmt vs 154.6 mmt in the previous year as production expands.
Wheat is trading lower again this morning with KC taking the brunt of the losses and Chicago following behind. Yesterday’s crop progress was slightly friendly for Minn wheat.
Yesterday’s crop progress for spring wheat showed harvest 54% complete compared to 39% a week ago and in line with trade guesses while the good to excellent rating slipped 1 point to 37% which was in line with expectations.
The Russian Grain Union has said that Russian exports of wheat have risen by 27% year over year in August to 6.4 mmt.
In Brazil, wheat prices have faded significantly with the monthly price averages at the lowest levels since 2020. 70% of the wheat crop is harvested in Brazil.
Grain Market Insider is provided by Stewart-Peterson Inc., a publishing company.
Futures and options trading involve significant risk of loss and may not be suitable for everyone. Therefore, carefully consider whether such trading is suitable for you in light of your financial condition. The data contained herein is believed to be drawn from reliable sources but cannot be guaranteed. This material has been prepared by a sales or trading employee or agent of Total Farm Marketing by Stewart-Peterson and is, or is in the nature of, a solicitation. Any decisions you may make to buy, sell or hold a futures or options position on such research are entirely your own and not in any way deemed to be endorsed by or attributed to Stewart-Peterson Inc. Reproduction of this information without prior written permission is prohibited. Hypothetical performance results have many inherent limitations. No representation is being made that any account will or is likely to achieve profits or losses similar to those shown. The data contained herein is believed to be drawn from reliable sources but cannot be guaranteed. Reproduction and distribution of this information without prior written permission is prohibited. This material has been prepared by a sales or trading employee or agent of Total Farm Marketing and is, or is in the nature of, a solicitation. Any decisions you may make to buy, sell or hold a position on such research are entirely your own and not in any way deemed to be endorsed by or attributed to Total Farm Marketing.
Stewart-Peterson Inc., Stewart-Peterson Group Inc., and SP Risk Services LLC are each part of the family of companies within Total Farm Marketing (TFM). Stewart-Peterson Inc. is a publishing company. Stewart-Peterson Group Inc. is registered with the Commodity Futures Trading Commission (CFTC) as an introducing broker and is a member of National Futures Association. SP Risk Services LLC is an insurance agency. A customer may have relationships with any or all three companies.
A warm and dry two-week forecast and strong export inspection totals helped to support the corn market which gapped 5-1/2 cents higher on the open Sunday night.
The USDA reported a 296k mt flash sale of 23/24 soybeans to unknown destinations which helped rally the soybean market after it gapped higher on the open Sunday night on a less-than-ideal warm and dry forecast.
Soybean meal continues to garner strength to possibly challenge the July highs on talk that Argentina may stop exporting meal come October due to their short harvest. While following a weak start, bean oil was also able to follow through on Friday’s gains and close in the green.
Despite strength in corn and soybeans, all three wheat classes succumbed to market sellers as Black Sea exports continue, and talks may resume between Russia and Turkey about renewing the Black Sea export corridor.
To see the current US 8 – 14 day Temperature and Precipitation Outlooks from NOAA, scroll down to the other Charts/Weather Section.
Note – For the best viewing experience, some Grain Market Insider content is best viewed with your phone held horizontally.
Corn
Corn Action Plan Summary
No action is recommended for the 2023 corn crop. This year’s growing season has been marked by dry conditions and changing weather forecasts, which have swung prices nearly 150 cents from high to low. Though dry conditions remain, with a great amount of variability in crop conditions from region to region, it may not be until after harvest before we know the full effect this growing season had on yields. Just as Insider recently recommended selling half of the previously recommended DEC 580 puts to lock in gains in case the market turns higher, Insider will continue to monitor market conditions and may consider recommending selling the remaining DEC 580 puts if conditions warrant it. While many unknowns could still shock the market higher, seasonality and current trends suggest we may not see a shift to higher prices until after harvest.
No action is currently recommended for 2024 corn.In 2012, the best pricing opportunities for Dec 2013 corn were during the 2012 summer runup. Despite the significant yield losses to the 2012 crop, and the fear of running out of corn, the Dec 2013 contract peaked in the summer of 2012, and by Jan 2 of 2013, the price was already down about 12% from the high. We continue to watch the calendar for 2024 corn as this 2023 summer volatility could provide some additional opportunities to get some good early sales on the books in the event of a 2013 type repeat. Insider recently recommended making a sale on your 2024 crop, and we’ll be watching for another opportunity to suggest adding to prior early sales levels between now and the beginning of September.
No Action is currently recommended for 2025 corn.2025 markets are very illiquid right now, and it may be some time before conditions are conducive to consider making any recommendations. Be patient as we monitor the markets for signs of improvement.
Corn futures followed the strength in soybean markets, adding some weather premium to close 7-8 cents higher. Dec corn futures may be looking to challenge the $5.00 level as the next level of resistance.
Overall, weather forecasts going into September are remaining warmer and drier than normal, which may bring the crop to maturity faster than anticipated. The market is pricing in some reduced potential yield from current levels.
Weekly export inspections were above expectations on Monday. Last week, exporters shipped 597,000 MT of corn, slightly above expectations. Year to date, weekly export inspections are still 33% behind last year with the market year ending on August 31.
Demand is still a question, but the USDA reported routine corn sales continuing to Mexico. Mexico purchased 130,000MT of US corn on a flash sale for the 2023-24 marketing year.
Pro Farmer released its projected national yield for the year at 172.0 bu/acre, currently under the USDA and last year’s levels. With the weather forecast, the market is likely adding some premium in case USDA projections for production is high. The next USDA crop production report will be released on September 12.
Above: After trading mostly sideways since the end of July, December corn posted a bearish reversal on 8/21 after testing the 495 – 516 resistance level. While the reversal is a bearish development, continued bullish input will be needed to turn prices higher. Should that happen, resistance above the market remains between 495 – 516. If not and prices turn lower, support may be found near 460 and again near 415.
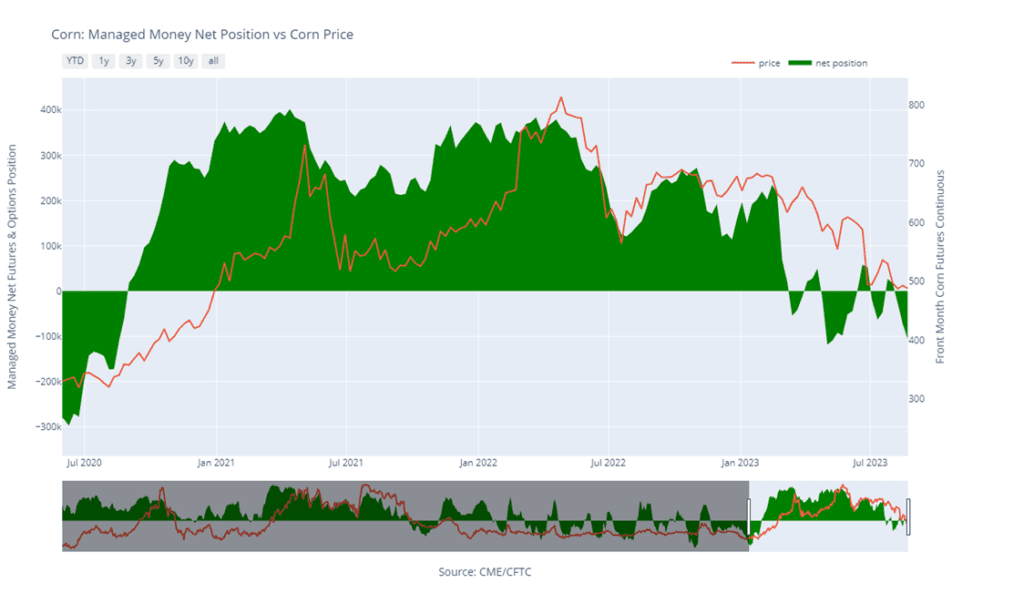
Above: Corn Managed Money Funds net position as of Tuesday, August 22. Net position in Green versus price in Red. Managers net sold 33,555 contracts between Aug. 15 – 22, bringing their total position to a net short 106,135 contracts.
Soybeans
Soybeans Action Plan Summary
No action is recommended for 2023 soybeans.This season the market has experienced a lot of volatility, not only from USDA reports but also from the changing weather forecasts, crop conditions, and export sales. We ended the month of July experiencing hot conditions with little rainfall and weak export sales. Since then, conditions have become more favorable, and export sales have picked up. While much of the crop remains in drought conditions, which can maintain upside potential, timely rains may come and push prices lower. Much like in 2012, when July was dry, and the pattern changed in August, when decent rain fell in parts of the western Corn Belt and IL, sending Nov ’12 soybeans down 20%. For now, Insider may not consider suggesting any additional sales until after harvest. Although, we will continue to monitor the market for any upside opportunities in the coming weeks.
No action is recommended for 2024 crop. Grain Market Insider continues to monitor any developments for the 2024 crop, though it may not be until after harvest or toward year’s end before we will consider recommending any 2024 crop sales.
No Action is currently recommended for 2025 Soybeans. 2025 markets are very illiquid right now, and it may be some time before conditions are conducive to consider making any recommendations. Be patient as we monitor the markets for signs of improvement.
Soybeans closed higher today along with both soybean meal and oil. Soybeans gapped higher overnight as weekend forecasts came out showing more heat and dryness that is expected to last for at least the next 7 days.
US exports have been improving as the US is becoming more competitive with Brazilian soybean prices as their basis picks up. A flash sale was reported this morning of 296,000 metric tons for delivery to unknown destinations for the 23/24 marketing year. Exports should continue to improve as Brazil turns its focus to corn planting.
Soybean export inspections came in as expected at 11.8 mb for the week ending Thursday, August 24, and total inspections for 22/23 are now at 1.906 bb which is down 8% from the previous year. Inspections are running on par with USDA expectations.
Pro Farmer’s crop tour ended last week with an average national yield guess of 49.7 bpa, which has added to support, but the USDA’s current guess is higher at 50.9 bpa. The USDA will revise this number in the September WASDE, but there is also a chance that they adjust acreage as well.
Above: On August 28 the market gapped higher and closed above the 1381 – 1401 resistance area, which may now become support. Though supportive, markets tend to fill gaps over time, and it may be drawn to fill the gap left between 1390-1/2 and 1394-3/4. For now, the next resistance level could be near 1450 and the 200-day moving average. If the market turns lower and trades through 1381 – 1401 support, further support could be found near 1330.
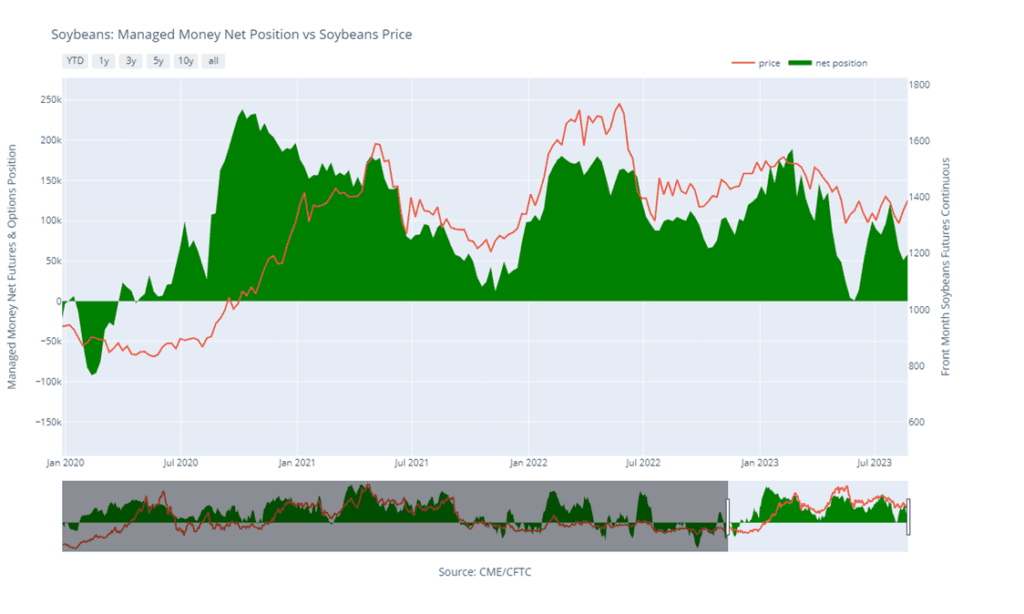
Above: Soybeans Managed Money Funds net position as of Tuesday, August 22. Net position in Green versus price in Red. Money Managers net bought 7,487 contracts between August 15 – 22, bringing their total position to a net long 58,206 contracts.
Wheat
Market Notes: Wheat
The USDA reported 390k mt of wheat were inspected for export as of August 24. While this is up from the previous week’s number of 311k mt, and above the upper end of expectations, the year-to-date total is down 21% from last year.
A second ship that has left Ukraine through the Black Sea in Ukraine’s new humanitarian corridor safely reached Romania despite Russia backing out of the grain deal.
There are reports that Vladimir Putin is set to meet with Turkish President Erdogan, possibly next week, to discuss the Black Sea export corridor deal.
There is dryness in both Argentina and Australia that could impact wheat yields. India is also having weather issues and is considering abolishing its import tax on wheat to help millers buy cheaper grain to help rein in rising domestic prices.
Chicago Wheat Action Plan Summary
No new action is recommended for 2023 crop. Since the end of May, the wheat market has been largely rangebound, influenced by weak demand, changing headlines from the Black Sea region, and the corn market with its own demand and weather concerns. With harvest in the rearview mirror, U.S. production has been better than expected and demand remains weak. Still, many supply questions remain unanswered from the Black Sea region, which could push prices in either direction. While Insider will continue to monitor the downside for any breach of major support, we would need to see prices pushed toward the 800 level before considering any additional sales.
No action is currently recommended for 2024 Chicago wheat. Since the middle of June price volatility has risen with updated USDA reports, changing weather forecasts, and current events in the Black Sea. While prices continue to be volatile, plenty of time remains to market the 2024 crop. War continues in the Black Sea region, the world stocks-to-use ratio is the lowest in 8 years, and no one knows what the weather will bring, leaving the market vulnerable to many uncertainties. For now, after recommending making a sale for the 2024 crop, and while keeping an eye on the market to see if any major support is broken, Grain Market Insider would need to see prices north of 800 before considering recommending any additional sales.
No Action is currently recommended for 2025 Chicago Wheat. 2025 markets are very illiquid right now, and it may be some time before conditions are conducive to consider making any recommendations. Be patient as we monitor the markets for signs of improvement.
Above: The Chicago wheat market appears to be consolidating between 650 and 596. If the market breaks out to the upside, the next level of resistance may be found near 665, if not, and the market drifts lower, the next level of support below the market may be found near 573.
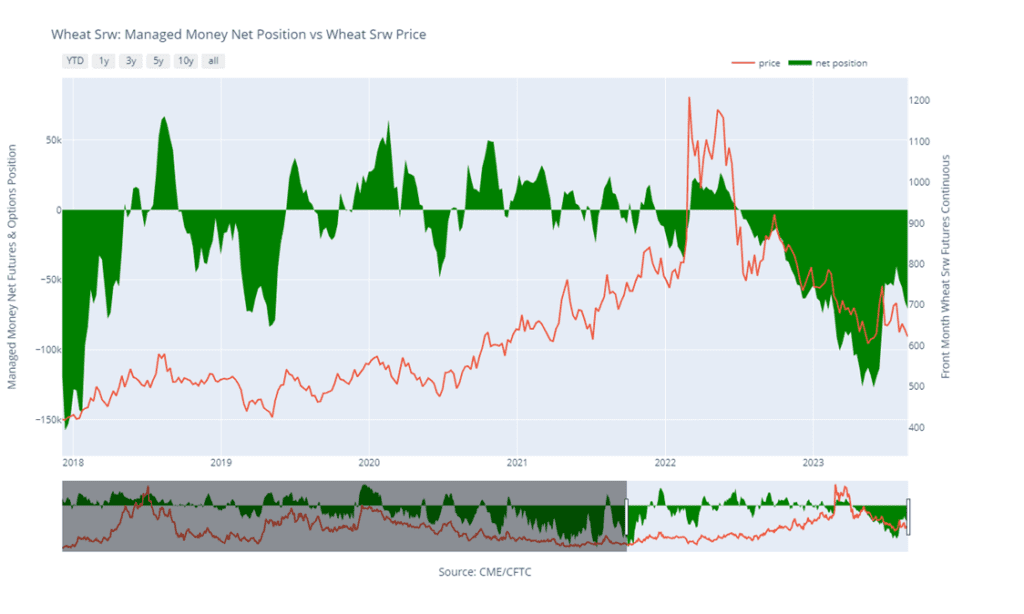
Above: Chicago Wheat Managed Money Funds net position as of Tuesday, August 22. Net position in Green versus price in Red. Money Managers net sold 5,331 contracts between August 15 – 22, bringing their total position to a net short 70,921 contracts.
KC Wheat Action Plan Summary
We continue to look for better prices before making any 2023 sales. As more becomes known about this year’s crop with some reports of better than expected yields, questions remain about the world wheat supply. War continues in the Black Sea region, Ukraine’s export capabilities remain uncertain, and dryness continues in key production areas of the world. With a world stocks-to-use ratio at its lowest level in 8 years, we continue to target 950 – 1000 in the July futures as a potential level to suggest the next round of New Crop sales. At the same time, we continue to watch the bottom end of the range that prices have traded in since late 2022. A close below the bottom end would reduce the probability of getting to 950 – 1000 and would increase the risk of prices falling into the 600 – 650 range.
No Action is currently recommended for 2025 KC Wheat. 2025 markets are very illiquid right now, and it may be some time before conditions are conducive to consider making any recommendations. Be patient as we monitor the markets for signs of improvement.
Above: The K.C. wheat market continues its sideways trend between 733 – 780, with the low end of the range acting as initial support, while the upper end of the range acts as initial resistance. If prices break out to the upside, psychological resistance sits around the 800 area. While below the market, the next area of major support is near the September ’21 low of 670.
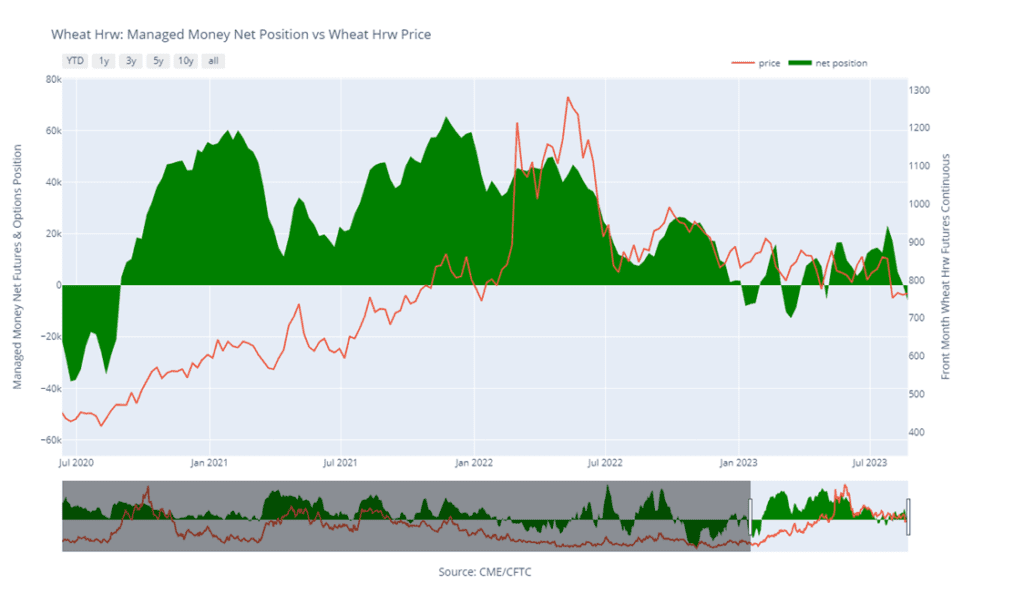
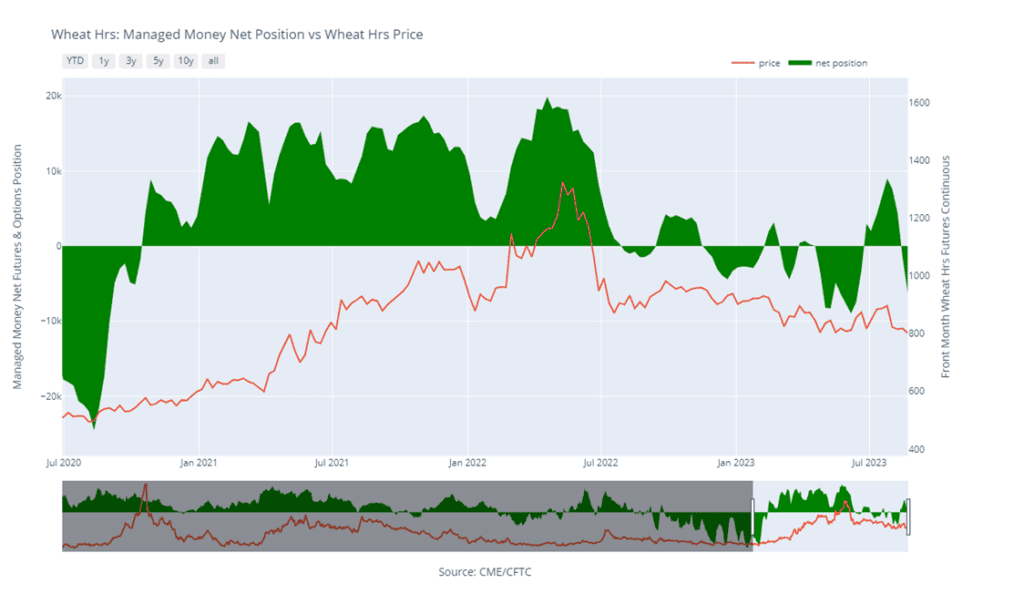
Above: KC Wheat Managed Money Funds net position as of Tuesday, August 22. Net position in Green versus price in Red. Money Managers net sold 6,552 contracts between August 15 – 22, bringing their total position to a net short 5,965 contracts.
Mpls Wheat Action Plan Summary
No action is currently recommended for the 2023 New Crop. Weather has been a dominant feature to price volatility this growing season, with continued dryness concerns in not only the US, but also Canada and Australia. While there typically isn’t a strong likelihood of higher prices until after harvest is complete, both weather and geopolitical events can change suddenly to move prices higher. Insider will consider making sales suggestions if prices improve, while also continuing to watch the downside for any further violations of support.
No action is currently recommended for 2024 Minneapolis wheat. This year has been dominated by production concerns regarding the 2023 crop, and considering slow export demand and cheap Russian prices continue to be major headwinds for prices. Insider recently recommended buying July ’24 puts to protect unsold grain if prices continue to retreat further. While war persists in the Black Sea region, production concerns continue in the southern hemisphere due to El Nino, and the world stocks-to-use ratio remains at an 8-year low, there are still many uncertainties that could shock prices higher. For now, plenty of time remains to market the 2024 crop and Insider is content to see how the market develops before suggesting making any additional sales. After recommending buying July ’24 K.C. wheat 660 puts for the liquidity and high correlation to Minneapolis wheat’s price movements, unsold bushels will be protected if prices make new lows, and if prices turn around and rally higher, Insider will be looking for opportunities to consider recommending additional sales.
No Action is currently recommended for the 2025 Minneapolis wheat crop. 2025 markets are very illiquid right now, and it may be some time before conditions are conducive to consider making any recommendations. Be patient as we monitor the markets for signs of improvement.
Above: Since the middle of August, the market has been consolidating between nearby support and resistance of 786 and 820. Should the market break out of the current range, key support below the market lies near the May low of 769, with the next support level near the June ’21 low of 730. Above the market, the next area of resistance could be found near 837.
Above: Minneapolis Wheat Managed Money Funds net position as of Tuesday, August 22. Net position in Green versus price in Red. Money Managers net sold 4,723 contracts between August 15 – 22, bringing their total position to a net short 6,234 contracts.
Corn is trading higher this morning as more hot and dry weather is forecast over the next 7 days which could impact crop ratings further. Yield estimates are between 173 and 177 bpa.
The Pro Farmer tour wrapped up last week with an average national yield guess of 172 bpa. The USDA typically estimates yields a few bpa higher than this crop tour.
A flash sale was reported this morning of 123,000 metric tons of corn for delivery to Mexico during the 23/24 marketing year.
US corn exports have become more competitive with Brazil after a rise in Brazil’s basis levels.
Soybeans are trading higher this morning, along with both soybean meal and oil, as markets trade the hot and dry weather forecast which could cause the crop to deteriorate further.
Pro Farmers crop tour ended last week with an average yield estimate of 49.7 bpa, which compares to the USDA’s guess of 50.9 bpa.
A flash sale was reported for soybeans this morning of 296,000 metric tons for delivery to unknown destinations for the 23/24 marketing year.
Exports have picked up for soybean meal as Argentina’s exports slip 27% from a year ago. Argentina’s crushing production has been limited due to their small soybean crop.
Wheat is trading lower again to begin the week as prices hover near their lows, but are unable to gain momentum higher with the US completing harvest and Russia selling wheat so cheaply.
A second ship that has left Ukraine through the Black Sea in Ukraine’s new humanitarian corridor safely reached Romania despite Russia backing out of the grain deal.
There is dryness in both Argentina and Australia that could impact wheat yields, and India is having weather issues too which could impact their production.
Yields for spring wheat in Minnesota and North Dakota are expected to be better than trade initially thought. This is in contrast to the USDA which has shown poor crop conditions.
Grain Market Insider is provided by Stewart-Peterson Inc., a publishing company.
Futures and options trading involve significant risk of loss and may not be suitable for everyone. Therefore, carefully consider whether such trading is suitable for you in light of your financial condition. The data contained herein is believed to be drawn from reliable sources but cannot be guaranteed. This material has been prepared by a sales or trading employee or agent of Total Farm Marketing by Stewart-Peterson and is, or is in the nature of, a solicitation. Any decisions you may make to buy, sell or hold a futures or options position on such research are entirely your own and not in any way deemed to be endorsed by or attributed to Stewart-Peterson Inc. Reproduction of this information without prior written permission is prohibited. Hypothetical performance results have many inherent limitations. No representation is being made that any account will or is likely to achieve profits or losses similar to those shown. The data contained herein is believed to be drawn from reliable sources but cannot be guaranteed. Reproduction and distribution of this information without prior written permission is prohibited. This material has been prepared by a sales or trading employee or agent of Total Farm Marketing and is, or is in the nature of, a solicitation. Any decisions you may make to buy, sell or hold a position on such research are entirely your own and not in any way deemed to be endorsed by or attributed to Total Farm Marketing.
Stewart-Peterson Inc., Stewart-Peterson Group Inc., and SP Risk Services LLC are each part of the family of companies within Total Farm Marketing (TFM). Stewart-Peterson Inc. is a publishing company. Stewart-Peterson Group Inc. is registered with the Commodity Futures Trading Commission (CFTC) as an introducing broker and is a member of National Futures Association. SP Risk Services LLC is an insurance agency. A customer may have relationships with any or all three companies.