8-20 Opening Update: Grains Starting the Day Mixed
We are excited to offer you a new way to follow the markets! While CME Group policy changes mean our daily updates will no longer show pricing data, you can now explore our interactive quote board, featuring up-to-date charts to help you track market trends.
Grain Market Insider Interactive Quote Board


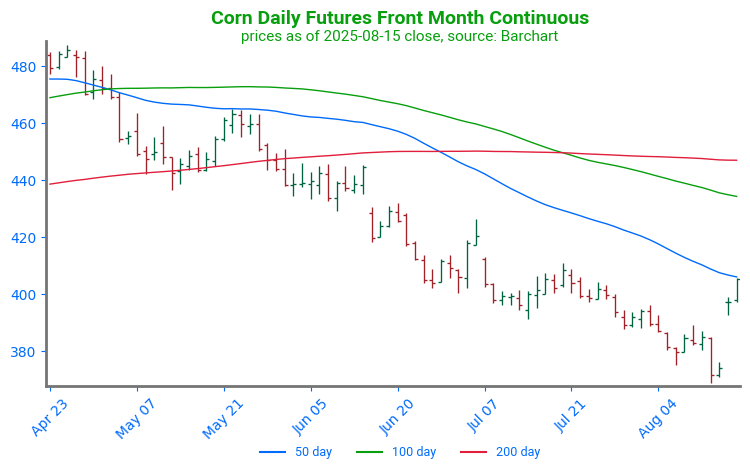
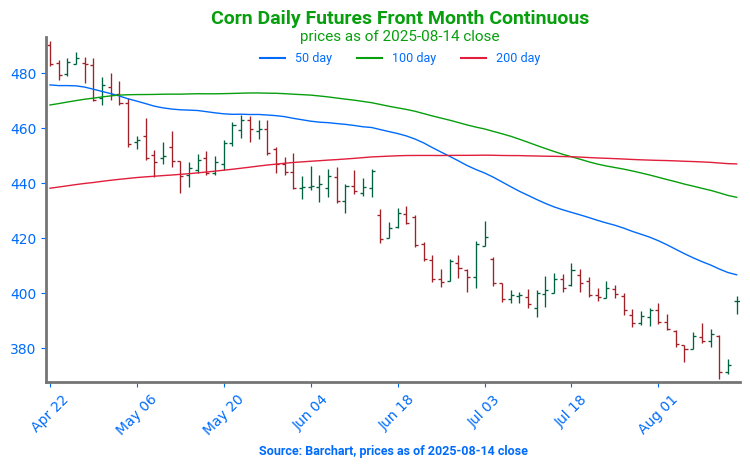
- Corn futures are lower this morning with September down 3/4 cents to $3.78-3/4 and December down 2 cents to $4.01-1/4.
- ProFarmer Crop Tour finds IN corn yield at 193.8 and NE at 179.5. The IN yield is the highest since tour started in 2003 and NE is the highest since 2021.
- Dalian corn hits a new contract low; U.S. sales to Mexico supportive, but dry Midwest weather, cooler temps, and weak export demand provide resistance.
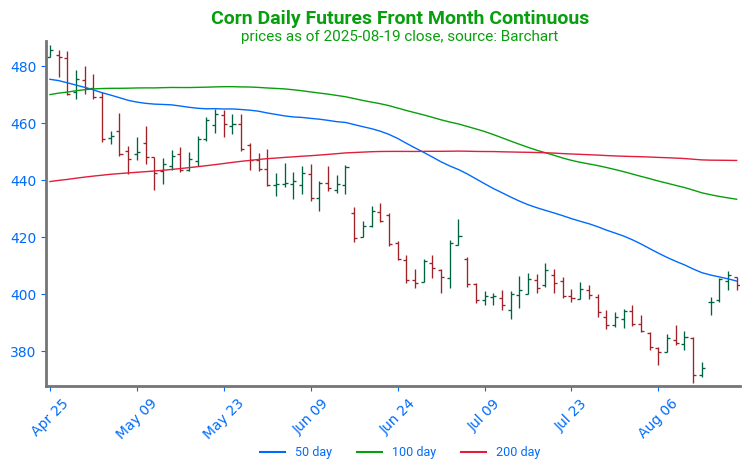
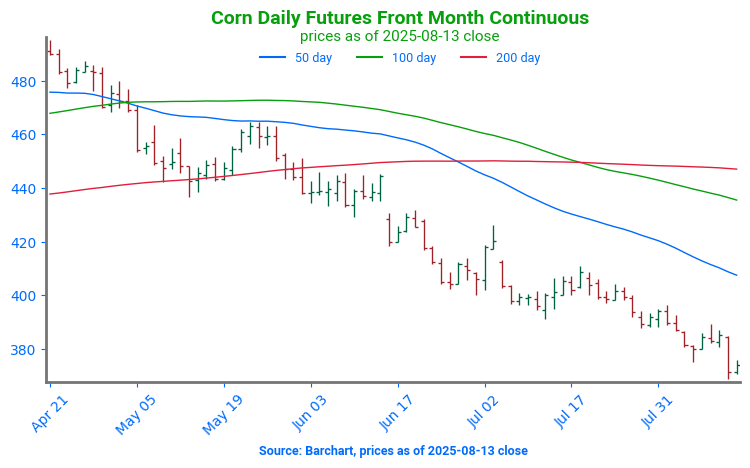
Corn Futures Attempt to Bounce: After a quiet May–July stretch, corn futures broke support near 391 to start August. However, losses tied to last week’s bearish USDA report were quickly reversed with a strong finish to the week. With December now the front month, a gap sits below the market between 380 and 400. On the upside, targets include an unfilled gap at 413, resistance at 420, and a second gap near 430.

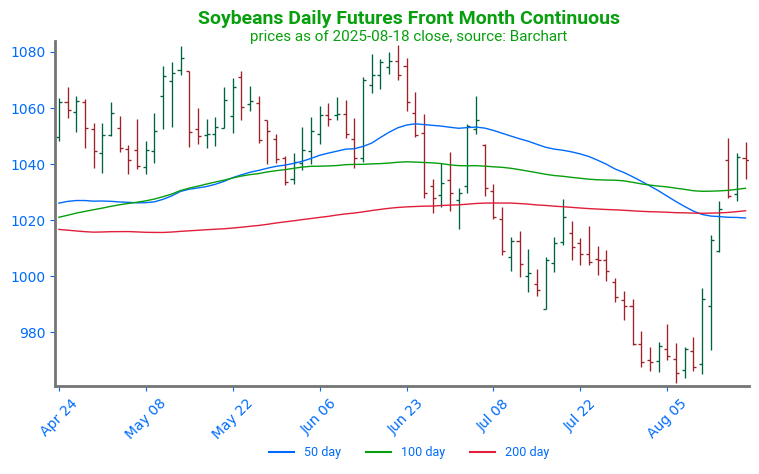
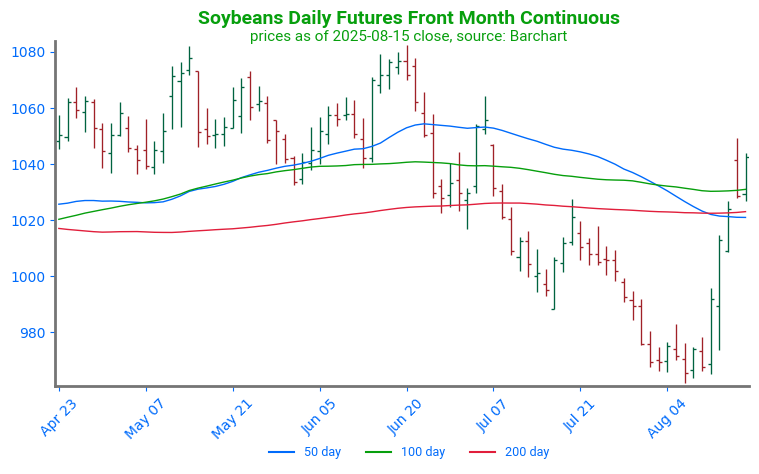
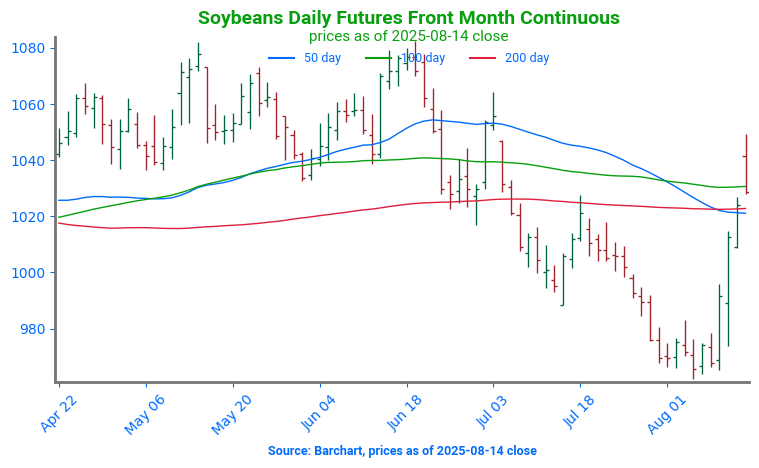
- Soybeans are mixed with the September contract up 1/4 cent at $10.1325, November down 1 cent at $10.32-3/4, Sep meal up 3.40 dollars at $290.80, and Sep bean oil down 0.38 cents to 51.30 cents.
- ProFarmer tour shows lower IN pod counts (1,376 vs 1,409 LY) but record-high NE (1,348 vs 1,172 LY).
- Soymeal strength continues to offset weaker soyoil with Sep crush up towards 191. Dalian oils complex trades lower, American Soybean Association urges Trump for China trade deal, and Brazil may curb crush on poor margins.
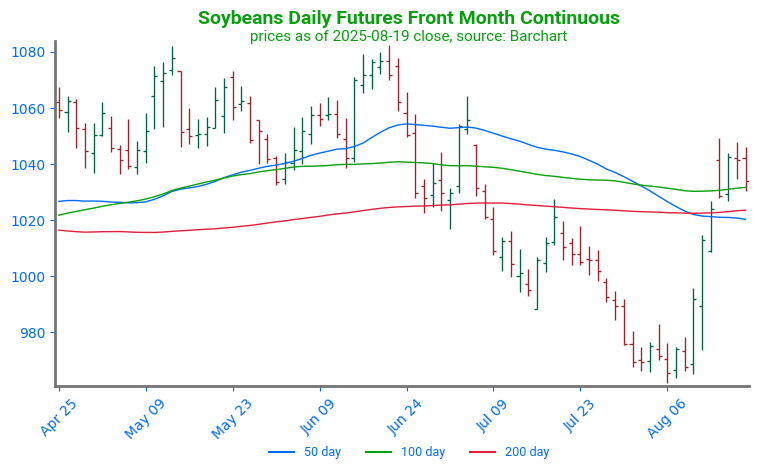
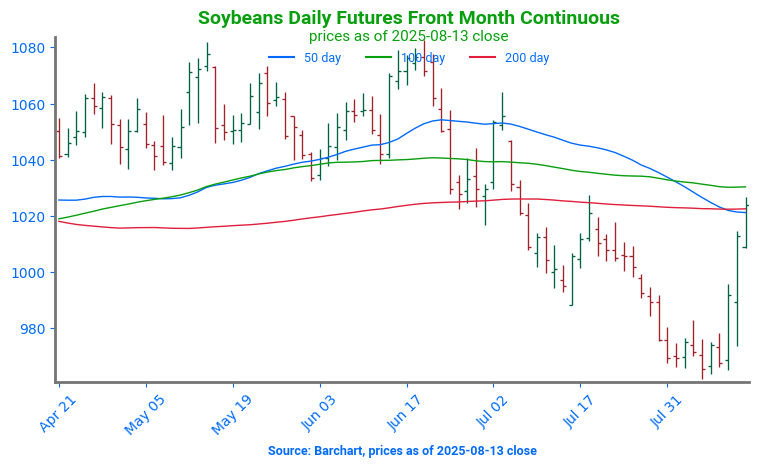
Soybeans Rally Through Resistance: Soybean futures rallied sharply in early August after a bullish USDA report cut 2.5 million acres from 2025 harvested area projections. Prices broke through resistance near 1030 and have since held above it, with this zone now acting as support on any pullback. On the upside, the next key resistance stands at the spring highs near 1080, a level that has capped rallies for the past year.

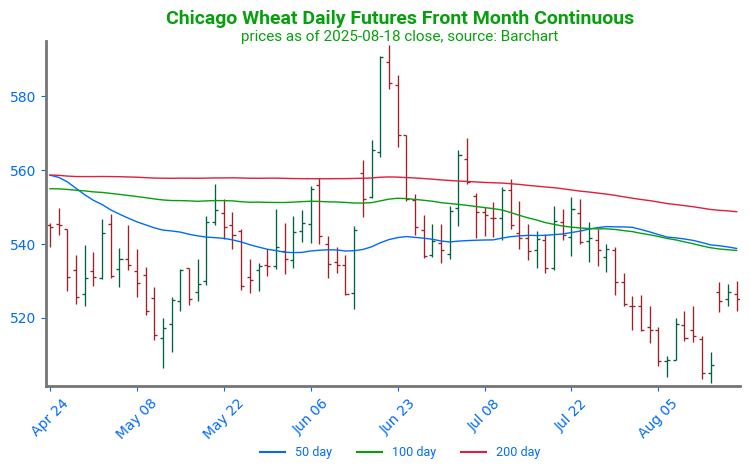
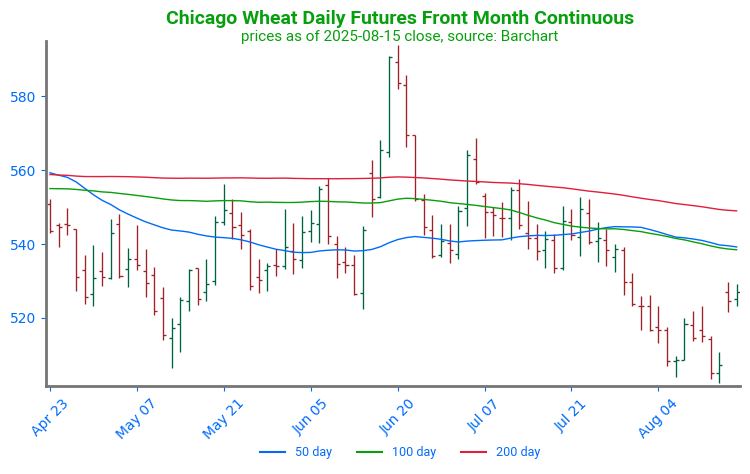
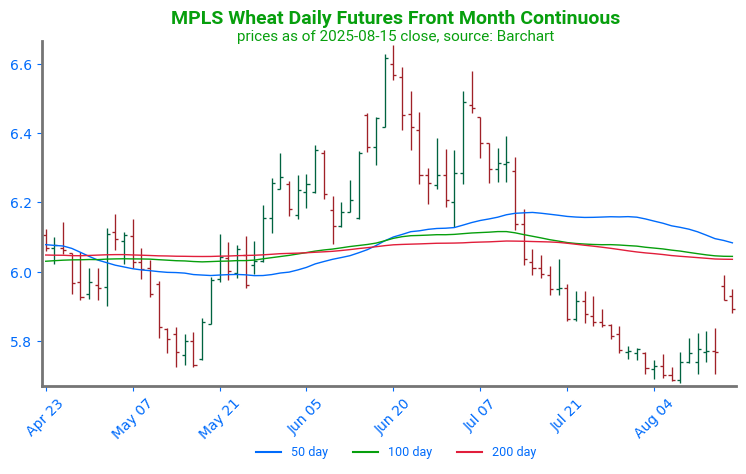
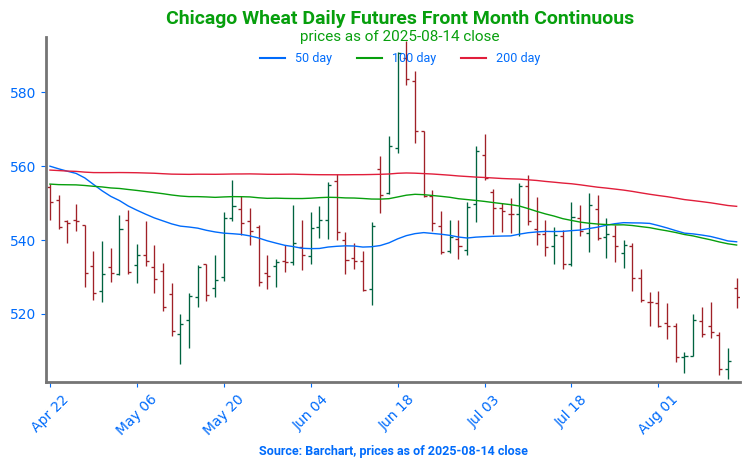
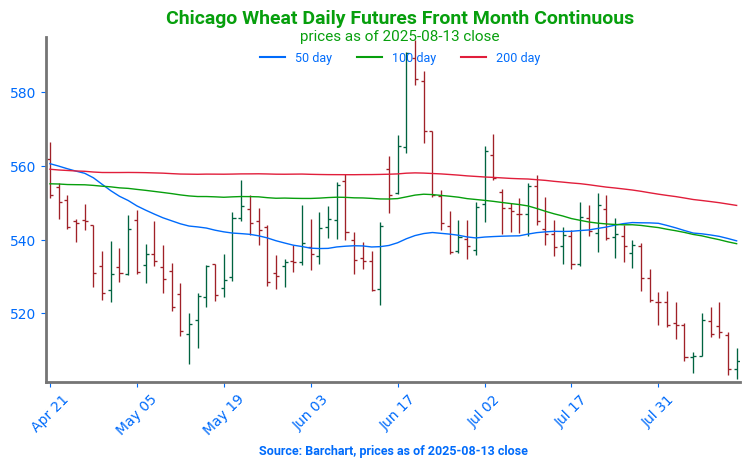
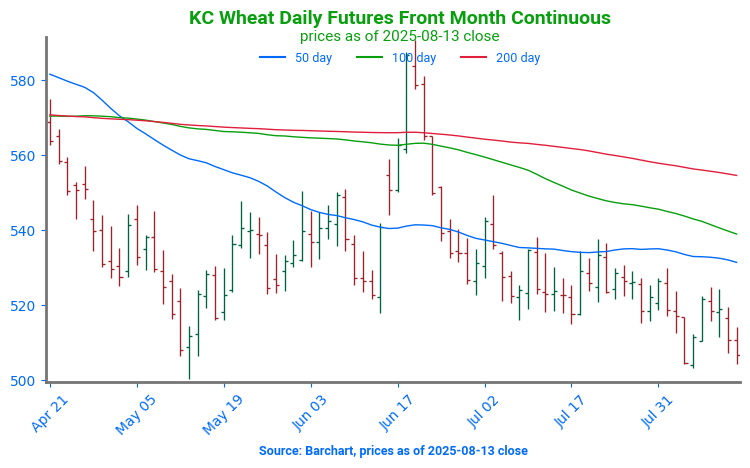
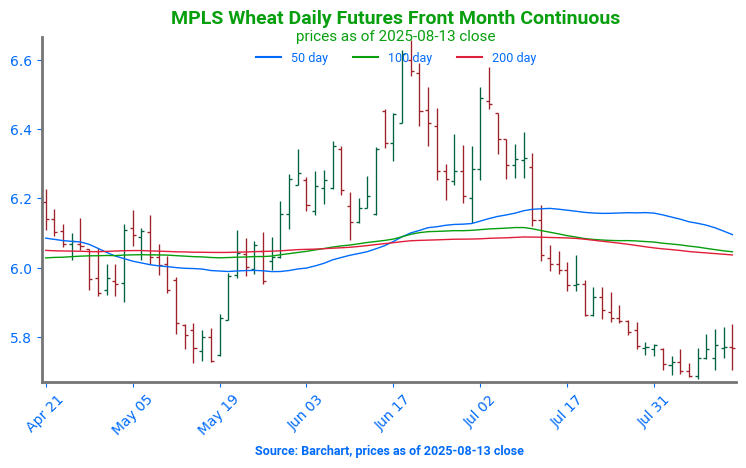
- The wheat markets are trading mixed this morning with September Chicago up 1-3/4 cents at $5.0025, Sep KC wheat down 3/4 cents to $4.9875, and September Mpls wheat up 1-1/2 cents to $5.7000.
- USDA may be overstating world wheat trade by 8-10 mmt; Argentina and Australia futures hit new lows; EU exports down 14% vs last year.
- Russia’s Jul-Aug exports off 38% yoy as new vessel approval rules stall loadings; terminals overflowing with 120 ships awaiting clearance.
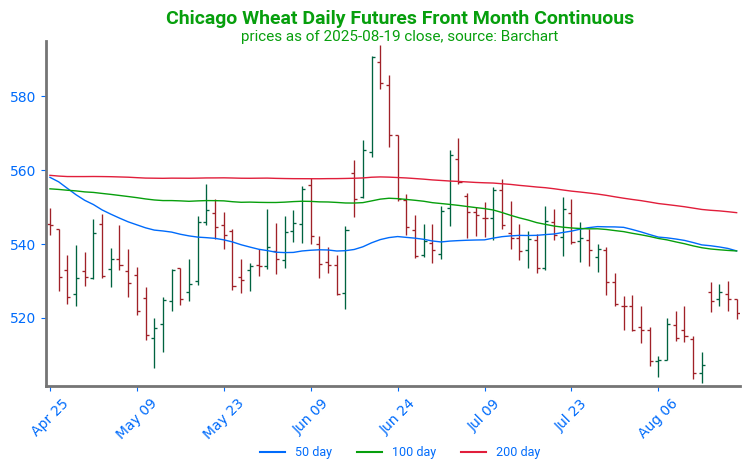
Chicago Wheat Holds Range: Chicago wheat’s mid-June rally was short-lived, with futures retreating back toward the upper end of their 2025 trading range. Initial support lies just above 500, the early-August low. On the upside, a weekly close above 558 would signal renewed strength and open the door for a retest of the recent highs near 590.
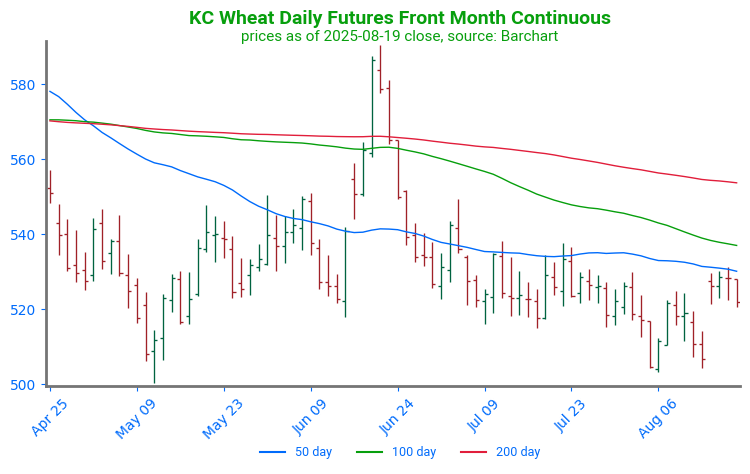
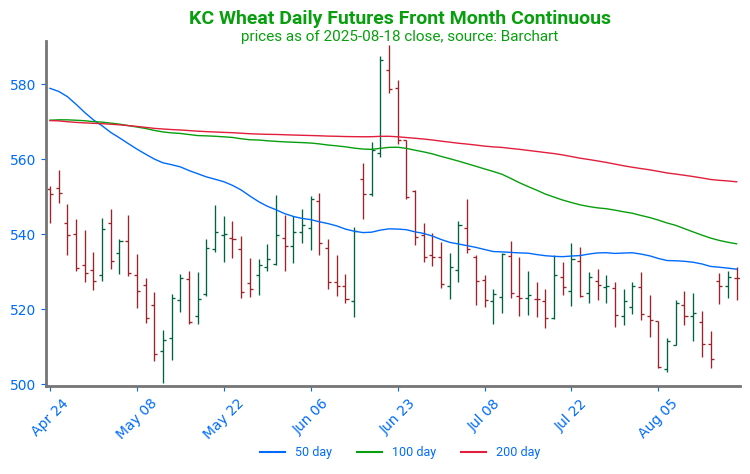
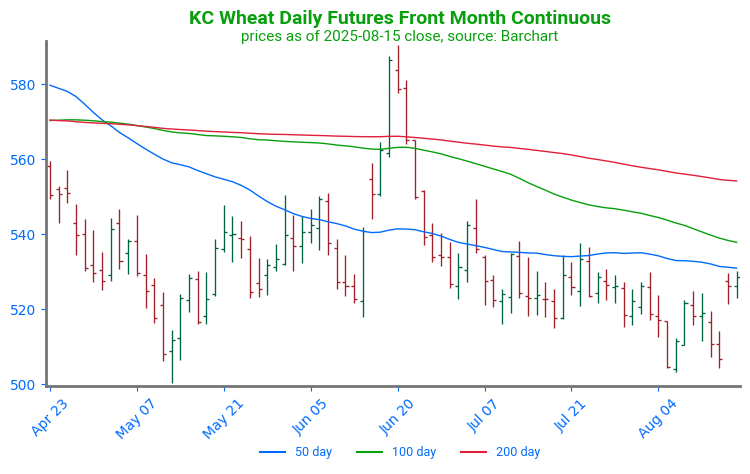
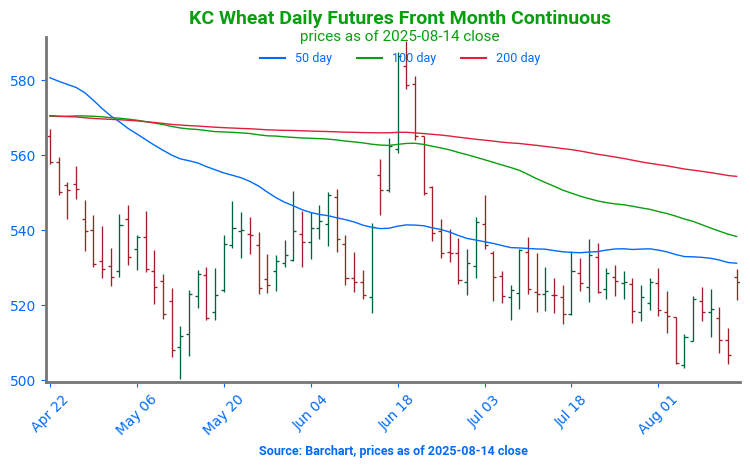
KC Wheat Continues Sideways Trend: KC wheat futures rallied sharply in June, briefly testing the April highs near 580 before weakening into month-end. The pullback pushed prices below the 50-day moving average, which now stands as key resistance on any rebound. Support is first seen at the recent lows near 505, followed by secondary support at the May low around 500.
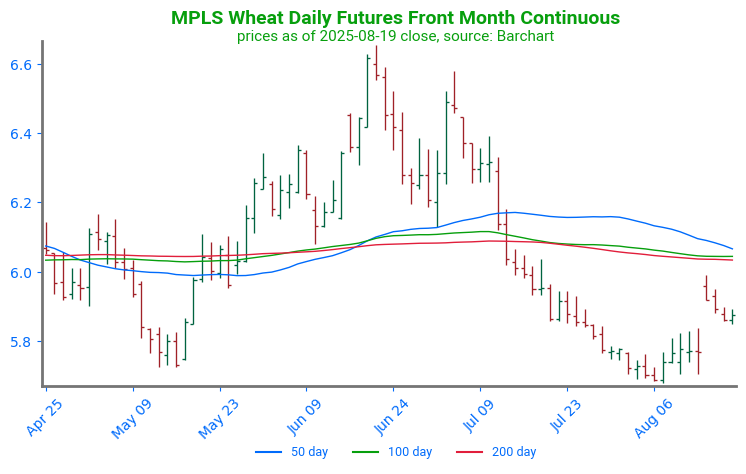
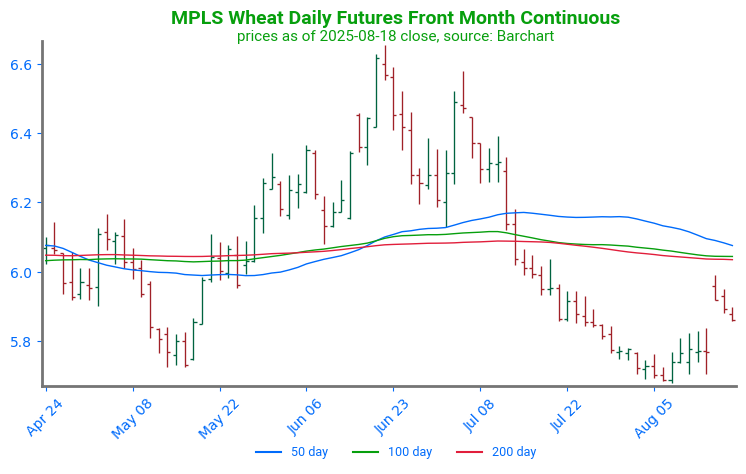
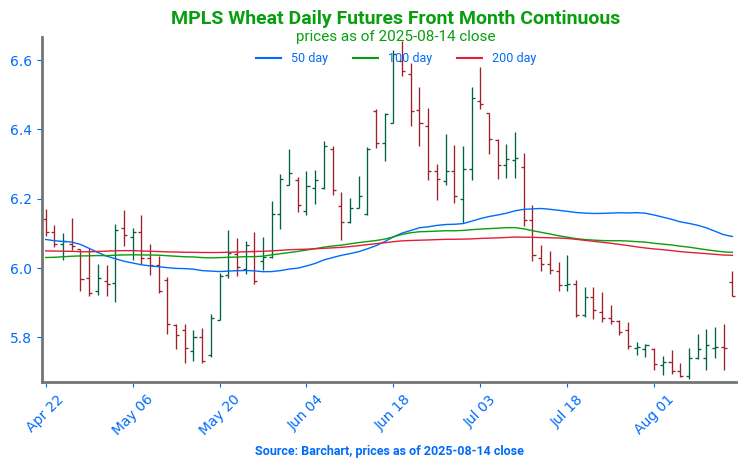
Spring Wheat Holds Below Moving Averages: Spring wheat futures faced pressure in July as crop conditions improved and weather turned favorable across key growing areas. While August has seen some support, gains remain limited. Technically, strong resistance sits just above 600 at a cluster of major moving averages, with a secondary target near 650 if momentum strengthens. On the downside, recent lows around 580 are expected to provide solid support against further weakness.
Grain Market Insider is provided by Stewart-Peterson Inc., a publishing company.
Futures and options trading involve significant risk of loss and may not be suitable for everyone. Therefore, carefully consider whether such trading is suitable for you in light of your financial condition. The data contained herein is believed to be drawn from reliable sources but cannot be guaranteed. This material has been prepared by a sales or trading employee or agent of Total Farm Marketing by Stewart-Peterson and is, or is in the nature of, a solicitation. Any decisions you may make to buy, sell or hold a futures or options position on such research are entirely your own and not in any way deemed to be endorsed by or attributed to Stewart-Peterson Inc. Reproduction of this information without prior written permission is prohibited. Hypothetical performance results have many inherent limitations. No representation is being made that any account will or is likely to achieve profits or losses similar to those shown. The data contained herein is believed to be drawn from reliable sources but cannot be guaranteed. Reproduction and distribution of this information without prior written permission is prohibited. This material has been prepared by a sales or trading employee or agent of Total Farm Marketing and is, or is in the nature of, a solicitation. Any decisions you may make to buy, sell or hold a position on such research are entirely your own and not in any way deemed to be endorsed by or attributed to Total Farm Marketing.
Stewart-Peterson Inc., Stewart-Peterson Group Inc., and SP Risk Services LLC are each part of the family of companies within Total Farm Marketing (TFM). Stewart-Peterson Inc. is a publishing company. Stewart-Peterson Group Inc. is registered with the Commodity Futures Trading Commission (CFTC) as an introducing broker and is a member of National Futures Association. SP Risk Services LLC is an insurance agency. A customer may have relationships with any or all three companies.