3-19 Opening Update: Grains Trading Higher After New Middle Eastern Attacks Target Oil Fields


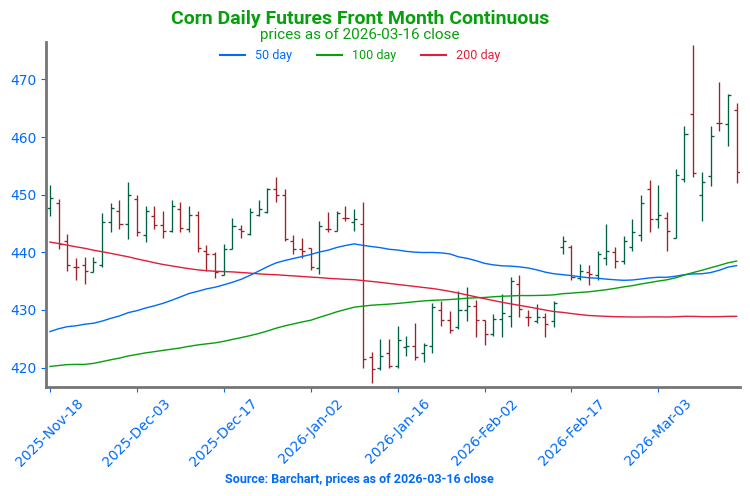
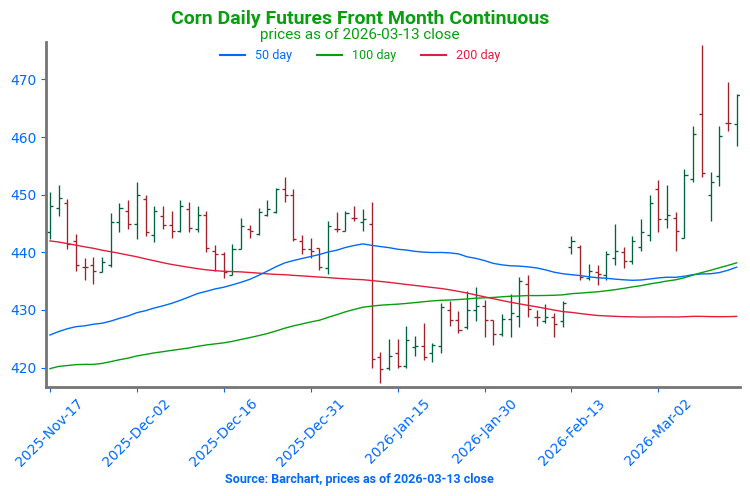
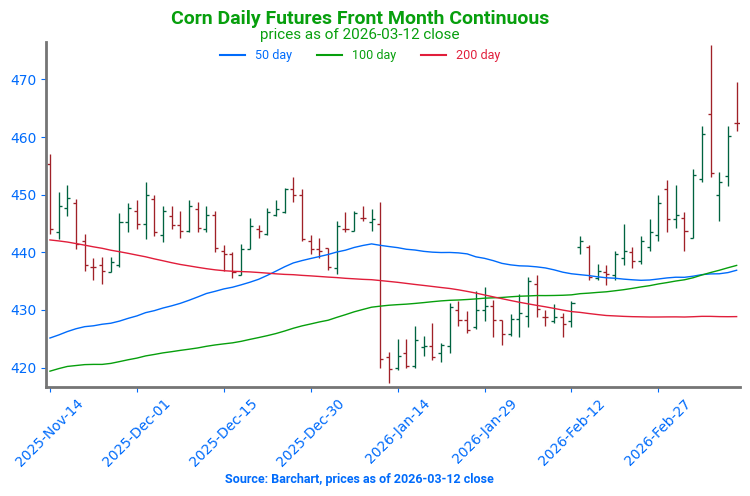
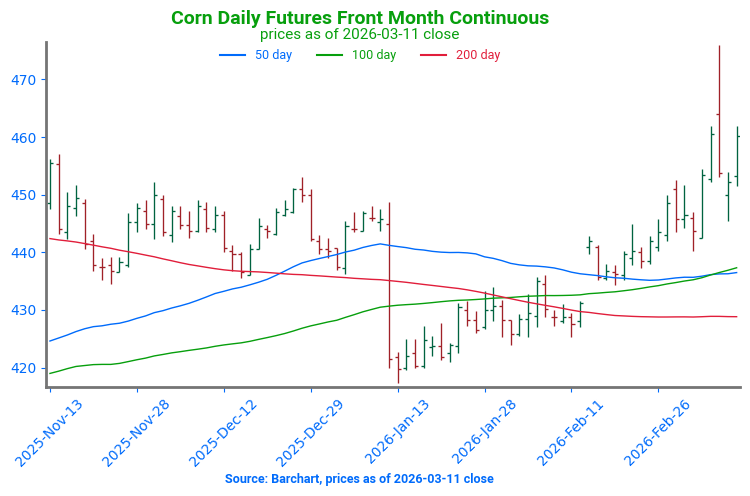
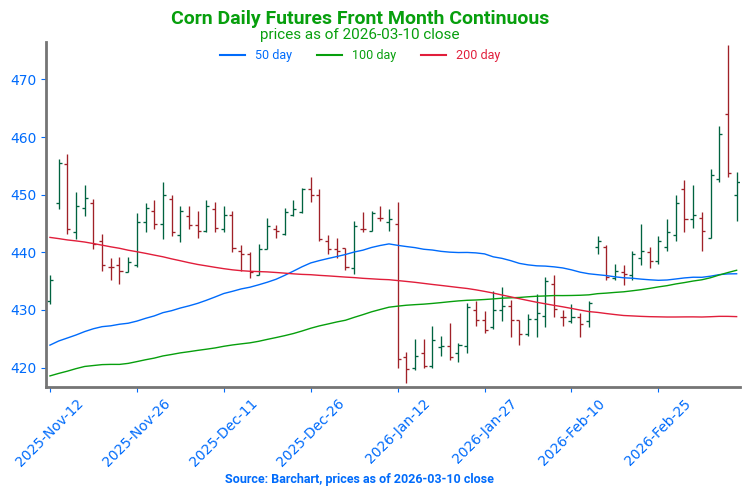
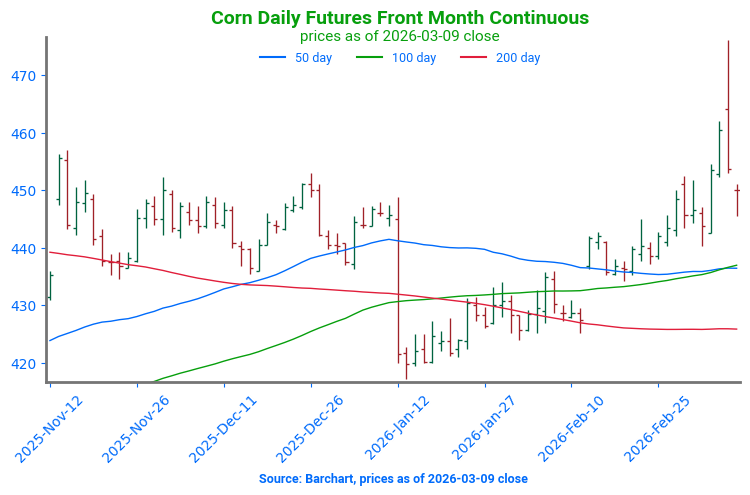
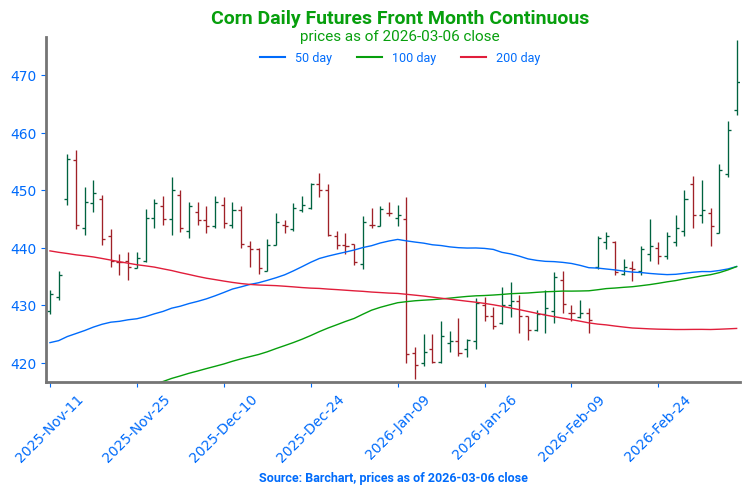
- Corn futures are trading higher this morning as higher crude oil prices support both corn and soybeans. May corn is up 5-3/4 cents to $4.69 while December is up 5-1/4 cents to $4.95.
- S&P Global is estimating that the US will plant 95.2 million acres of corn in 2026. This would be up slightly from its last estimate but would be down from 98.8 ma last year. More acres could shift to soybeans if locking in fertilizer remains difficult.
- Estimates for today’s export sales report see corn sales in a range between 700k and 2,000k tons as of March 12. The average guess is 1,350k tons which would compare to 1,503k a week ago and 1,558k at this time a year ago.
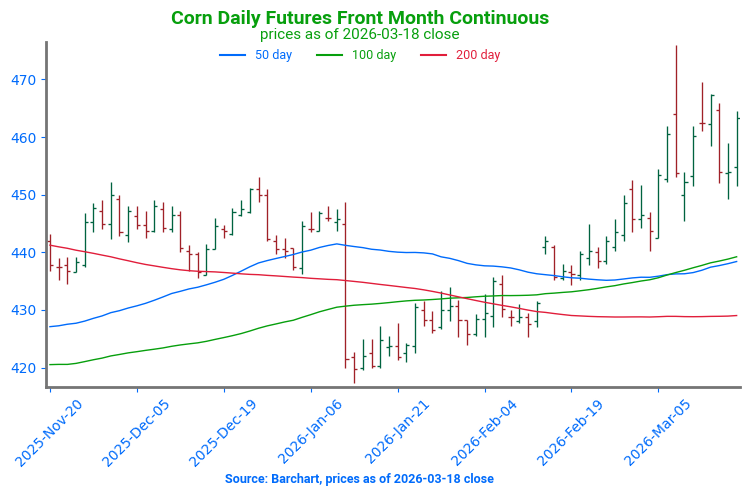
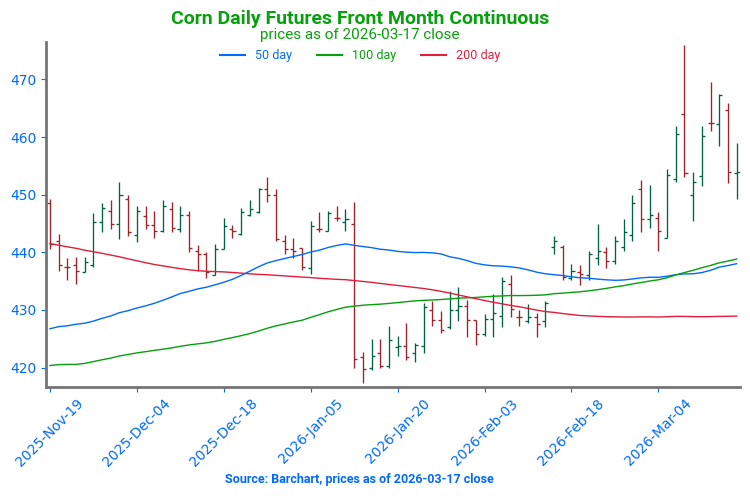
Corn Breaks Above 450: Corn futures have continued pressing higher after recently breaking through resistance near 450. That level now transitions into initial support, with secondary support found at a band of moving averages near 436. Overhead resistance is located near 495, marking the April 2025 high.

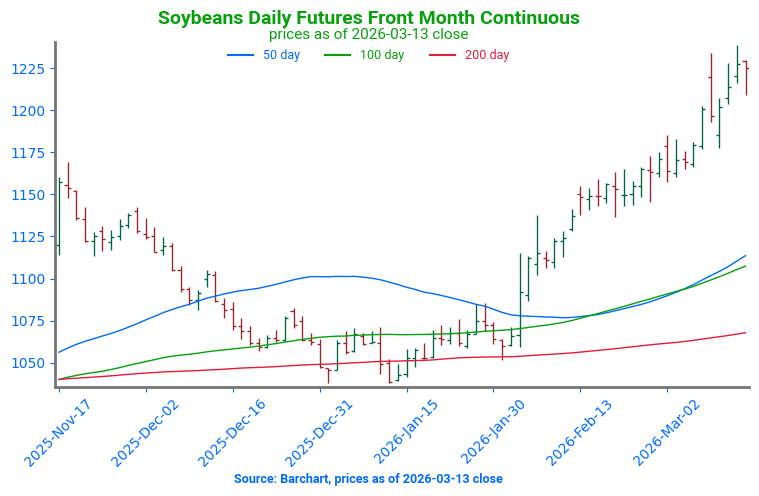
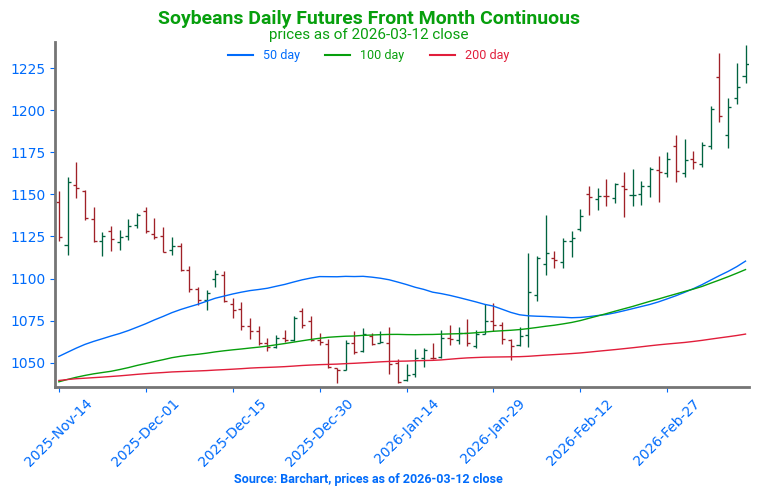
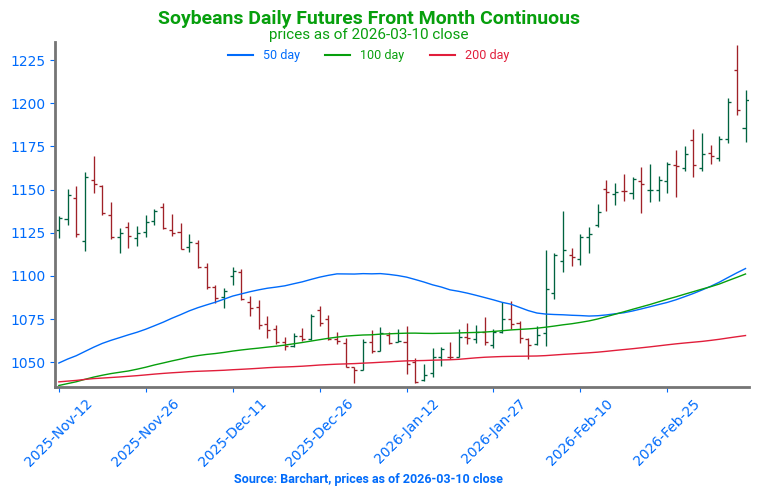
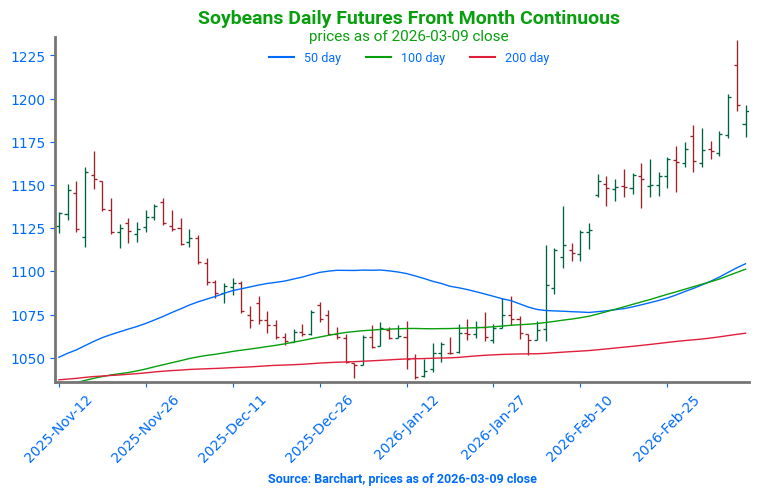
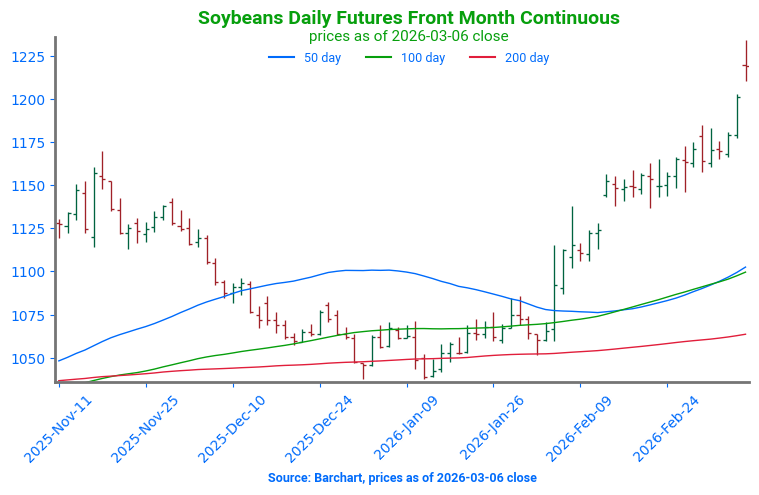
- Soybeans are trading higher this morning with support from higher crude and higher soybean meal, and gains are primarily in the back months. May soybeans are up 5 cents to $11.6-3/4 while November is up 9-3/4 cents to $11.51-1/4. May soybean meal is up $5.60 to $327.20 and soybean oil is up 0.17 cents to 65.69 cents.
- Overnight, Israel attacked Iran’s South Pars gas field which caused Iran to retaliate by attacking another gas field. Crude oil spiked to $110 a barrel on this news, and President Trump said that he would “blow up” the entire South Pars gas field if Iran continued to attack Qatar.
- Estimates for today’s export sales report see soybean sales in a range between 300k and 800k tons with an average guess of 431k tons. This would compare to 457k last week and 353k tons a year ago at this time.
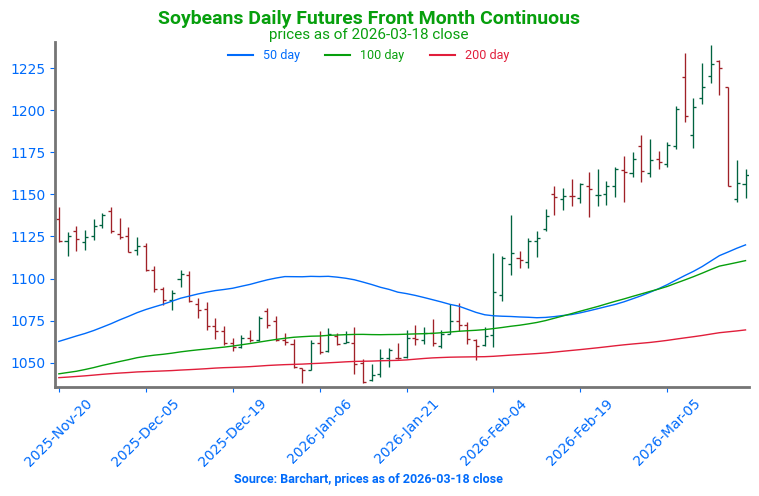
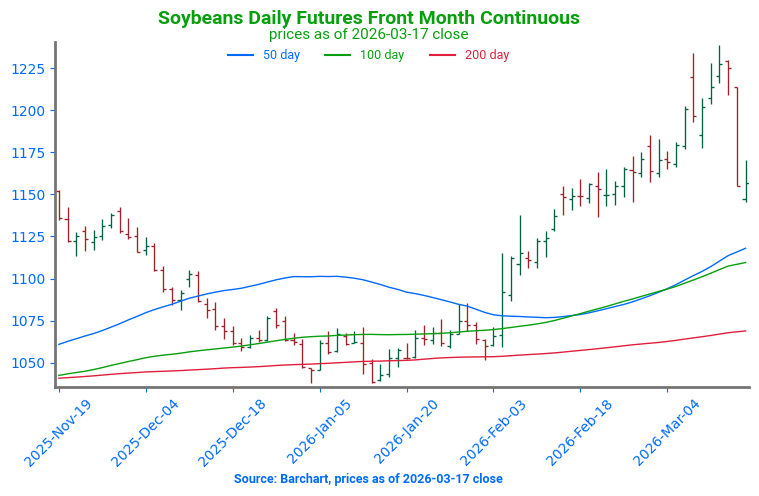
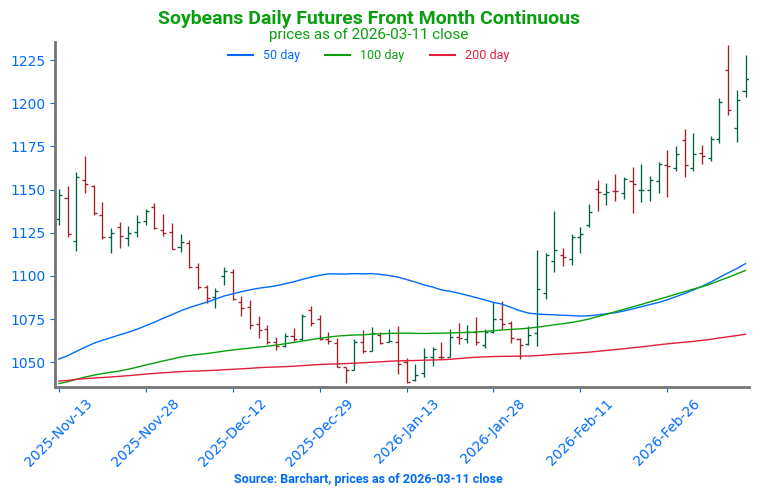
Soybeans Test 1200: Soybean futures have received support from strength in the energy markets in recent sessions. Prices are currently challenging psychological resistance near 1200 and have been fluctuating around that level. A break above would expose the next resistance area near 1258, marking the May 2024 high. Support is located underneath the market near 1168, tied to the prior November high.

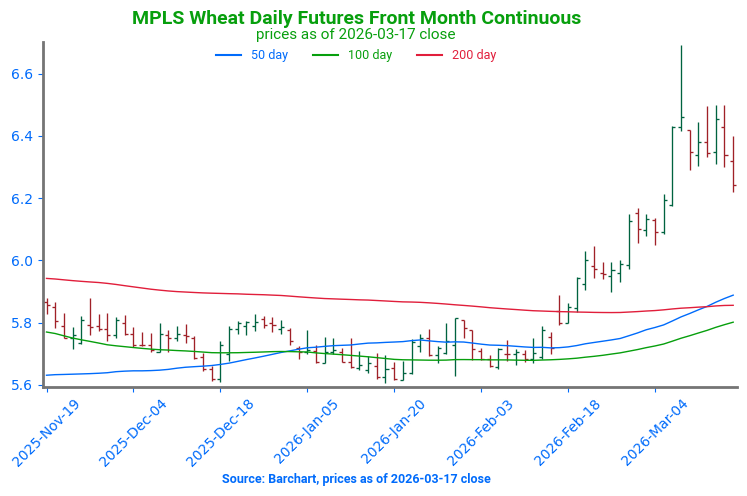
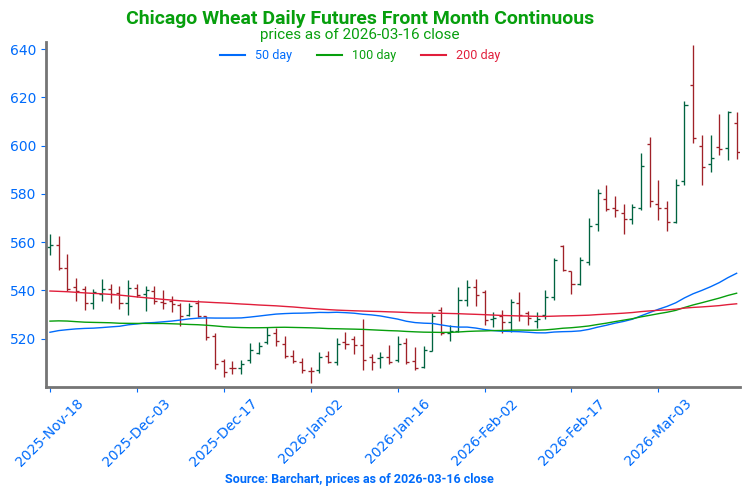
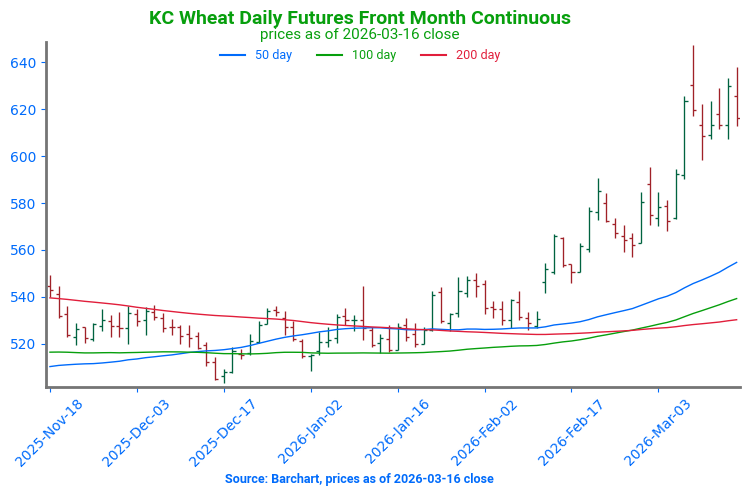
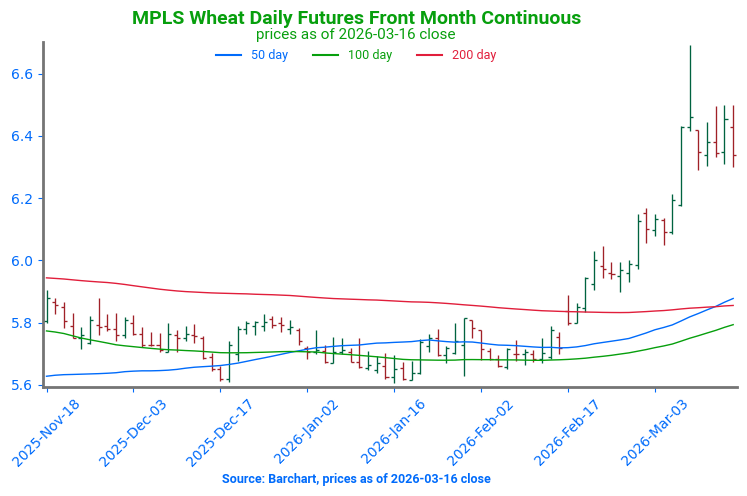
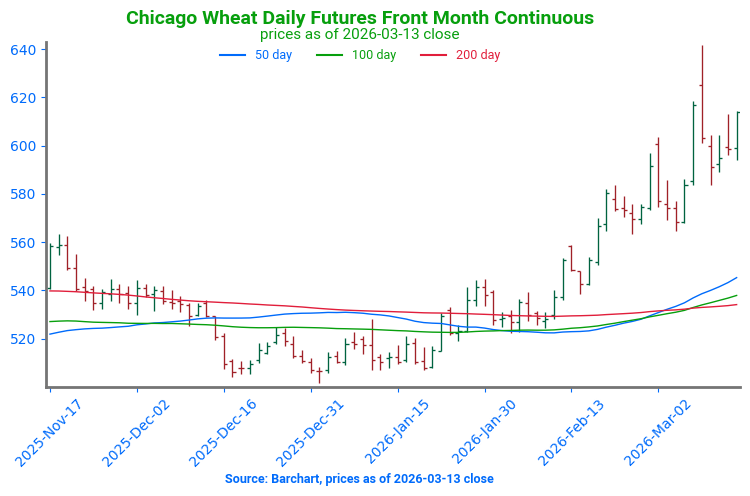
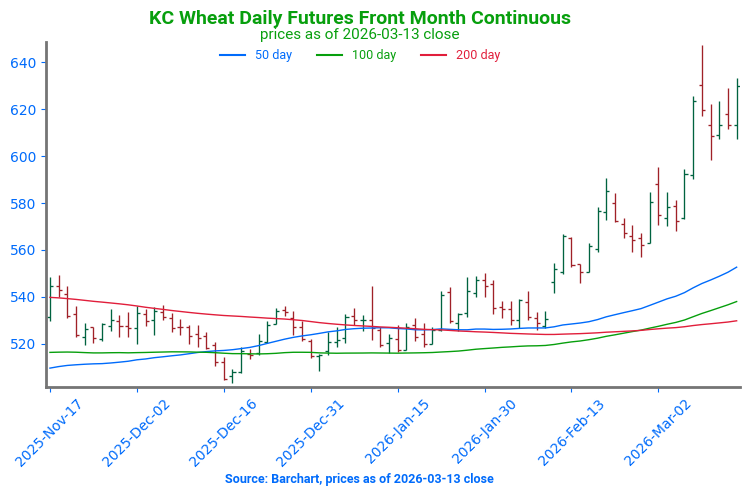
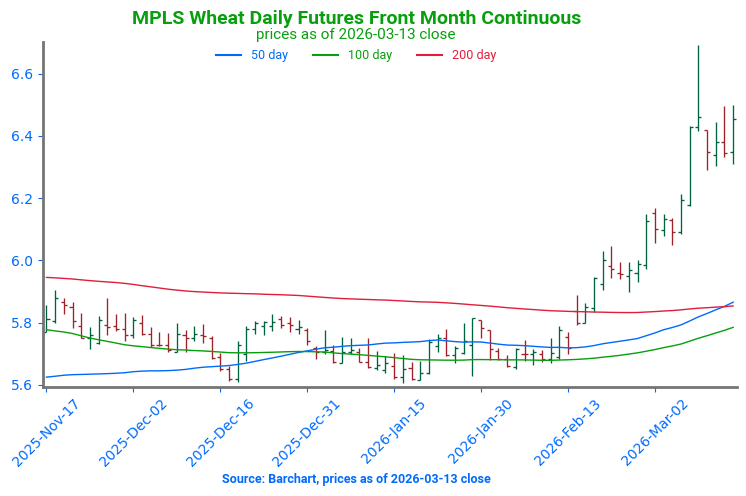
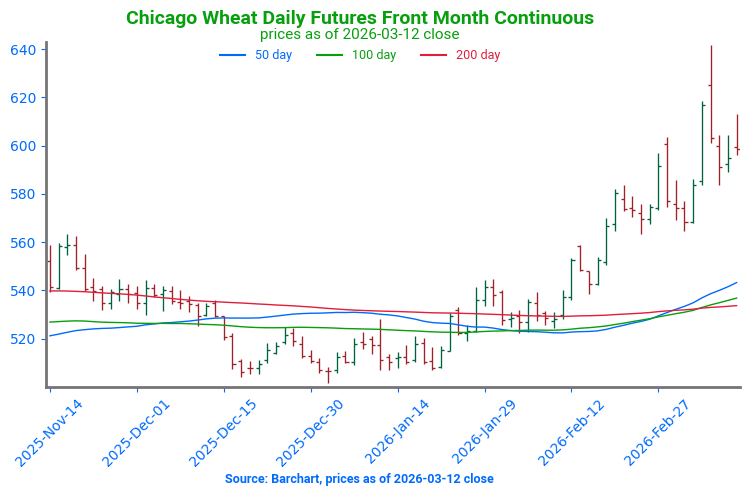
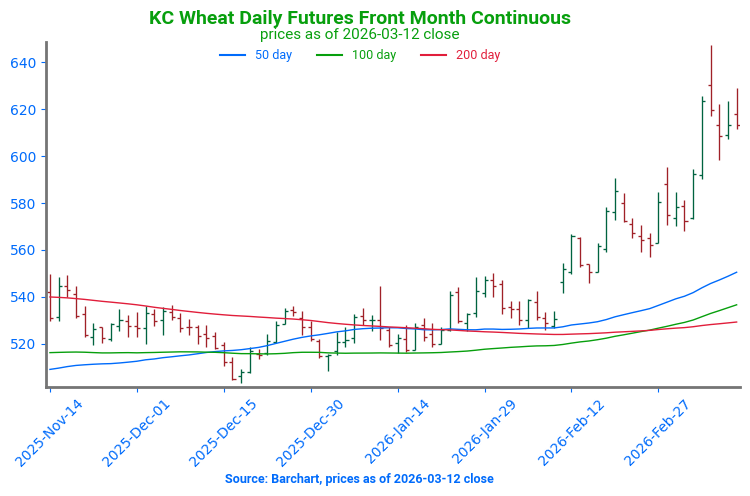
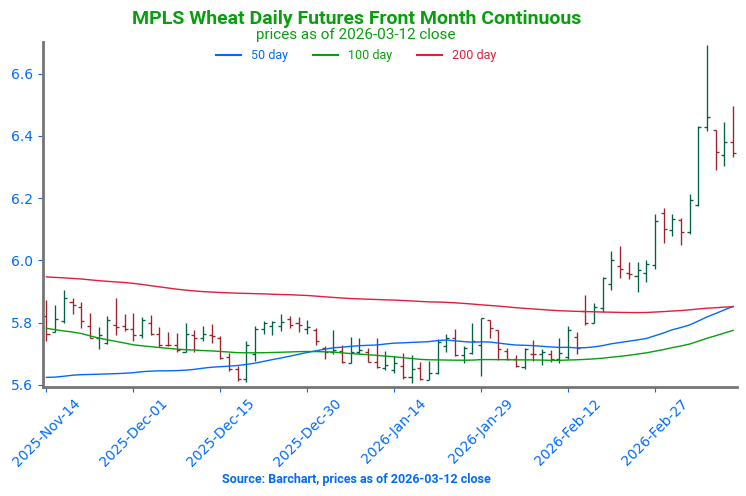
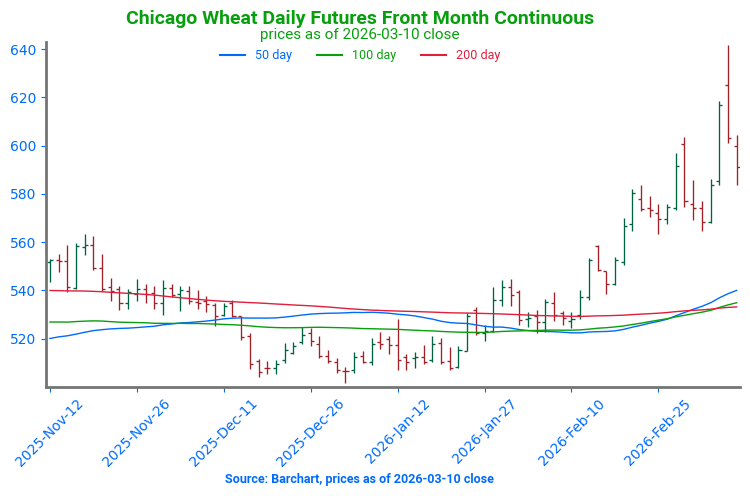
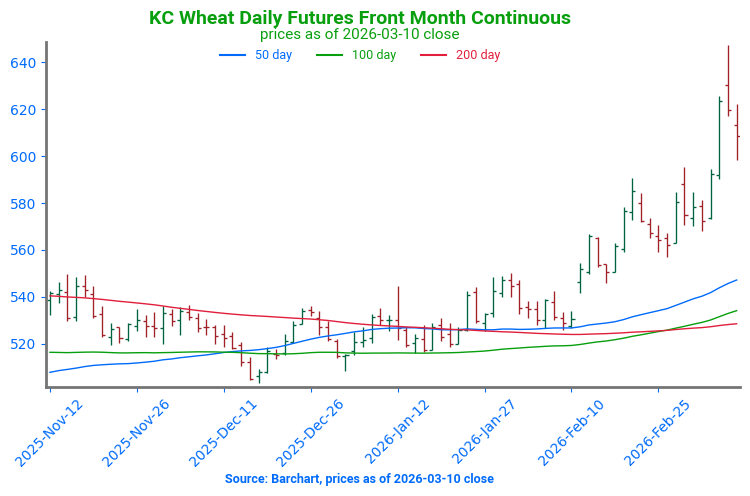
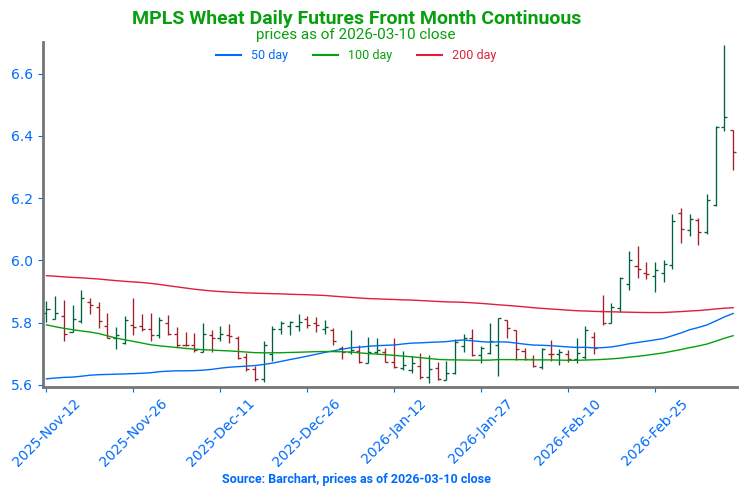
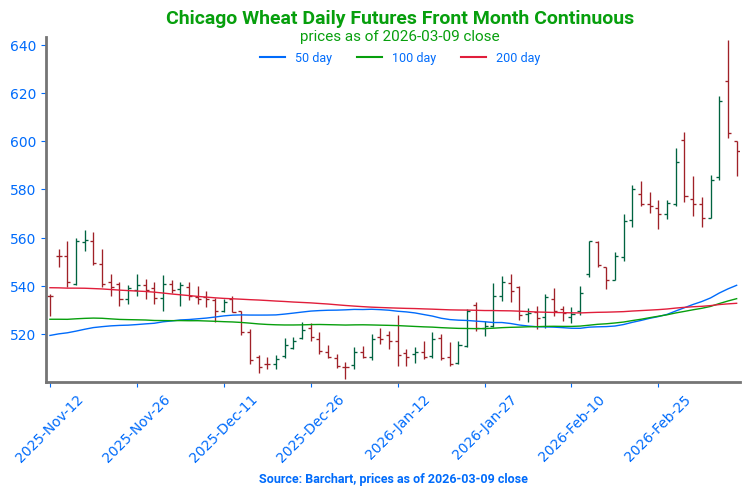
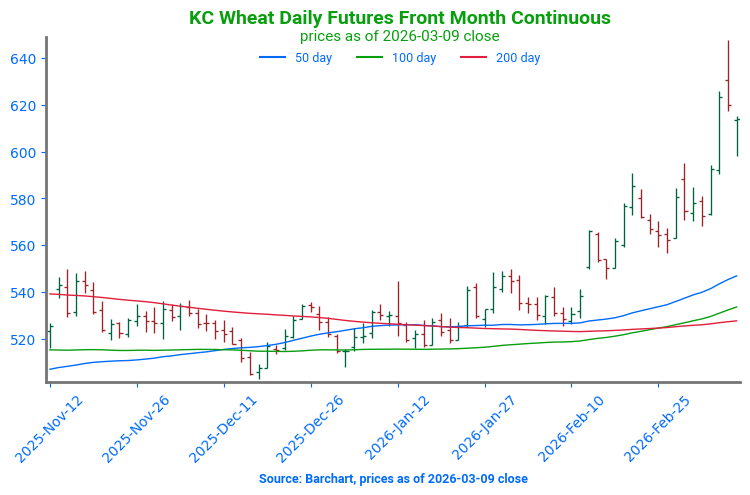
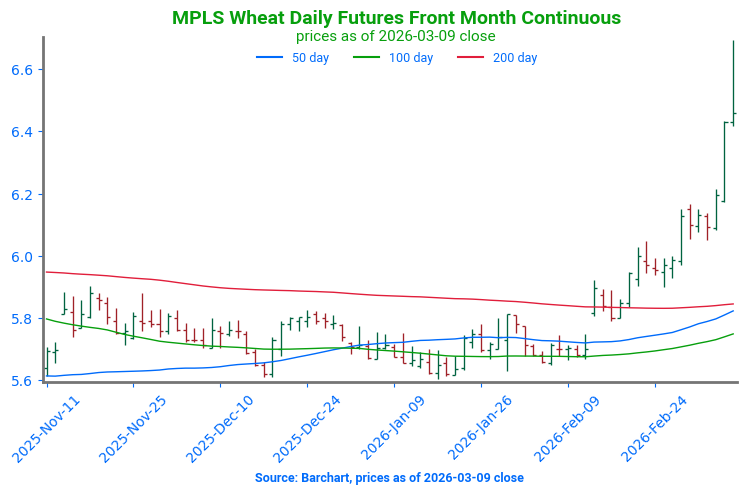
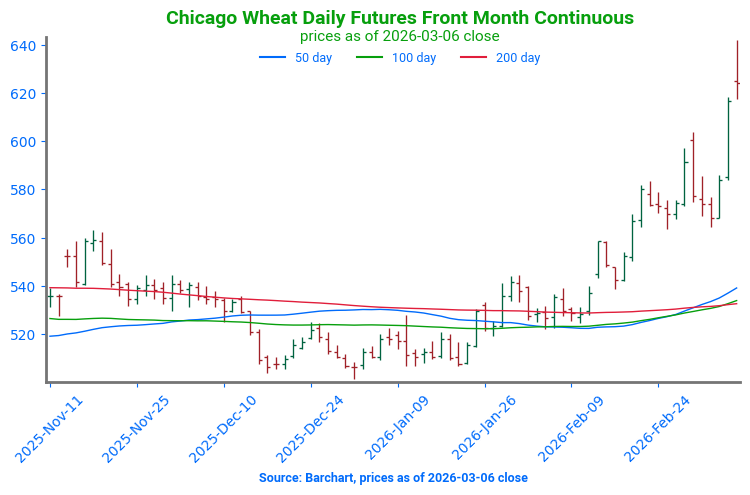
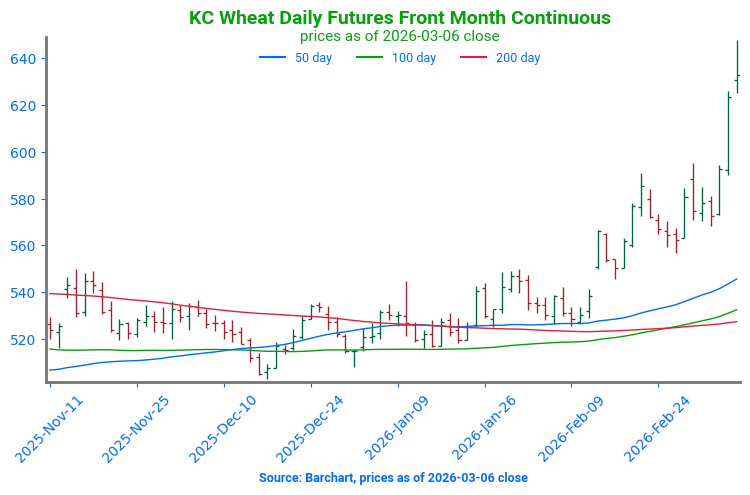
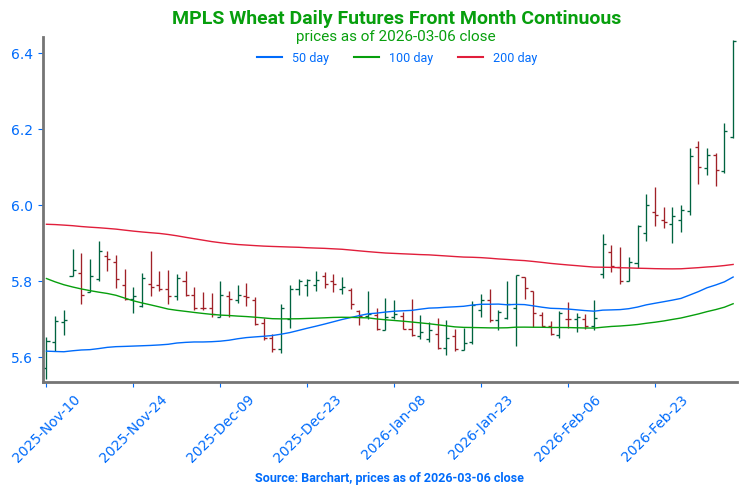
- All three wheat classes are trading higher to start the day with May Chicago wheat up 9-3/4 cents to $6.14, KC wheat up 6-3/4 cents to $6.32-3/4, and Minn wheat up 8-3/4 cents to $6.46 as fund money flows into commodities.
- Russian wheat production for the 26/27 marketing year is expected to rise to 84.0 mmt which would be up 3% from previous estimates as analysts cite favorable weather conditions improving yields.
- Estimates for today’s export sales report see wheat sales in a range between 350k and 550k tons with an average guess of 400k tons. This would compare to last week’s 455k tons and 242k tons a year ago at this time.
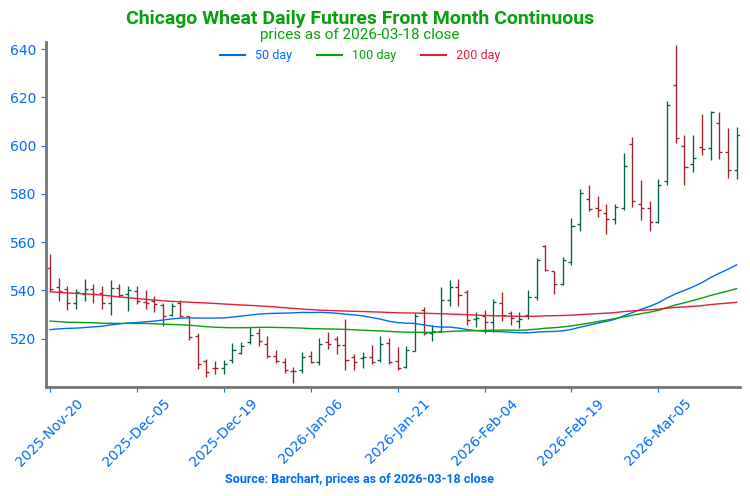
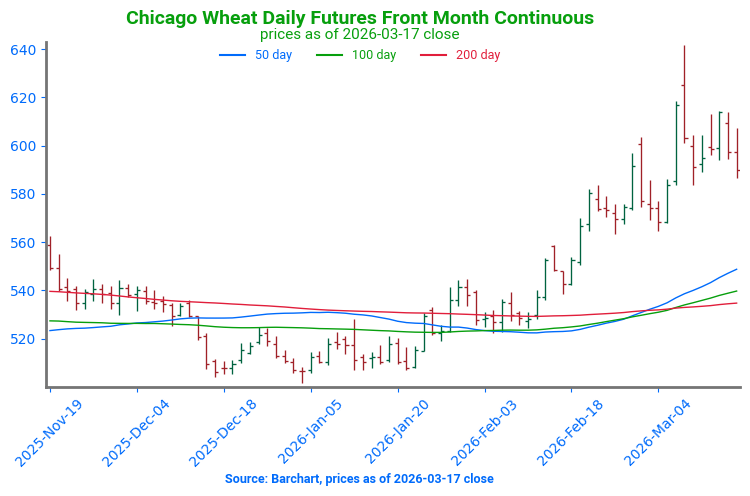
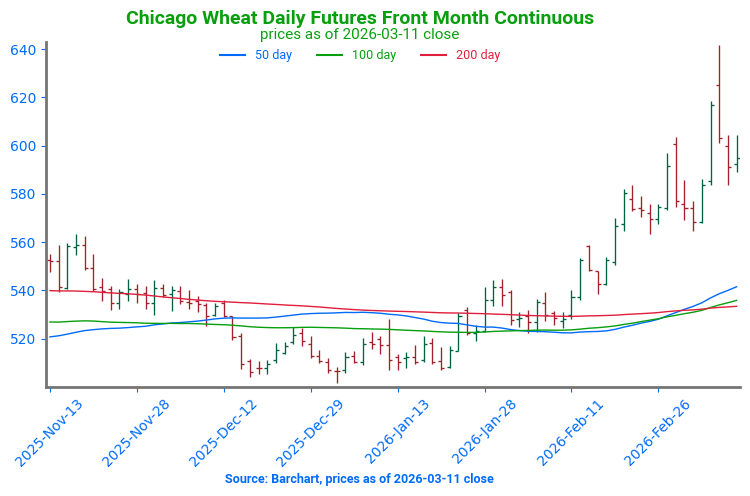
Chicago Wheat Extends Rally: Chicago wheat futures have continued their upward momentum in recent sessions, breaking above the June 2025 high near 594. Prices are now testing resistance near 620, tied to the February 2025 high. Chart support is located underneath the market near 566.
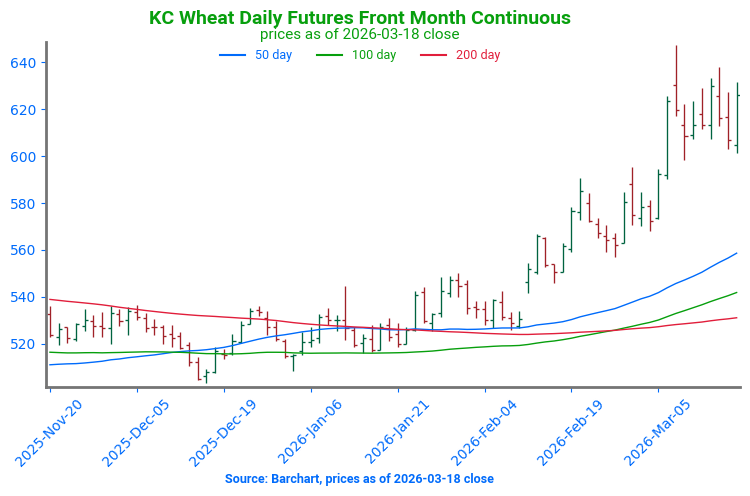
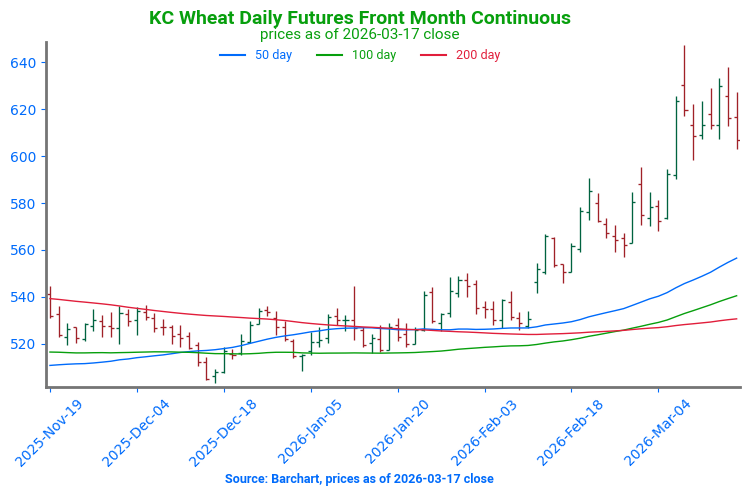
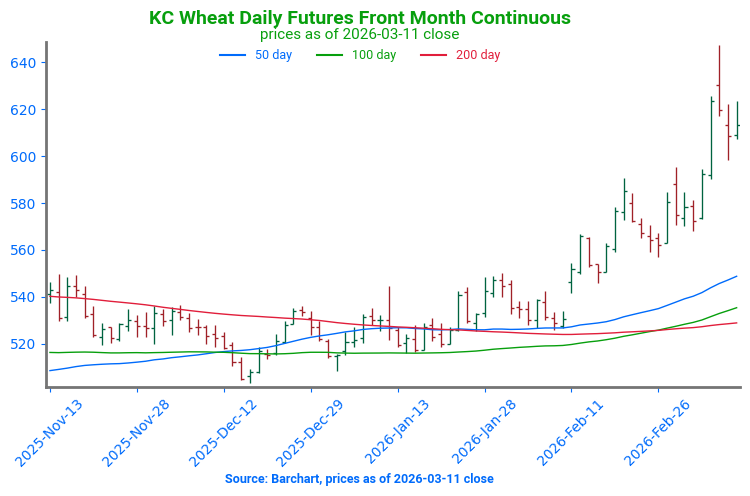
KC Wheat Tests 640: Kansas City wheat futures have continued pressing higher in recent sessions, with prices now challenging structural resistance near 640, tied to the February 2025 high. Chart support is located underneath the market near 557.
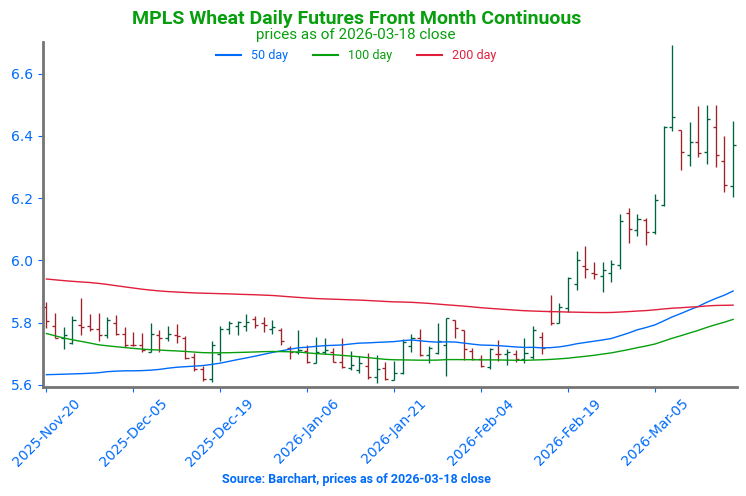
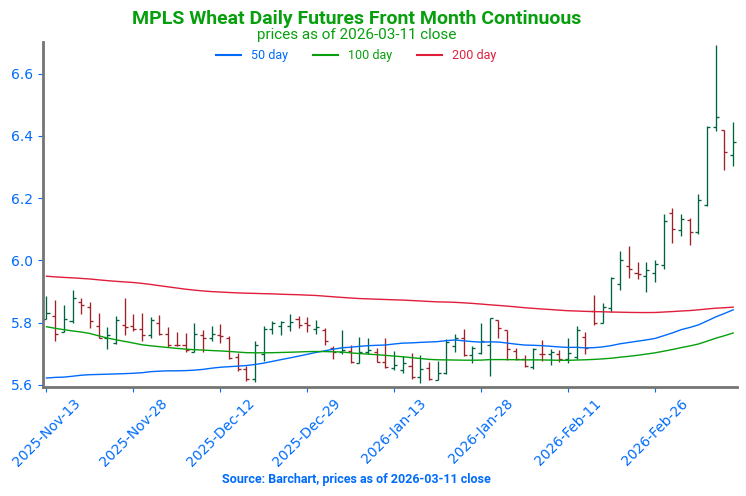
Spring Wheat Tests 650: Minneapolis wheat futures have continued surging higher, with prices now challenging structural resistance near 650. A break above this level would expose the next resistance area near 767, while chart support is located underneath the market near 605.
Grain Market Insider is provided by Stewart-Peterson Inc., a publishing company.
Futures and options trading involve significant risk of loss and may not be suitable for everyone. Therefore, carefully consider whether such trading is suitable for you in light of your financial condition. The data contained herein is believed to be drawn from reliable sources but cannot be guaranteed. This material has been prepared by a sales or trading employee or agent of Total Farm Marketing by Stewart-Peterson and is, or is in the nature of, a solicitation. Any decisions you may make to buy, sell or hold a futures or options position on such research are entirely your own and not in any way deemed to be endorsed by or attributed to Stewart-Peterson Inc. Reproduction of this information without prior written permission is prohibited. Hypothetical performance results have many inherent limitations. No representation is being made that any account will or is likely to achieve profits or losses similar to those shown. The data contained herein is believed to be drawn from reliable sources but cannot be guaranteed. Reproduction and distribution of this information without prior written permission is prohibited. This material has been prepared by a sales or trading employee or agent of Total Farm Marketing and is, or is in the nature of, a solicitation. Any decisions you may make to buy, sell or hold a position on such research are entirely your own and not in any way deemed to be endorsed by or attributed to Total Farm Marketing.
Stewart-Peterson Inc., Stewart-Peterson Group Inc., and SP Risk Services LLC are each part of the family of companies within Total Farm Marketing (TFM). Stewart-Peterson Inc. is a publishing company. Stewart-Peterson Group Inc. is registered with the Commodity Futures Trading Commission (CFTC) as an introducing broker and is a member of National Futures Association. SP Risk Services LLC is an insurance agency. A customer may have relationships with any or all three companies.