10-16 Opening Update: Grains Mixed This Morning With Soybeans Leading Higher


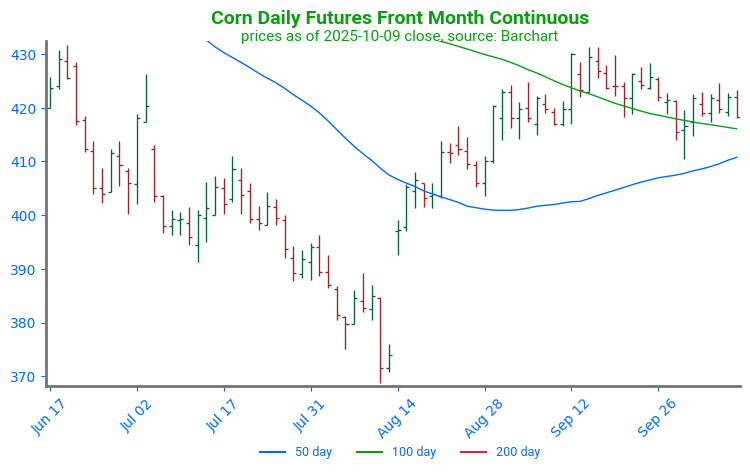
- Corn futures are trading quietly higher to start the day in more sideways action. December is up 1/4 cent to $4.17 and March is up 1/4 cent as well to $4.32-1/2. So far this week, corn has gained 4 cents.
- Brazilian corn production for 25/26 is estimated between 128.9 and 148.2 mmt with an average guess of 138.4 mmt as strong demand drives the expansion of acreage. This estimate is above the USDA’s most recent guess of 131 mmt.
- Estimates for this week’s ethanol production report see production higher than last week at 1.079 million barrels per day and stockpile estimates lower at 22.628m bbl bs 22.72m a week ago.
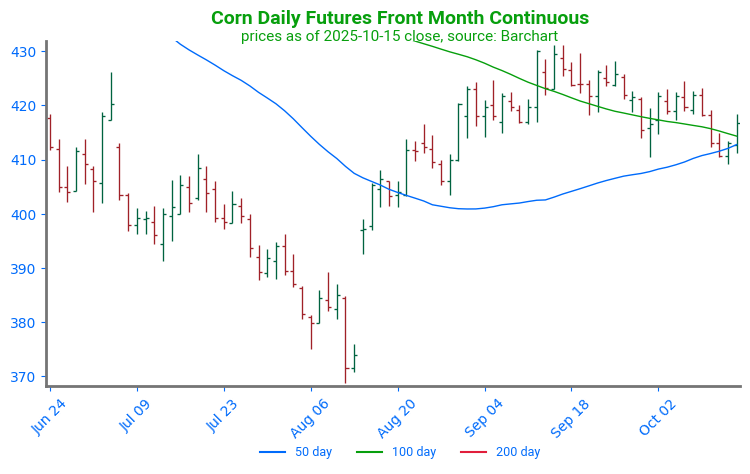
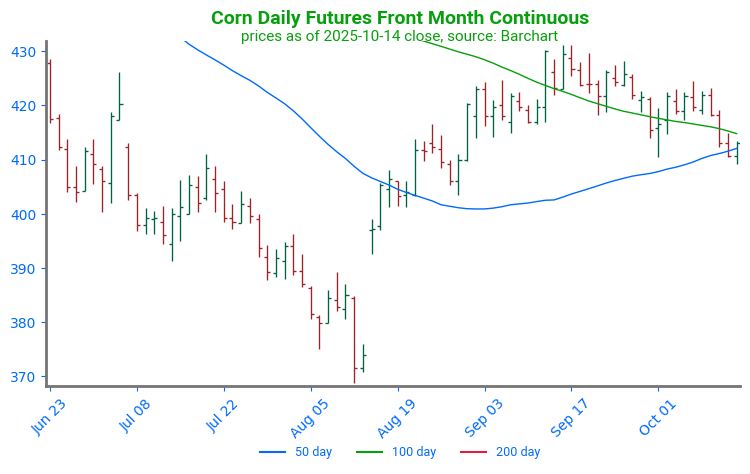
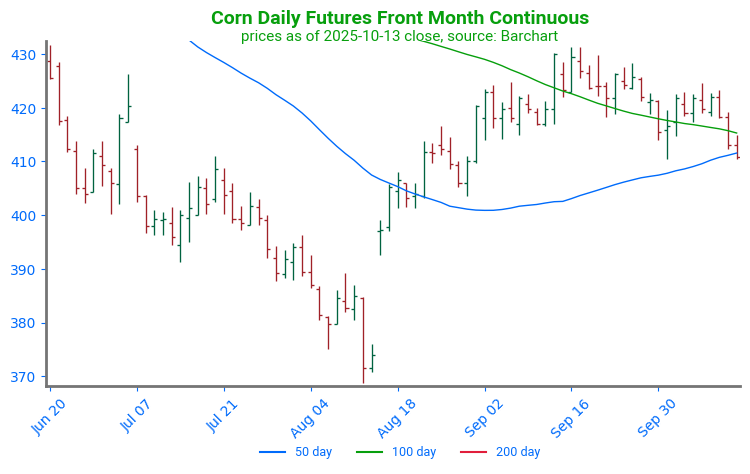
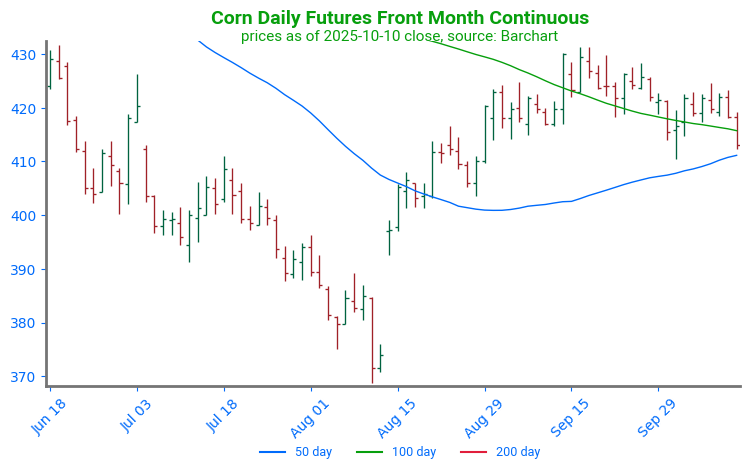
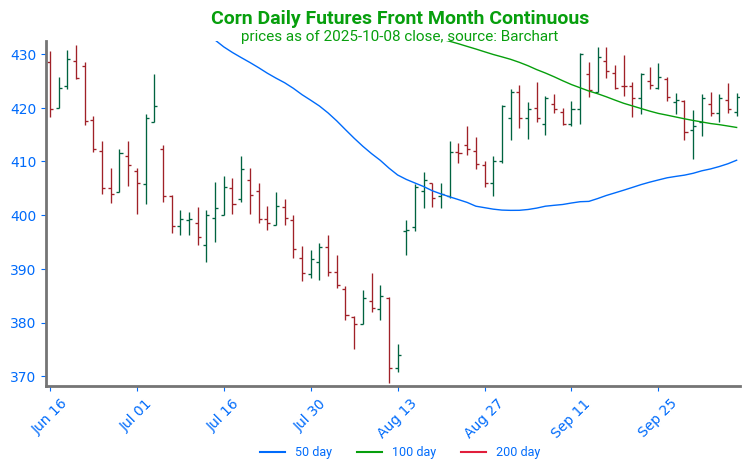
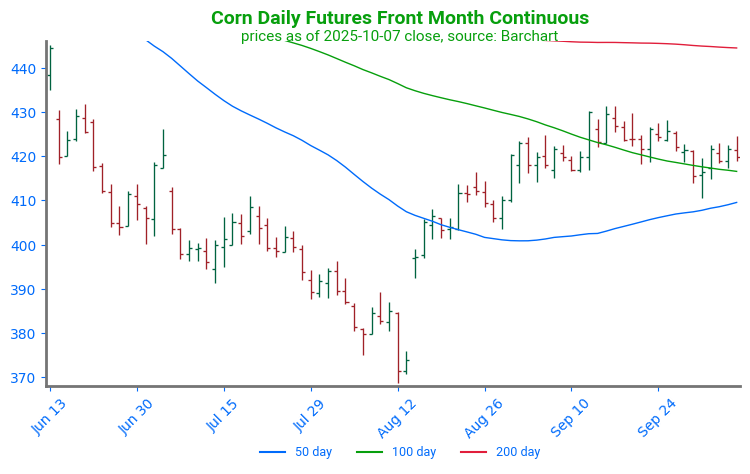
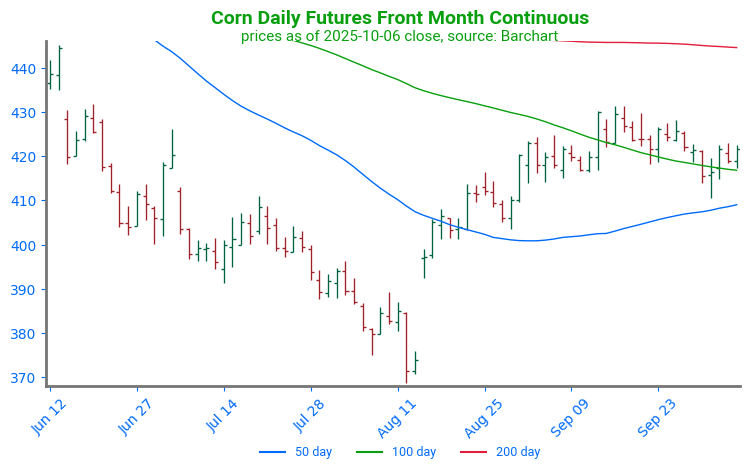
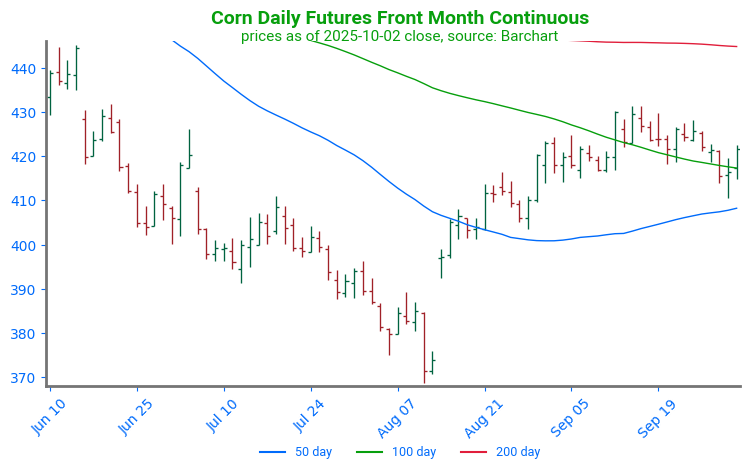
Corn Futures Find Support: Corn futures have trended sideways to lower over the past month, pressured by harvest selling and the bearish September Grain Stocks report. The market found support in the 50-day moving average and October 1 low. The market was able to close above the 100-day moving average, which will now offer support.

- Soybean futures are higher this morning following bullish crush numbers yesterday. November is up 4-1/2 cents at $10.11 and March is up 4-3/4 at $10.44-1/2. December soybean meal is up $0.30 to $276.20 and December bean oil is up 0.39 cents to 51.19 cents.
- The NOPA crush report for September showed US soybean crush topping estimates at 197.86 million bushels which was up 4.2% from August and up 11.6% from September last year. Domestic demand is encouraging given Chinese absence.
- China has held off on large purchases of Brazilian soybeans for December and January delivery as a result of high Brazilian premiums. China still needs roughly 9 mmt of soybeans and could tap into state reserves to meet short term needs.
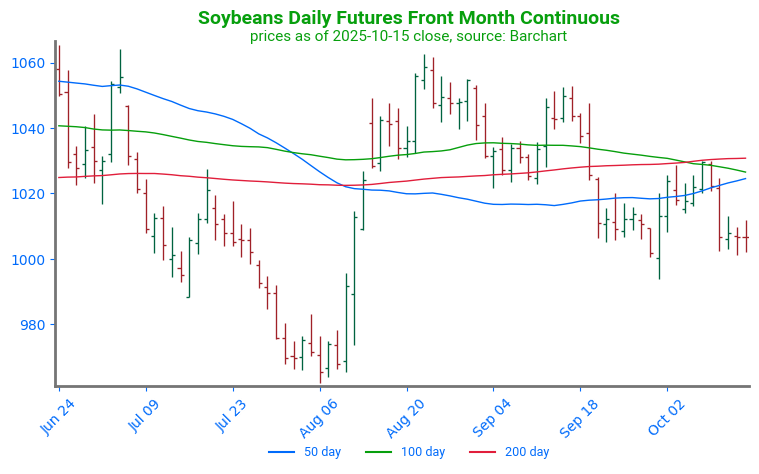
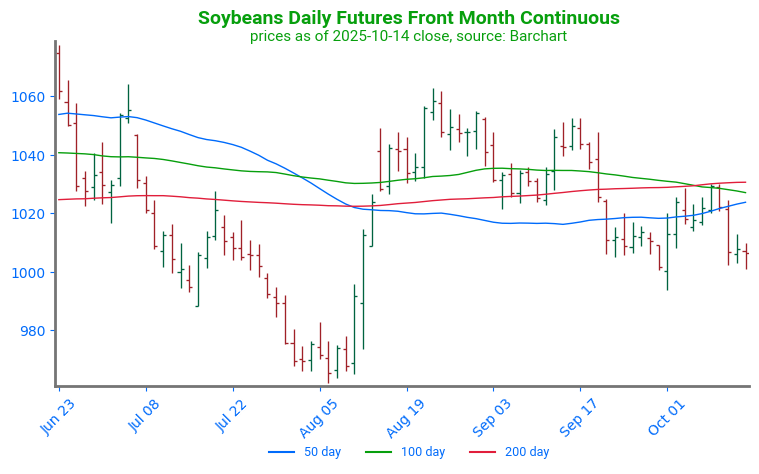
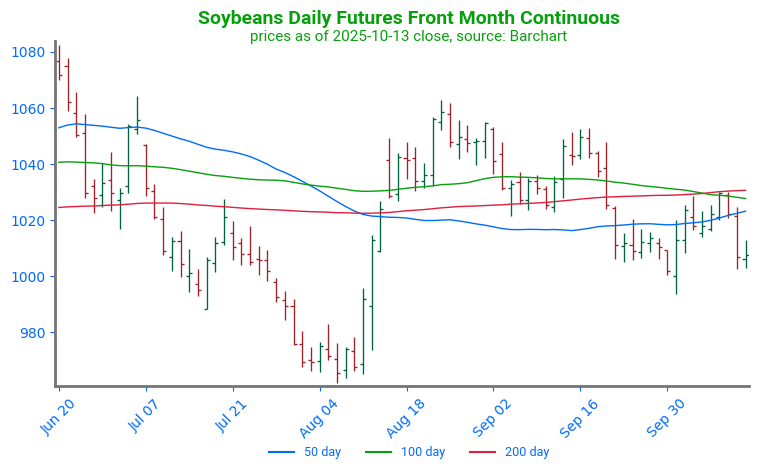
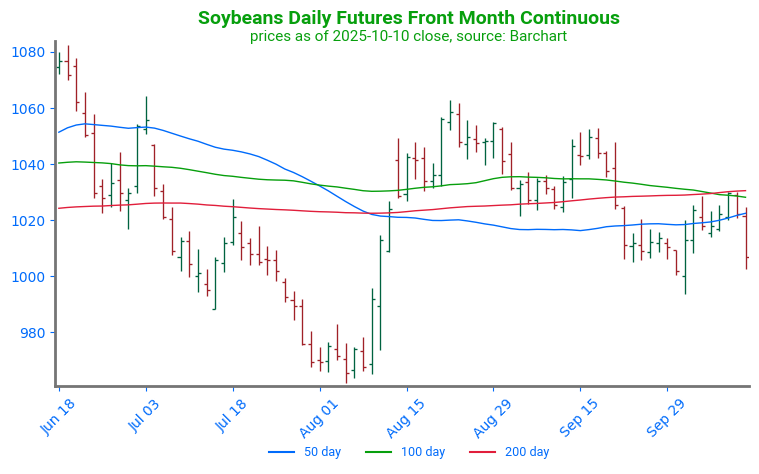
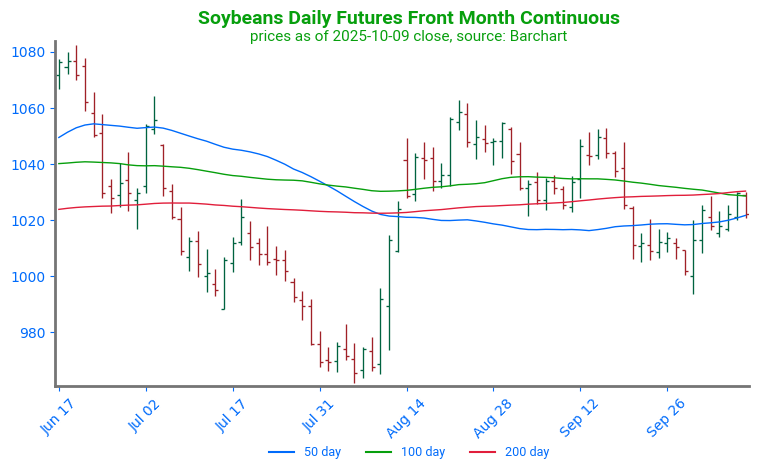
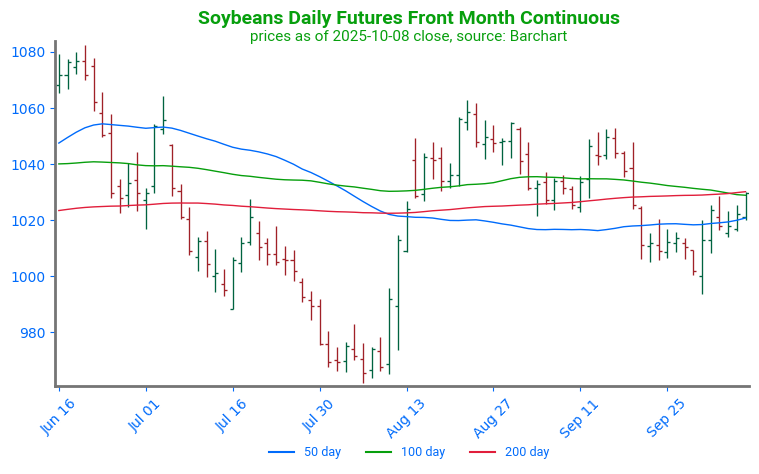
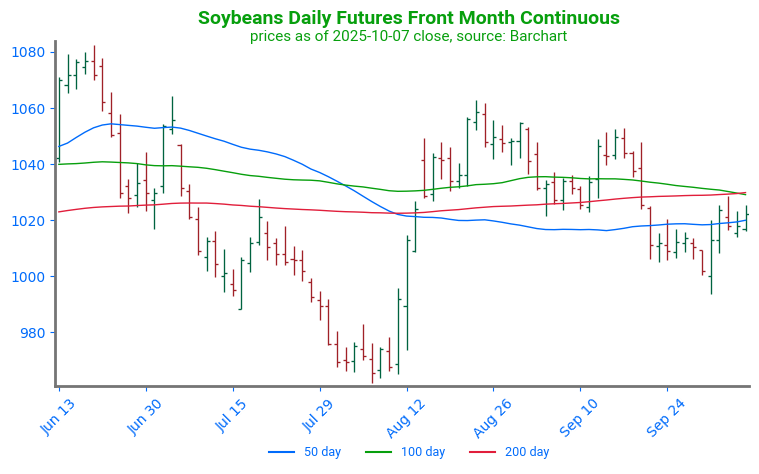
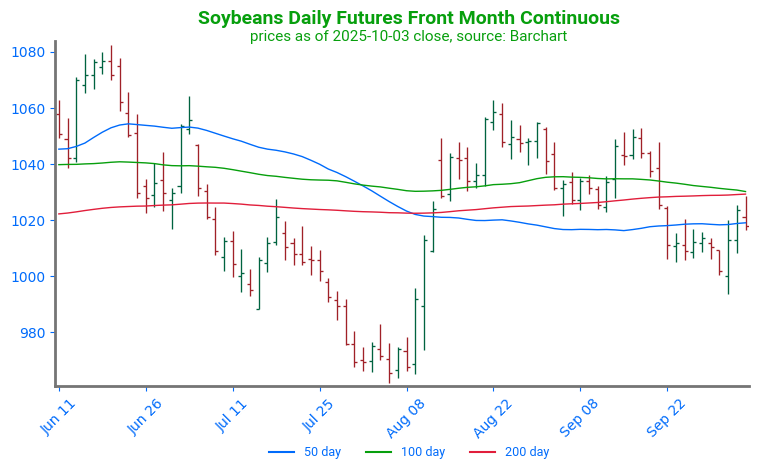
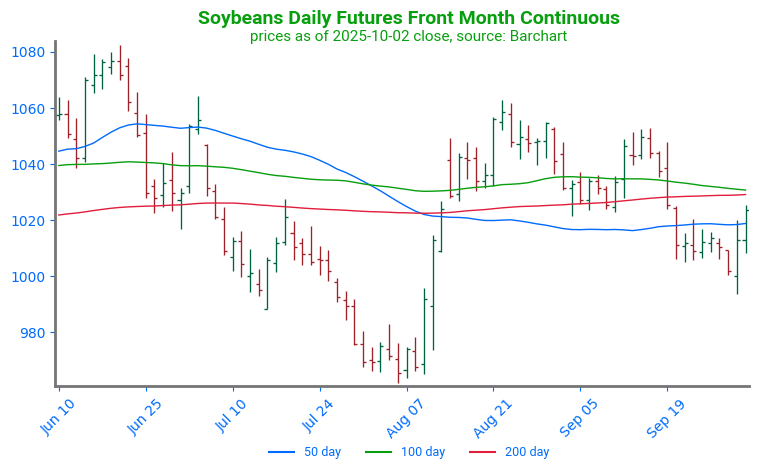
Soybeans Fail to Break Resistance: Soybean futures have pressed lower following concerns of worsening trade relations between the U.S. and China. Following this news, soybean futures fell away from a zone of strong technical resistance and have since traded sideways as the market awaits additional information. The first point of technical support lies at the psychological level of 1000, with a secondary point of trend support near 974.

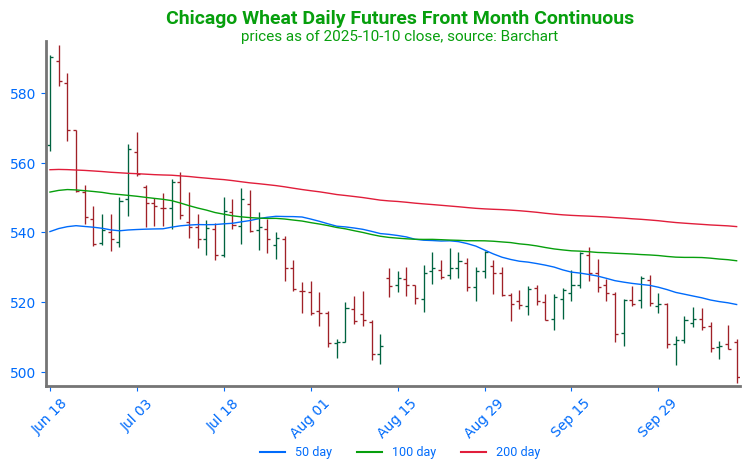
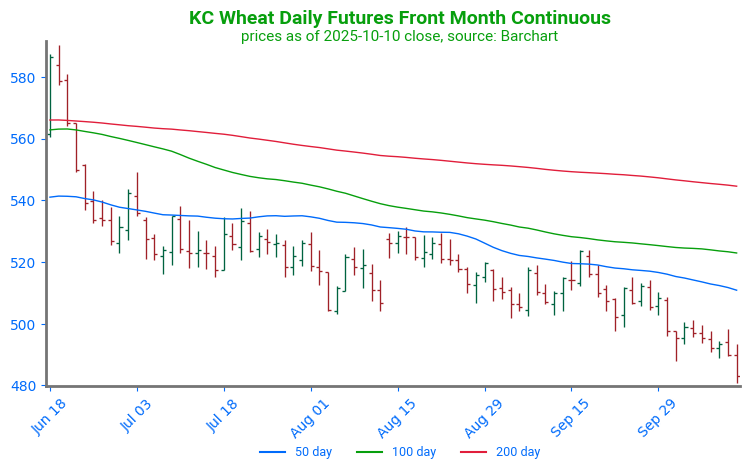
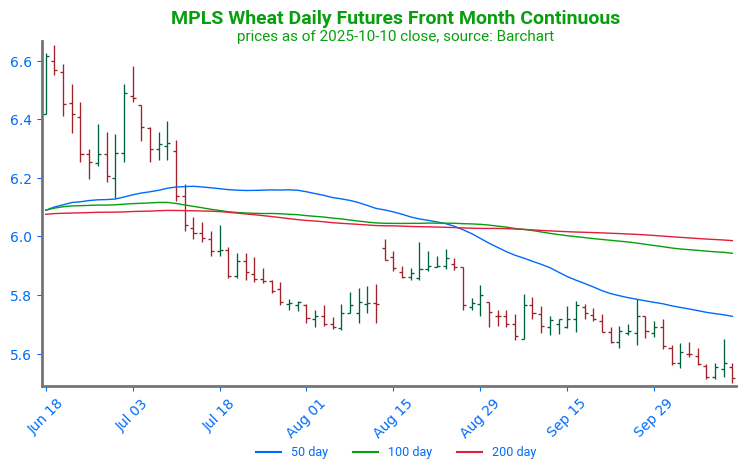
- All three wheat classes are trading lower this morning with Chicago wheat down 2-1/2 cents to $4.96-1/4, KC wheat down 2-1/2 cents to $4.85-3/4, and Minn wheat down 3 cents to $5.48. Chicago is still 4 cents off its contract lows from earlier this week.
- Russia reportedly sees their grain export potential for 25/26 at 50 mmt and has already harvested nearly 132 mmt of grain and 90 mmt of wheat with harvest 91% complete. Russia has also resumed exporting wheat to Indonesia after trade negotiations.
- In Australia, rains are forecast to increase in the second half of October along with cooler temperatures through the next few weeks. This weather pattern will be favorable for wheat development.
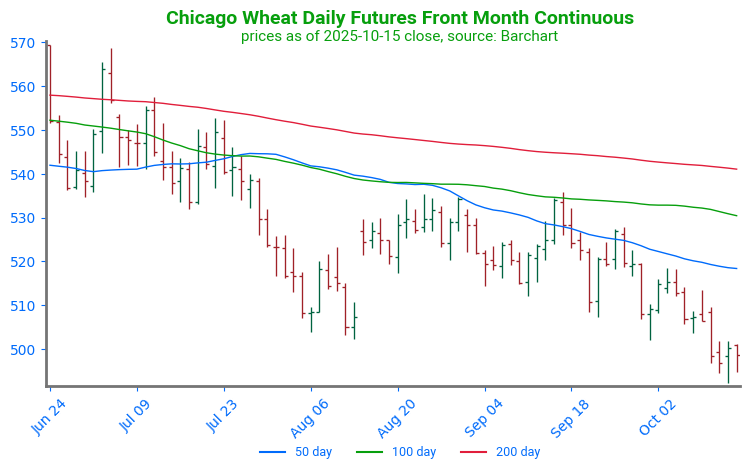
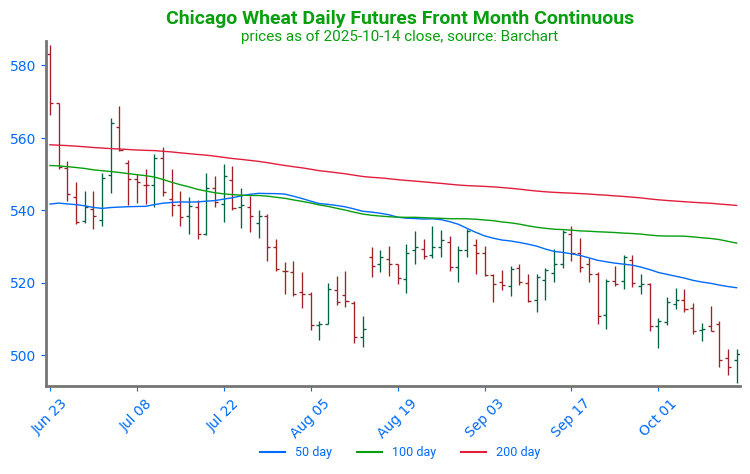
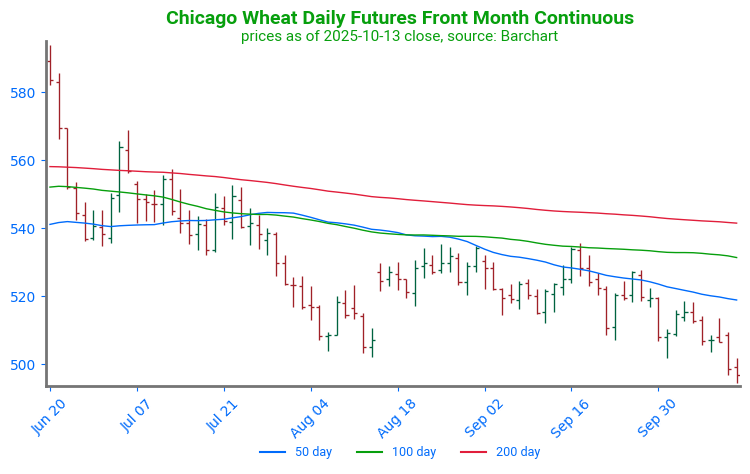
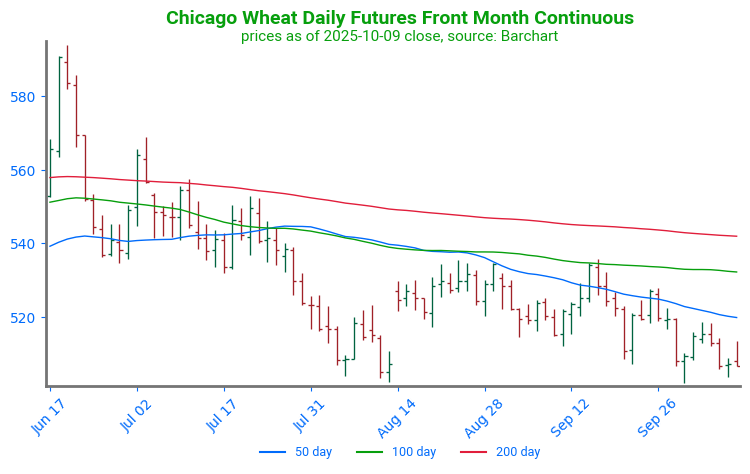
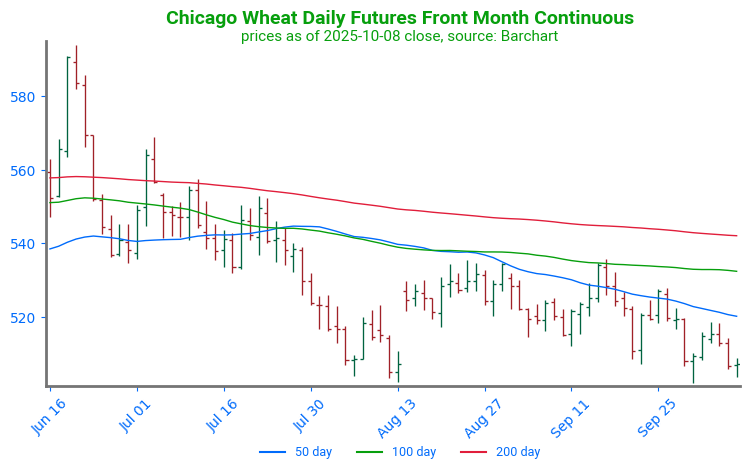
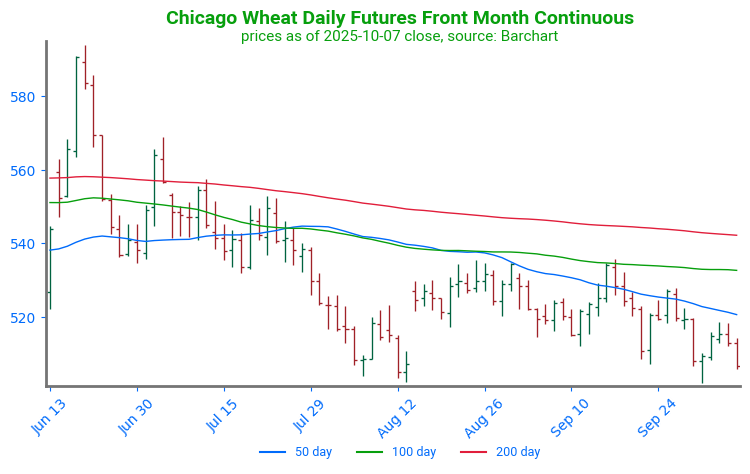
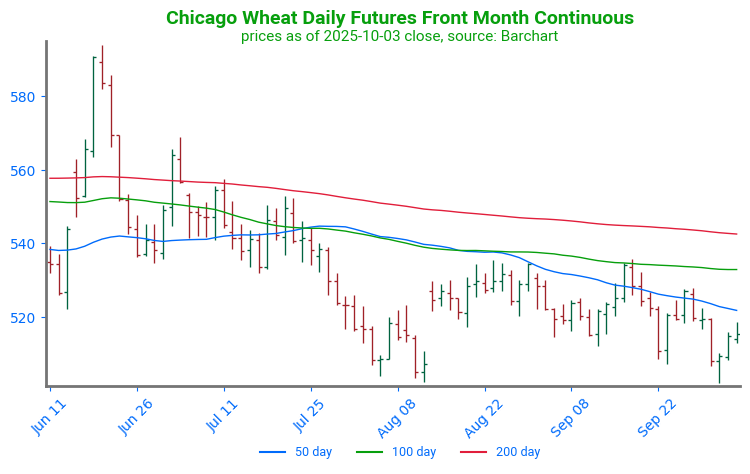
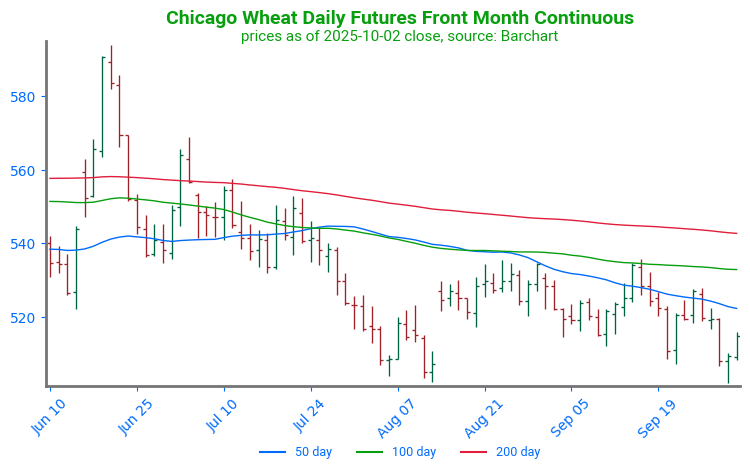
Chicago Wheat Breaks Below Support: Wheat futures have fallen below the technical support level of 502 driven by the strength in the U.S. dollar. The first point of technical support is near 475, a relative low established in June of 2020. The first point of technical resistance is near 519 at the 50-day moving average.
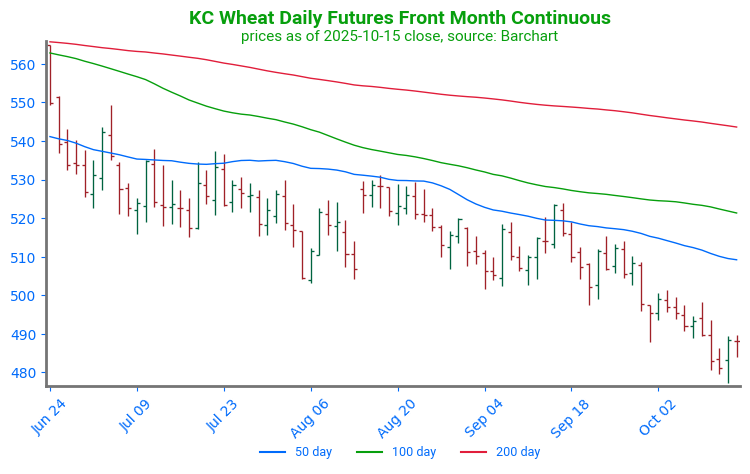
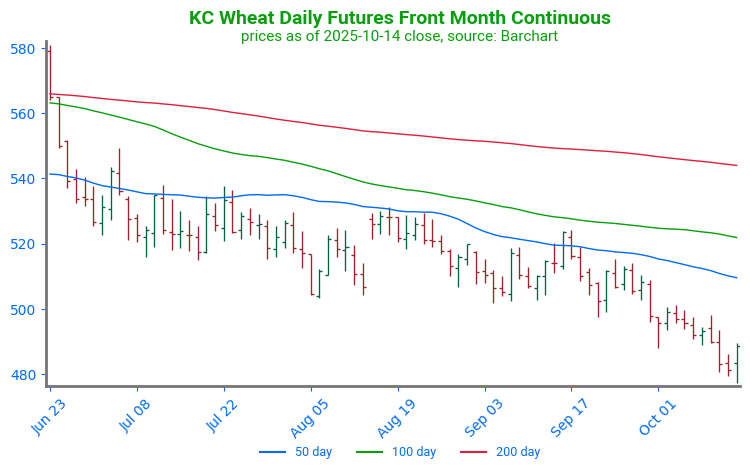
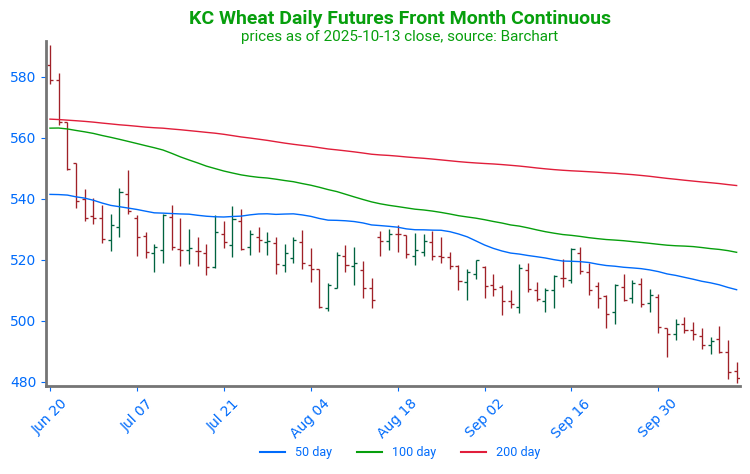
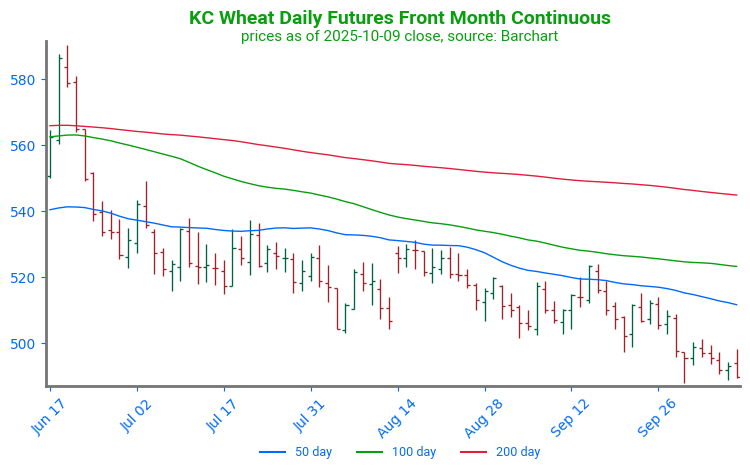
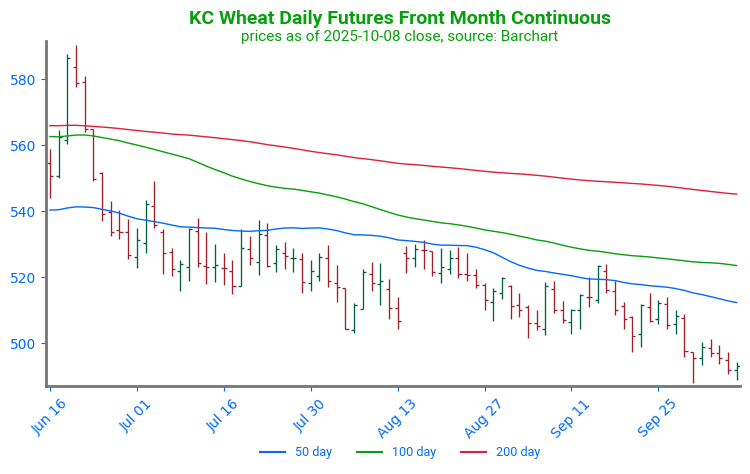
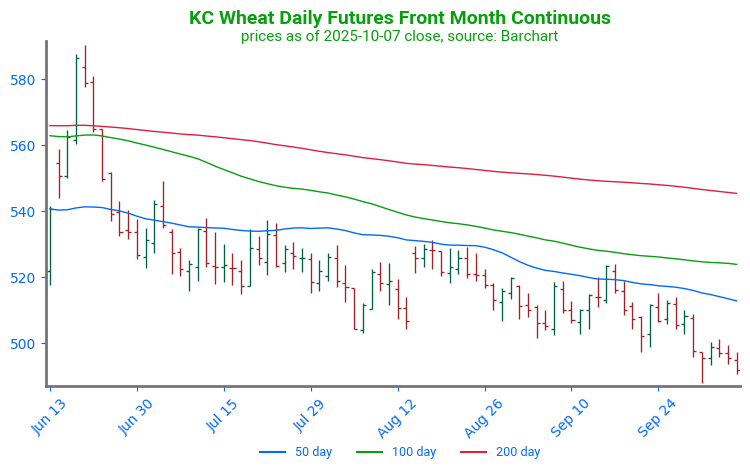
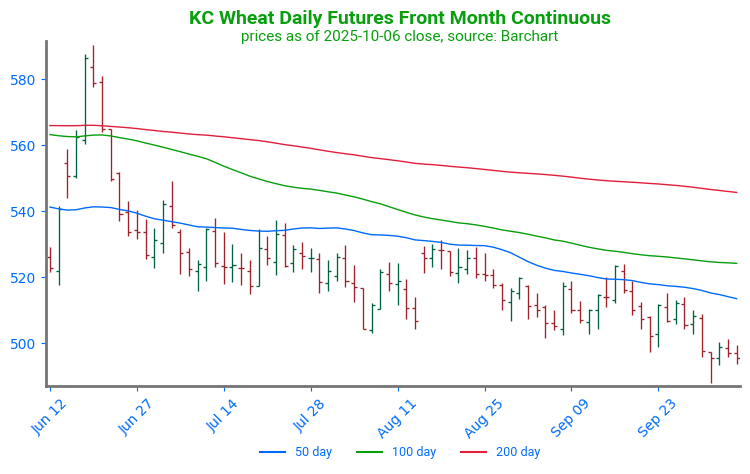
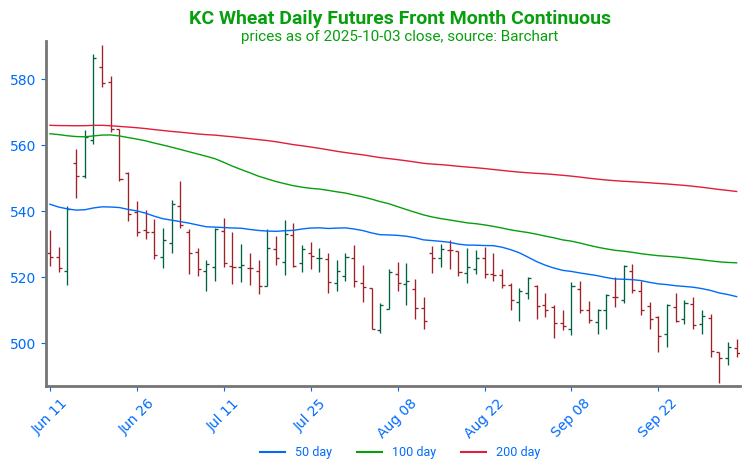
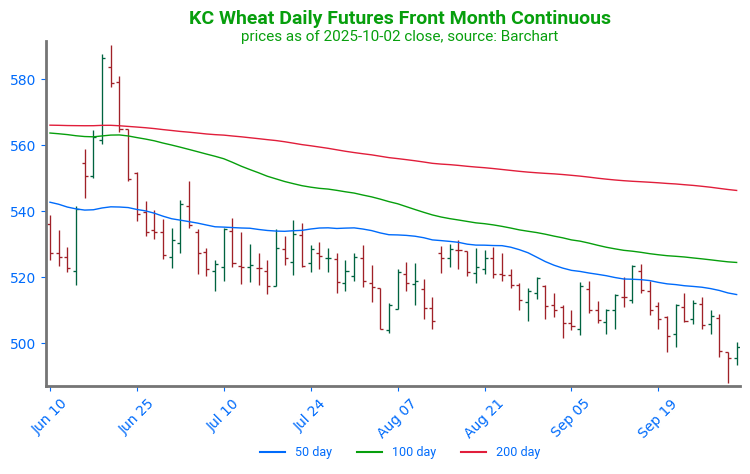
KC Wheat Fails to Find Support, Makes New Lows: KC wheat has trended lower following contract rollover on August 14. The market has since returned to price levels not seen since the fall of 2020. The first point of technical support can be found near 465, a consolidation range from September of 2020. The first point of technical resistance is near 510, at the 50-day moving average.
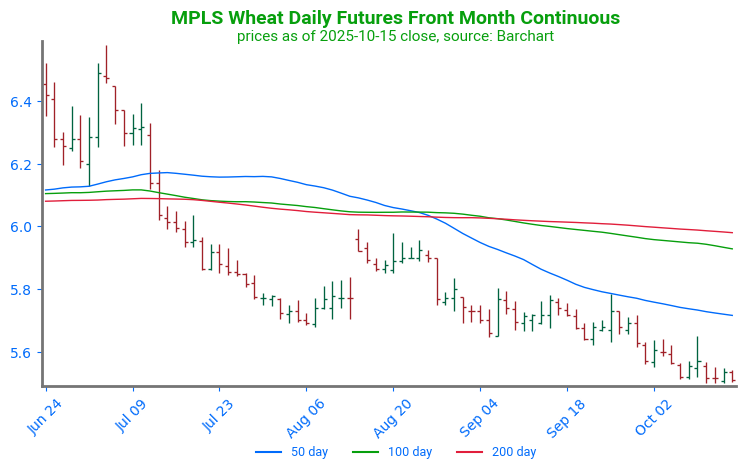
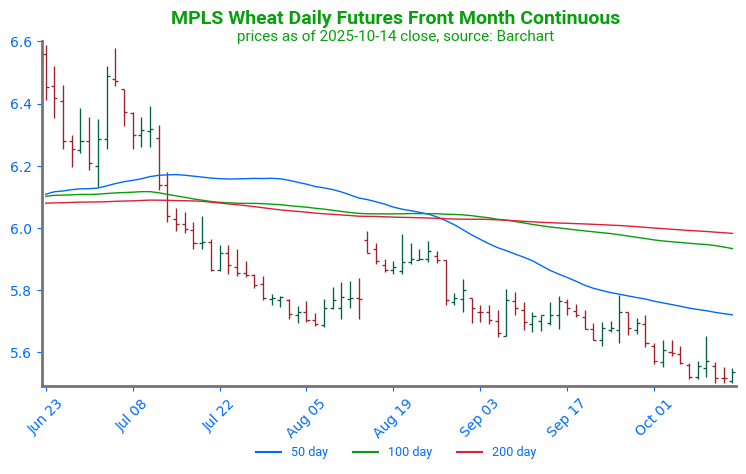
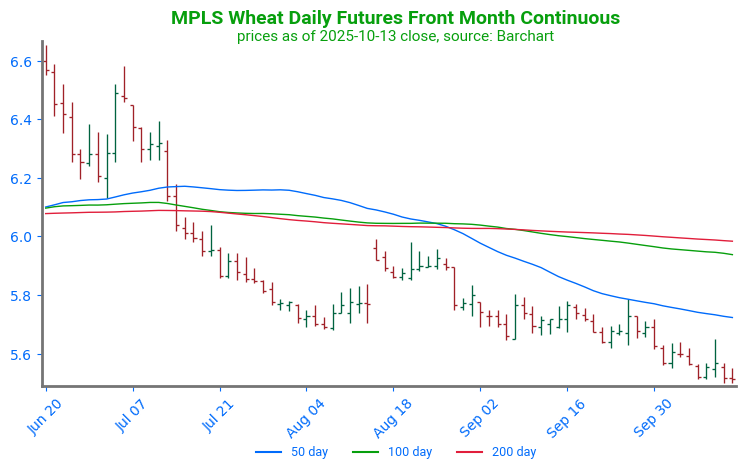
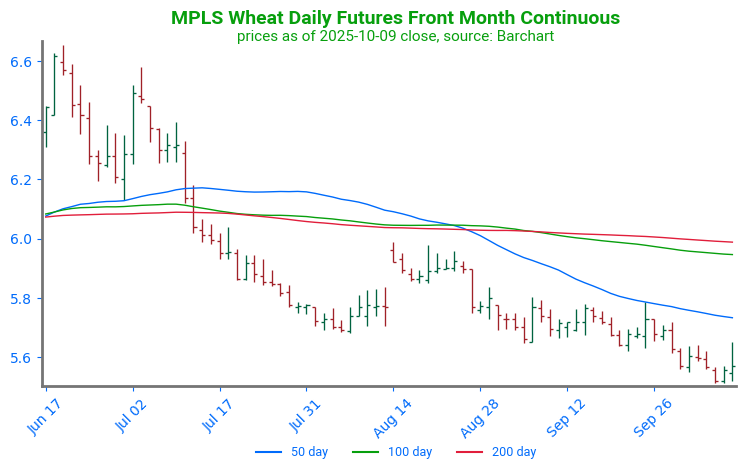
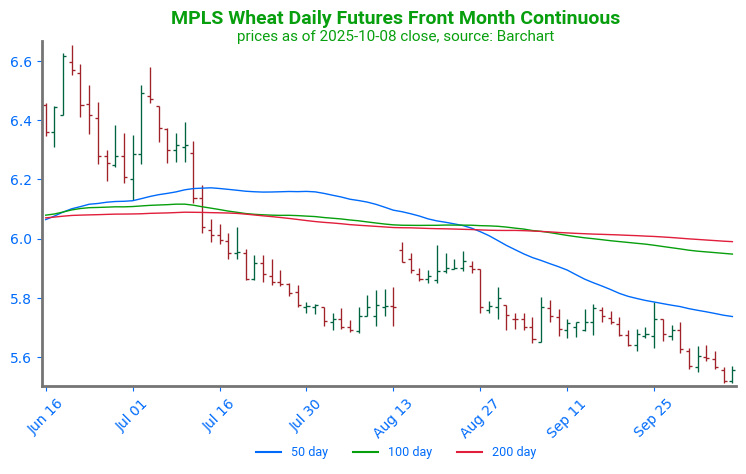
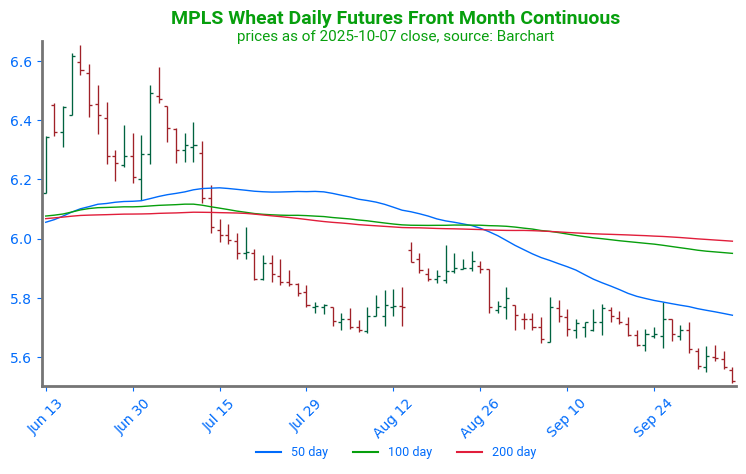
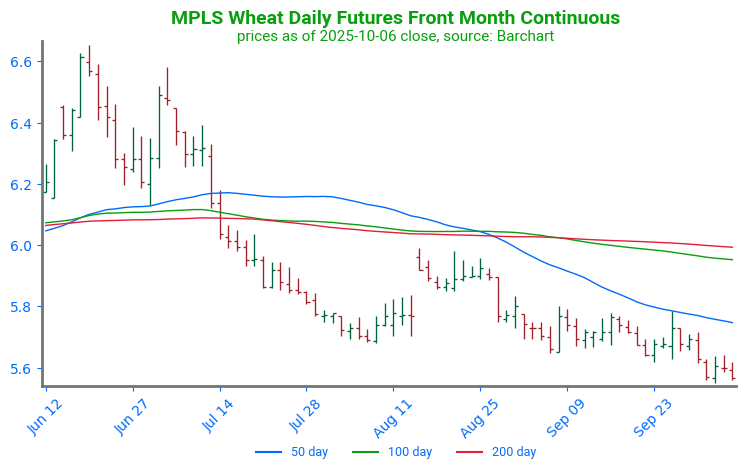
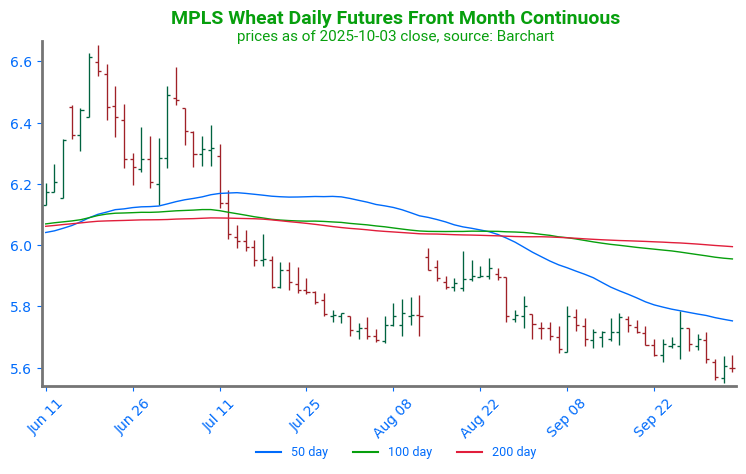
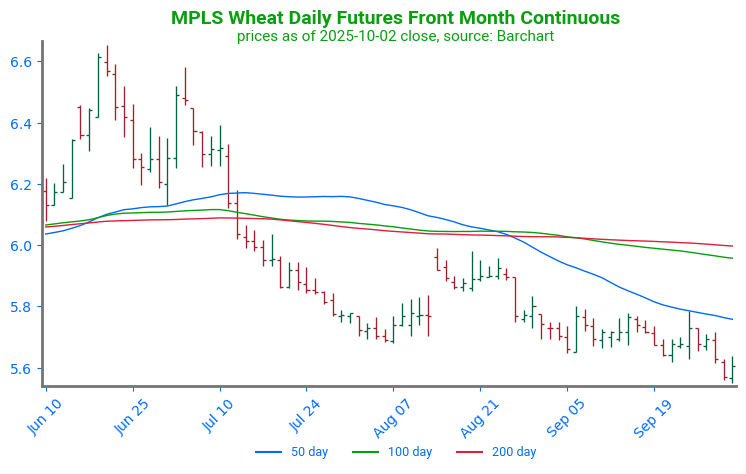
Spring Wheat Presses Lower: Spring wheat futures have failed to find solid support, trading at the lowest price since December 2020. The first point of strong resistance sits near 574 at the 50-day moving average. A second point can be found through a cluster of moving averages near 600. Technical support can be found near 540, the bottom of a consolidation range from December of 2020.
Grain Market Insider is provided by Stewart-Peterson Inc., a publishing company.
Futures and options trading involve significant risk of loss and may not be suitable for everyone. Therefore, carefully consider whether such trading is suitable for you in light of your financial condition. The data contained herein is believed to be drawn from reliable sources but cannot be guaranteed. This material has been prepared by a sales or trading employee or agent of Total Farm Marketing by Stewart-Peterson and is, or is in the nature of, a solicitation. Any decisions you may make to buy, sell or hold a futures or options position on such research are entirely your own and not in any way deemed to be endorsed by or attributed to Stewart-Peterson Inc. Reproduction of this information without prior written permission is prohibited. Hypothetical performance results have many inherent limitations. No representation is being made that any account will or is likely to achieve profits or losses similar to those shown. The data contained herein is believed to be drawn from reliable sources but cannot be guaranteed. Reproduction and distribution of this information without prior written permission is prohibited. This material has been prepared by a sales or trading employee or agent of Total Farm Marketing and is, or is in the nature of, a solicitation. Any decisions you may make to buy, sell or hold a position on such research are entirely your own and not in any way deemed to be endorsed by or attributed to Total Farm Marketing.
Stewart-Peterson Inc., Stewart-Peterson Group Inc., and SP Risk Services LLC are each part of the family of companies within Total Farm Marketing (TFM). Stewart-Peterson Inc. is a publishing company. Stewart-Peterson Group Inc. is registered with the Commodity Futures Trading Commission (CFTC) as an introducing broker and is a member of National Futures Association. SP Risk Services LLC is an insurance agency. A customer may have relationships with any or all three companies.