9-26 Opening Update: Grains Trading Quietly Lower
Grain Market Insider Interactive Quote Board


- Corn futures are trading slightly lower this morning and are in a wedge pattern which could break out higher to test the $4.40 level in December. December is down 1/2 cent to $4.25-1/4 and March is down 1/2 cent to $4.41-3/4.
- Yesterday’s export sales report was good for corn with sales at 1,923k tons which compared to 1,232k lasty week and 535k a year ago. Top buyers were Mexico, unknown destinations, and Colombia.
- Estimates for the 25/26 Argentinian corn crop have been revised with corn planted area unchanged at 7.8 million hectares with planting now 12.3% complete.
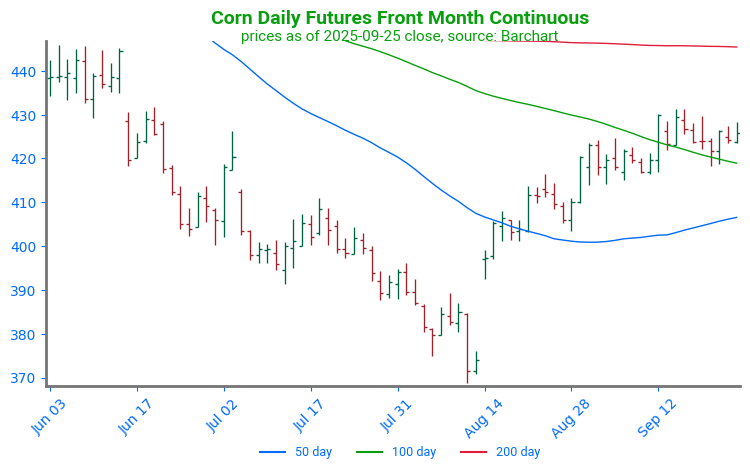
Corn Futures Consolidate Below Resistance: Following the release of the September WASDE report, corn futures pressed higher. Prices managed to break through the 100-day moving average but have since begun to consolidate below strong resistance at the July 7 price gap. The first point of support lies near 420, at the 100-day moving average.

- Soybeans are slightly lower to start the day and remain rangebound. November soybeans are down 1 cent to $10.11-1/4 while March is down 3/4 cent to $10.46-3/4. October soybean meal is up $1.60 to $270.20 and October soybean oil is down 0.08 cents to 49.66 cents.
- China has purchased around 40 cargoes of Argentinian soybeans taking advantage of the country’s temporary halt on export taxes. Argentina has met sales goals and has put the taxes back in place.
- Yesterday’s export sales saw soybeans within trade estimates at 725k tons which compared to 925k last week and 1,575k tons a year ago. Top buyers were Egypt, Taiwan, and Mexico.
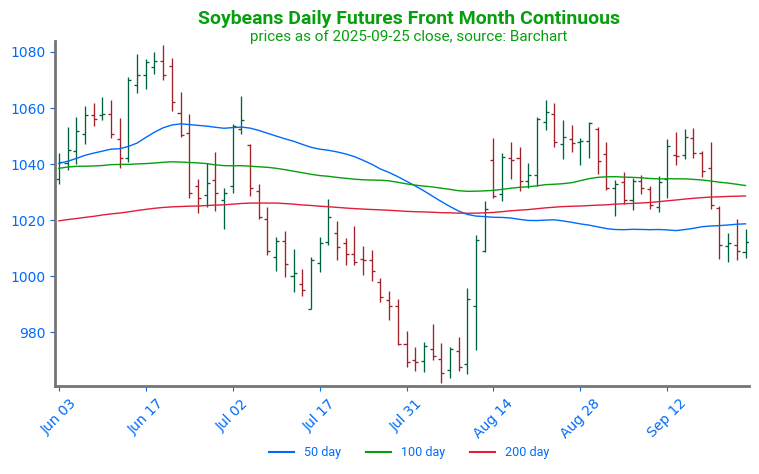
Soybean Futures Break Support: Soybean futures moved lower in rapid fashion, breaking through structural support as well as a cluster of three major moving averages. Trendline support lies near 970.

- All three wheat classes are trading lower following yesterday’s gains. December Chicago wheat is down 3-1/4 cents to $5.23-3/4 while KC wheat is down 2 cents to $5.10-1/4, and Minn wheat is down 3 cents to $5.70.
- The EU’s total grain production has been estimated higher at 284.2 mmt from 276.9 mmt for the 25/26 season thanks to and increase in soft wheat production to 132.6 mmt from the previous estimate of 128.1 mmt.
- Yesterday’s export sales report saw wheat sales at 540k tons which compared to 388k last week and 169k tons a year ago. Top buyers were the Philippines, Italy, and Indonesia.
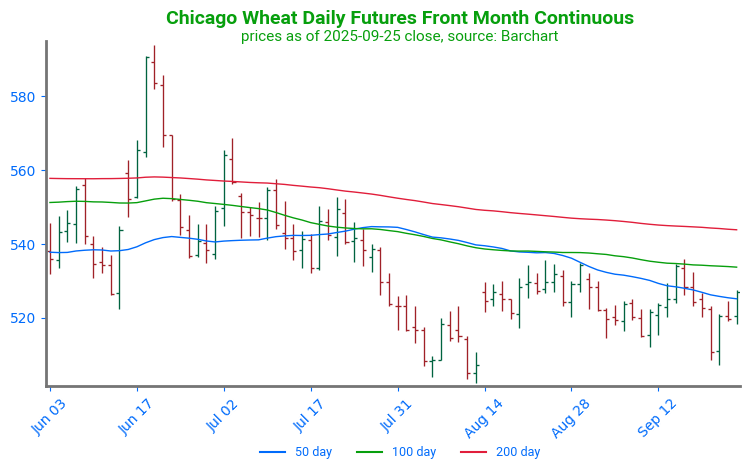
Chicago Wheat Fails to Find Support: Wheat futures continue to trade lower after finding resistance in the 100-day moving average and breaking below the 50-day moving average. The next point of technical support is near 502, at the one year low.
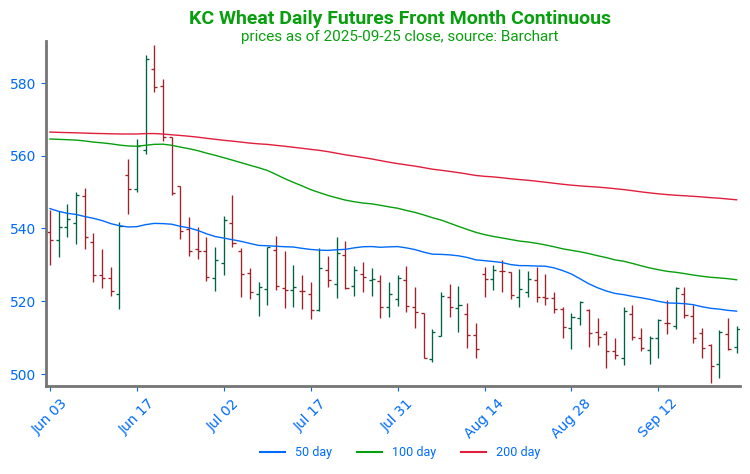
KC Wheat Makes New Low: December KC wheat broke through its 50-day moving average in a strong fashion following the September WASDE report. The market has since turned lower, breaking back below the 50-day moving average and continuing lower to trade at new lows.
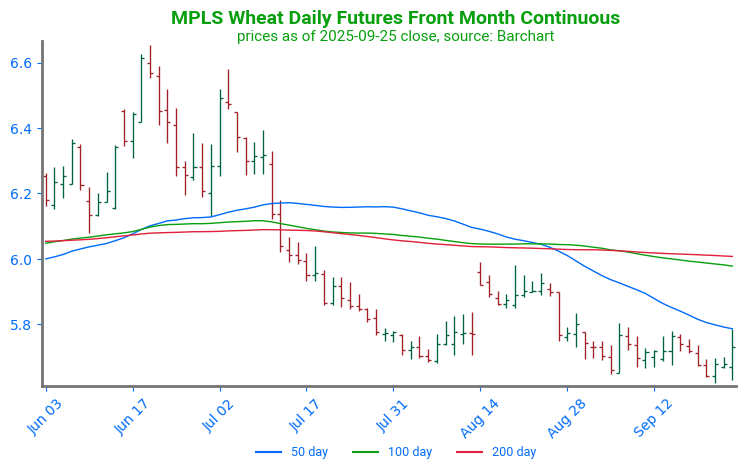
Spring Wheat Seeks Support: Spring wheat futures have failed to find solid support, trading at the lowest price since August 26, 2024. The first point of strong resistance sits near 585 at the 50-day moving average. A second point can be found through a cluster of moving averages near 600.
Grain Market Insider is provided by Stewart-Peterson Inc., a publishing company.
Futures and options trading involve significant risk of loss and may not be suitable for everyone. Therefore, carefully consider whether such trading is suitable for you in light of your financial condition. The data contained herein is believed to be drawn from reliable sources but cannot be guaranteed. This material has been prepared by a sales or trading employee or agent of Total Farm Marketing by Stewart-Peterson and is, or is in the nature of, a solicitation. Any decisions you may make to buy, sell or hold a futures or options position on such research are entirely your own and not in any way deemed to be endorsed by or attributed to Stewart-Peterson Inc. Reproduction of this information without prior written permission is prohibited. Hypothetical performance results have many inherent limitations. No representation is being made that any account will or is likely to achieve profits or losses similar to those shown. The data contained herein is believed to be drawn from reliable sources but cannot be guaranteed. Reproduction and distribution of this information without prior written permission is prohibited. This material has been prepared by a sales or trading employee or agent of Total Farm Marketing and is, or is in the nature of, a solicitation. Any decisions you may make to buy, sell or hold a position on such research are entirely your own and not in any way deemed to be endorsed by or attributed to Total Farm Marketing.
Stewart-Peterson Inc., Stewart-Peterson Group Inc., and SP Risk Services LLC are each part of the family of companies within Total Farm Marketing (TFM). Stewart-Peterson Inc. is a publishing company. Stewart-Peterson Group Inc. is registered with the Commodity Futures Trading Commission (CFTC) as an introducing broker and is a member of National Futures Association. SP Risk Services LLC is an insurance agency. A customer may have relationships with any or all three companies.