9-15 Opening Update:
Grain Market Insider Interactive Quote Board


- Corn is trading lower this morning following Friday’s higher trade that came on the heels of a relatively bearish USDA report. December corn is down 4-1/4 cents to $4.25-3/4 while March is down 4-1/2 cents to $4.43.
- While Friday’s WASDE report numbers were within trade expectations, they leaned bearish. Corn ending stocks for 24/25 were increased to 1.325 bb while 25/26 ending stocks were lowered but above the trade guess at 2.11 bb. Yield was decreased to 186.7 bpa and harvest acreage was increased to 90.0 ma.
- Friday’s CFTC report saw funds as sellers of corn by 8,442 contracts which increased their net short position to 99,929 contracts.
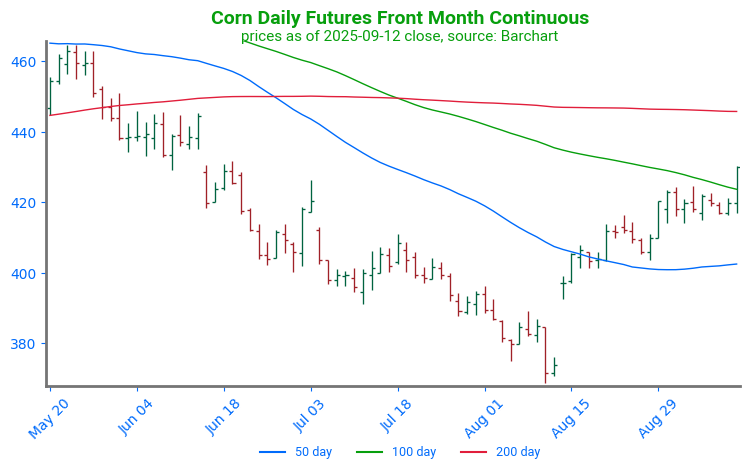
Corn Futures Consolidate: December corn futures continue to consolidate as traders await the monthly WASDE report on September 12. Prices are currently supported by the 50-day moving average. Technical resistance can be found near 430 through both the 100-day moving average and the July 7 price gap.

- Soybeans are trading lower to start the week with prices hovering above the 21-day moving average. November soybeans are down 5 cents at $10.41-1/4 and March beans are down 5 cents at $10.75-1/4. October meal is down $3.10 to $284.50 and October bean oil is up 0.30 cents to 51.97 cents.
- The USDA report saw 24/25 soybean ending stocks unchanged at 330 mb while 25/26 ending stocks were increased slightly by 10 mb to 300 mb. Export demand was lowered and yield was lowered to 53.5 bpa.
- Friday’s CFTC report saw funds as sellers of soybeans by 26,678 contracts increasing their net short position to 14,714 contracts. They sold 12,465 contracts of bean oil and bought back 3,737 contracts of meal.
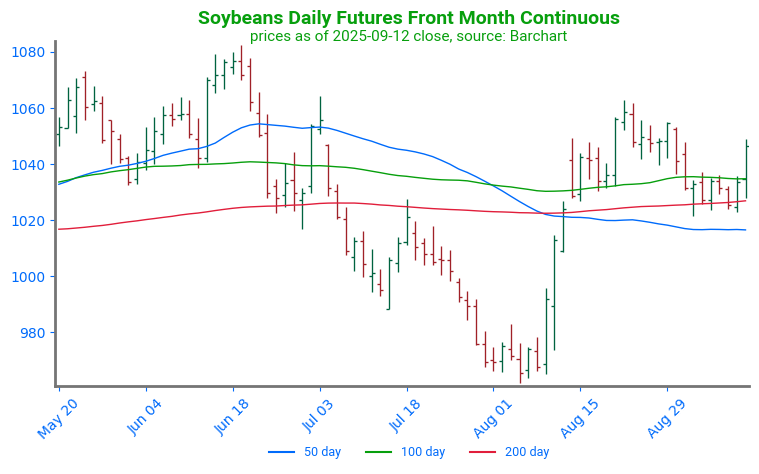
Soybeans Hold at Support: Early August strength followed USDA’s 2.5 million acre cut to 2025 harvested area, propelling futures through major resistance and key moving averages near 10.30, now acting as support. On the upside, the 10.80 spring highs remain the next major technical hurdle, a level that has consistently capped rallies over the past year.

- Wheat is mixed to start the day with December Chicago wheat up 1-1/2 cents at $5.24-3/4 while December KC wheat is down 1/2 cent to $5.14-1/4, and Minn is down 1/4 cent.
- The WASDE report saw 25/26 ending stocks for wheat fall to 844 mb from 869 mb last month. World ending stocks increased to 264.1 mmt from 260.1 mmt in August.
- Friday’s CFTC report saw funds as sellers of Chicago wheat by 10,451 contracts leaving them short 92,394 contracts. They bought back 1,656 contracts of KC wheat decreasing their short position to 53,025 contracts.
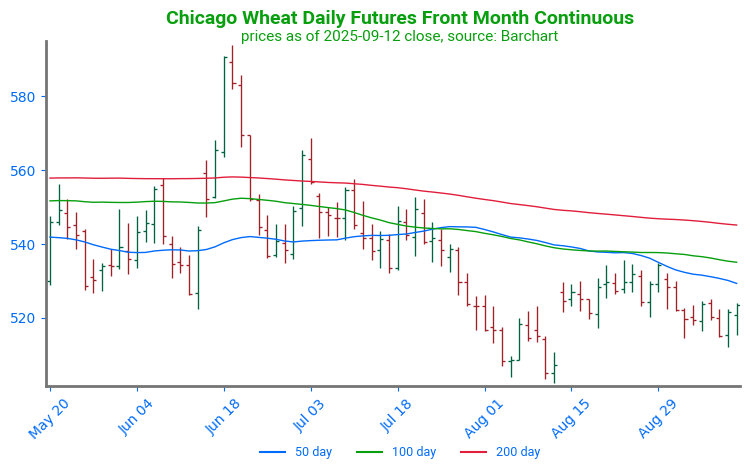
Chicago Wheat Range Bound: Wheat futures have remained relatively range bound between 519 and 534 following the August low and contract rollover. The first point of technical resistance is near 532 at the 50-day moving average.
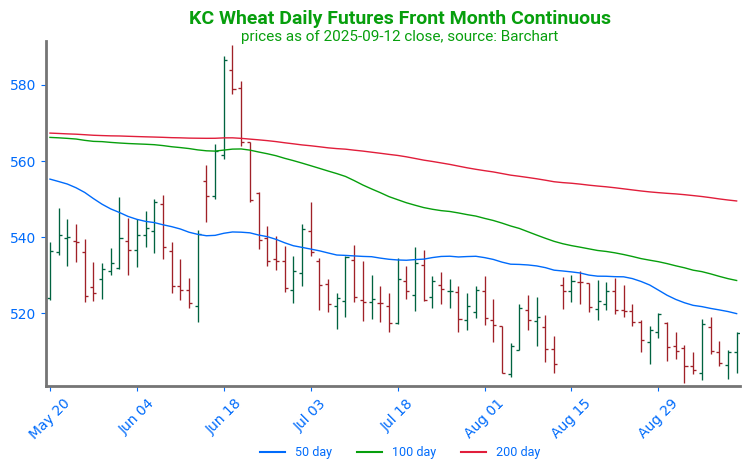
KC Wheat Trends Sideways, Tests Lows: June’s rally briefly tested April highs near 580 before fading into month-end. The pullback left futures trading below the 50-day moving average, now key resistance on any rebound. Support is firm at the recent lows near 505, with secondary support at the May low around 500.
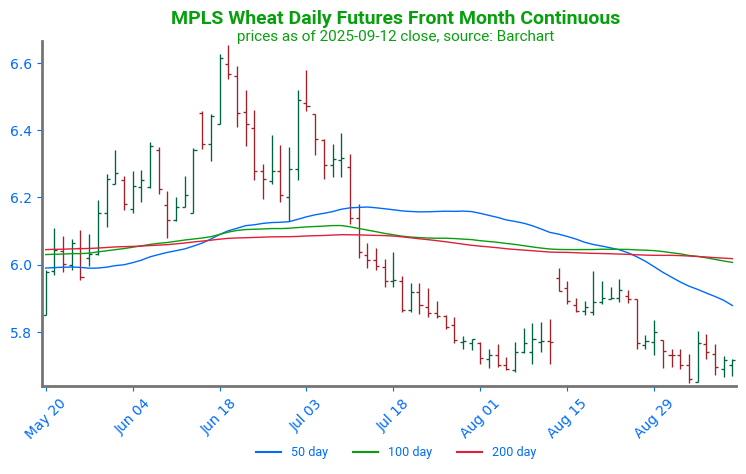
Spring Wheat Tests Support: Futures remain rangebound as harvest advances, holding early August lows near 580 support. On the upside, strong resistance sits just above 600 at clustered moving averages, with a secondary target near 650 if momentum builds.
Grain Market Insider is provided by Stewart-Peterson Inc., a publishing company.
Futures and options trading involve significant risk of loss and may not be suitable for everyone. Therefore, carefully consider whether such trading is suitable for you in light of your financial condition. The data contained herein is believed to be drawn from reliable sources but cannot be guaranteed. This material has been prepared by a sales or trading employee or agent of Total Farm Marketing by Stewart-Peterson and is, or is in the nature of, a solicitation. Any decisions you may make to buy, sell or hold a futures or options position on such research are entirely your own and not in any way deemed to be endorsed by or attributed to Stewart-Peterson Inc. Reproduction of this information without prior written permission is prohibited. Hypothetical performance results have many inherent limitations. No representation is being made that any account will or is likely to achieve profits or losses similar to those shown. The data contained herein is believed to be drawn from reliable sources but cannot be guaranteed. Reproduction and distribution of this information without prior written permission is prohibited. This material has been prepared by a sales or trading employee or agent of Total Farm Marketing and is, or is in the nature of, a solicitation. Any decisions you may make to buy, sell or hold a position on such research are entirely your own and not in any way deemed to be endorsed by or attributed to Total Farm Marketing.
Stewart-Peterson Inc., Stewart-Peterson Group Inc., and SP Risk Services LLC are each part of the family of companies within Total Farm Marketing (TFM). Stewart-Peterson Inc. is a publishing company. Stewart-Peterson Group Inc. is registered with the Commodity Futures Trading Commission (CFTC) as an introducing broker and is a member of National Futures Association. SP Risk Services LLC is an insurance agency. A customer may have relationships with any or all three companies.