9-11 Opening Update: Corn and Soybeans Higher, Wheat Lower
Grain Market Insider Interactive Quote Board


- Corn is trading higher to start the day with December up 1-1/2 cents at $4.18-1/2 while March is up 1-1/4 at $4.35-3/4. Corn prices have moved higher since last months contract low amid fears of lower yield.
- Trade estimates for Friday’s report peg U.S. 2024/25 corn carryout at 1.311 billion bu (vs USDA’s 1.305) and 2025/26 at 2.011 billion bu (vs USDA’s 2.117), with crop size seen at 16.516 billion bu, below the USDA’s August estimate of 16.742.
- Estimates for today’s export sales report see corn sales in a range between 900k and 2,400k tons with an average guess of 1,583k tons. This would compare to 1,836k a week ago and 667k a year ago at this time.
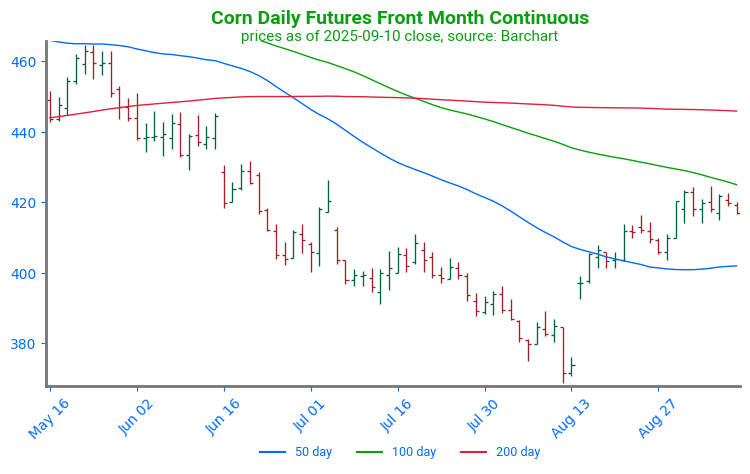
Corn Futures Consolidate: December corn futures continue to consolidate as traders await the monthly WASDE report on September 12. Prices are currently supported by the 50-day moving average. Technical resistance can be found near 430 through both the 100-day moving average and the July 7 price gap.

- Soybeans higher to start the day after dropping to support levels at the 50-day moving average nearly every day for the past week but then bouncing higher off it. November soybeans are up 5-3/4 cents to $10.31 while October meal is up $0.50 to $284 and October bean oil is up 0.34 cents to 50.83 cents.
- Trade estimates slightly undercut USDA figures, with U.S. 2024/25 soybean carryout seen at 328 million bu (vs USDA 330), 2025/26 at 288 million bu (vs USDA 290), and production at 4.271 billion bu (vs USDA 4.292).
- Estimates for today’s export sales report see soybean sales in a range between 400k and 1,600k tons with an average guess of 950k. This would compare to 795k last week and 1,474k a year ago.
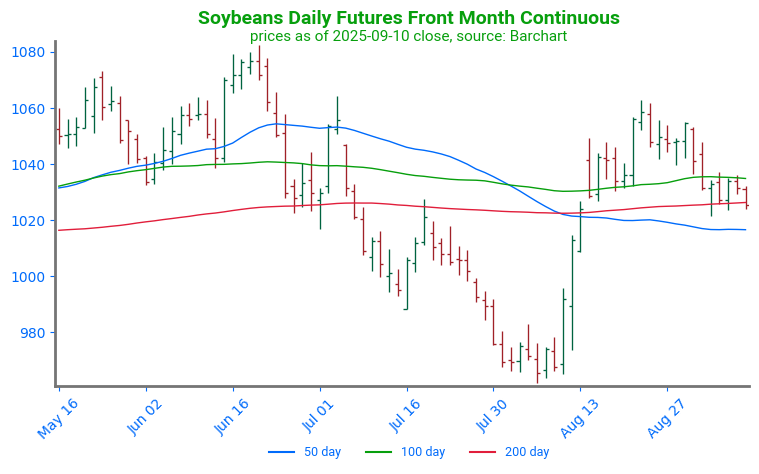
Soybeans Hold at Support: Early August strength followed USDA’s 2.5 million acre cut to 2025 harvested area, propelling futures through major resistance and key moving averages near 10.30, now acting as support. On the upside, the 10.80 spring highs remain the next major technical hurdle, a level that has consistently capped rallies over the past year.

- All three wheat classes are weaker this morning with December Chicago wheat down 1-3/4 to $5.13-1/4 and December KC wheat down 2-1/2 cents to $5.04-1/2.
- Trade estimates for Friday put 2025/26 U.S. wheat carryout at 865 million bu (vs USDA 869) and global ending stocks at 261.1 mmt (vs USDA 260.1).
- Estimates for today’s export sales report see wheat sales between 300k and 650k tons with an average of 433k tons. This would compare to 318k last week and 465k a year ago at this time.
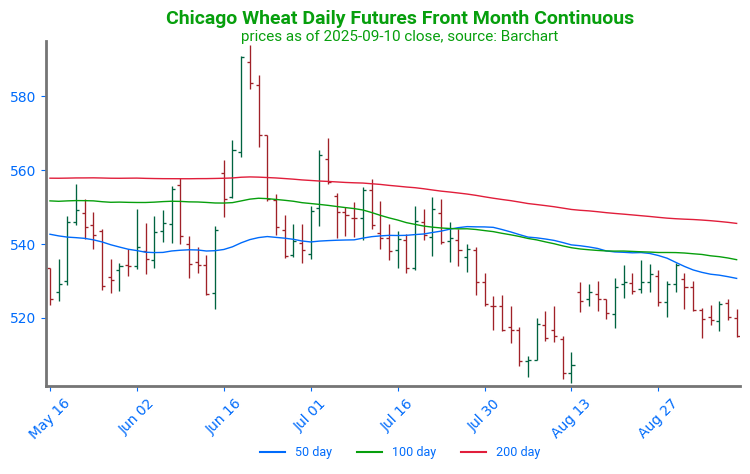
Chicago Wheat Range Bound: Wheat futures have remained relatively range bound between 519 and 534 following the August low and contract rollover. The first point of technical resistance is near 532 at the 50-day moving average.
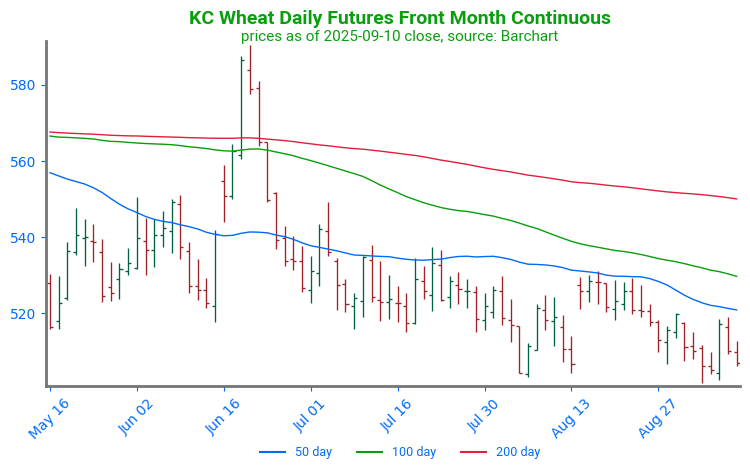
KC Wheat Trends Sideways, Tests Lows: June’s rally briefly tested April highs near 580 before fading into month-end. The pullback left futures trading below the 50-day moving average, now key resistance on any rebound. Support is firm at the recent lows near 505, with secondary support at the May low around 500.
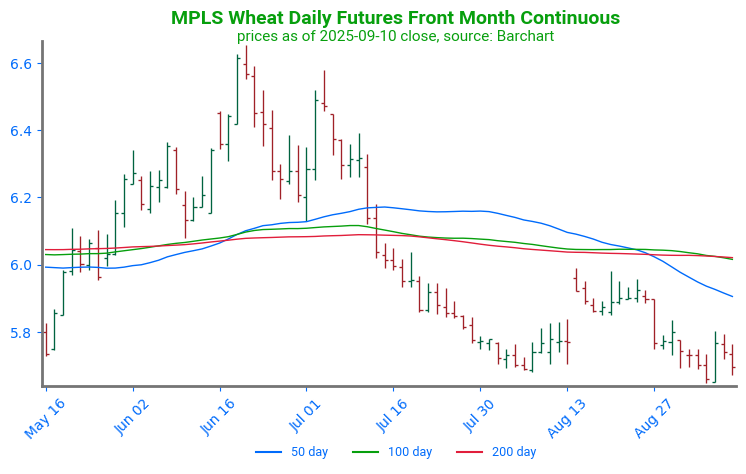
Spring Wheat Tests Support: Futures remain rangebound as harvest advances, holding early August lows near 580 support. On the upside, strong resistance sits just above 600 at clustered moving averages, with a secondary target near 650 if momentum builds.
Grain Market Insider is provided by Stewart-Peterson Inc., a publishing company.
Futures and options trading involve significant risk of loss and may not be suitable for everyone. Therefore, carefully consider whether such trading is suitable for you in light of your financial condition. The data contained herein is believed to be drawn from reliable sources but cannot be guaranteed. This material has been prepared by a sales or trading employee or agent of Total Farm Marketing by Stewart-Peterson and is, or is in the nature of, a solicitation. Any decisions you may make to buy, sell or hold a futures or options position on such research are entirely your own and not in any way deemed to be endorsed by or attributed to Stewart-Peterson Inc. Reproduction of this information without prior written permission is prohibited. Hypothetical performance results have many inherent limitations. No representation is being made that any account will or is likely to achieve profits or losses similar to those shown. The data contained herein is believed to be drawn from reliable sources but cannot be guaranteed. Reproduction and distribution of this information without prior written permission is prohibited. This material has been prepared by a sales or trading employee or agent of Total Farm Marketing and is, or is in the nature of, a solicitation. Any decisions you may make to buy, sell or hold a position on such research are entirely your own and not in any way deemed to be endorsed by or attributed to Total Farm Marketing.
Stewart-Peterson Inc., Stewart-Peterson Group Inc., and SP Risk Services LLC are each part of the family of companies within Total Farm Marketing (TFM). Stewart-Peterson Inc. is a publishing company. Stewart-Peterson Group Inc. is registered with the Commodity Futures Trading Commission (CFTC) as an introducing broker and is a member of National Futures Association. SP Risk Services LLC is an insurance agency. A customer may have relationships with any or all three companies.