5-28 End of Day: Grain Markets Mixed as Corn and Soybeans Retreat, Wheat Diverges on Crop Conditions
All Prices as of 2:00 pm Central Time
| Corn | ||
| JUL ’25 | 451 | -8.5 |
| DEC ’25 | 443.5 | -3 |
| DEC ’26 | 462.25 | -1.5 |
| Soybeans | ||
| JUL ’25 | 1048.5 | -14 |
| NOV ’25 | 1037.5 | -13.25 |
| NOV ’26 | 1045.5 | -9.25 |
| Chicago Wheat | ||
| JUL ’25 | 530.25 | 1.75 |
| SEP ’25 | 545.5 | 1.25 |
| JUL ’26 | 610.5 | 1.75 |
| K.C. Wheat | ||
| JUL ’25 | 525.25 | 0.75 |
| SEP ’25 | 539.5 | 0 |
| JUL ’26 | 599.75 | -1 |
| Mpls Wheat | ||
| JUL ’25 | 603.25 | 7 |
| SEP ’25 | 614.5 | 5.25 |
| SEP ’26 | 671.75 | 2.5 |
| S&P 500 | ||
| JUN ’25 | 5925 | -9.25 |
| Crude Oil | ||
| JUL ’25 | 61.73 | 0.84 |
| Gold | ||
| AUG ’25 | 3326.5 | -1.8 |
Grain Market Highlights
- 🌽 Corn: Corn futures fell sharply Tuesday as strong planting progress, early harvest reports from Brazil, and concerns about weakening U.S. export demand pressured the market.
- 🌱 Soybeans: Soybean futures ended lower Tuesday, with July closing just below the 100-day moving average for the first time this month, as rapid U.S. planting progress, weaker soy product prices, and limited fresh news pressured the market.
- 🌾 Wheat: Wheat futures closed mixed after choppy trade, with Minneapolis leading to the upside following weaker-than-expected spring wheat condition ratings. In contrast, HRW wheat came under pressure as recent rains and warming temperatures are expected to benefit the crop.
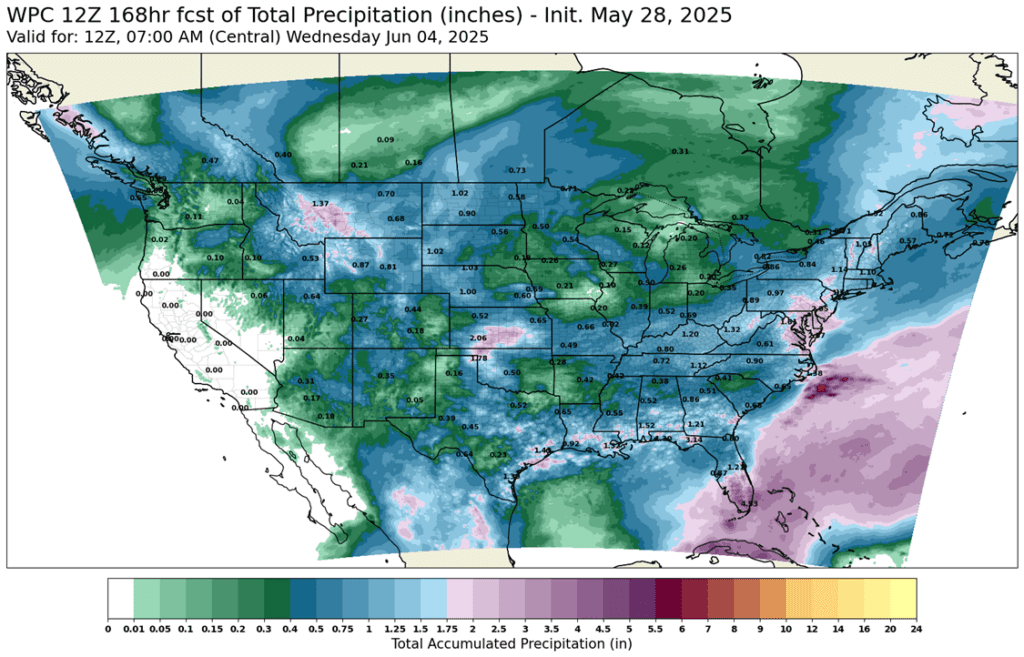
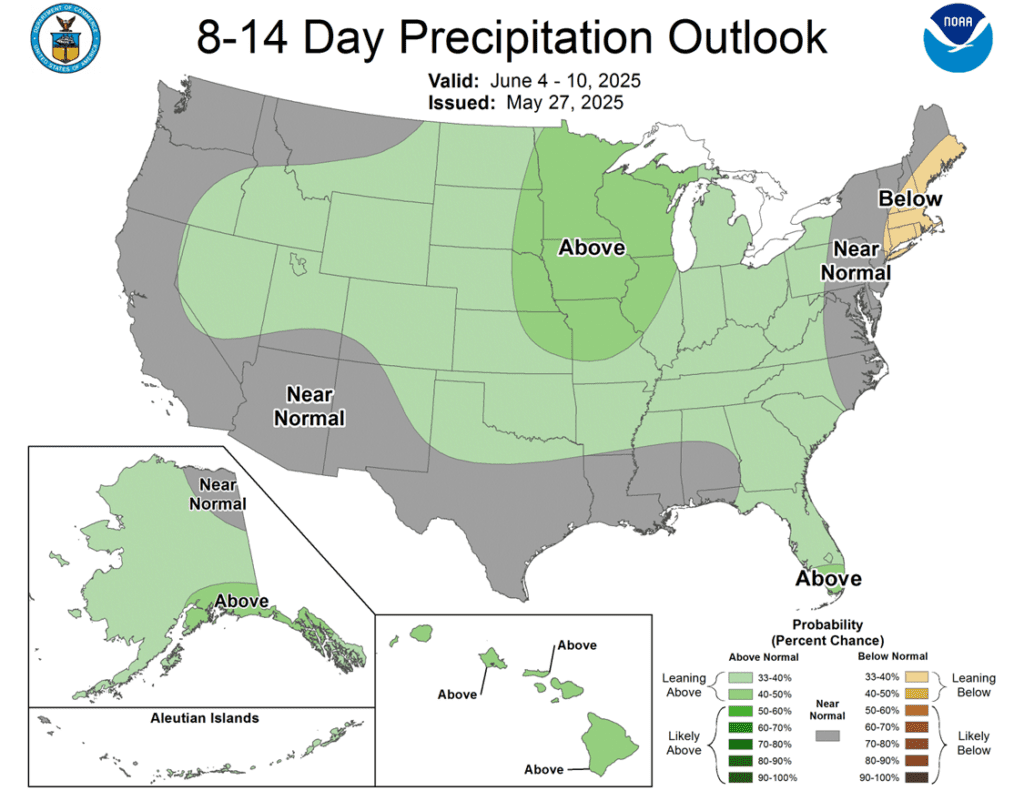
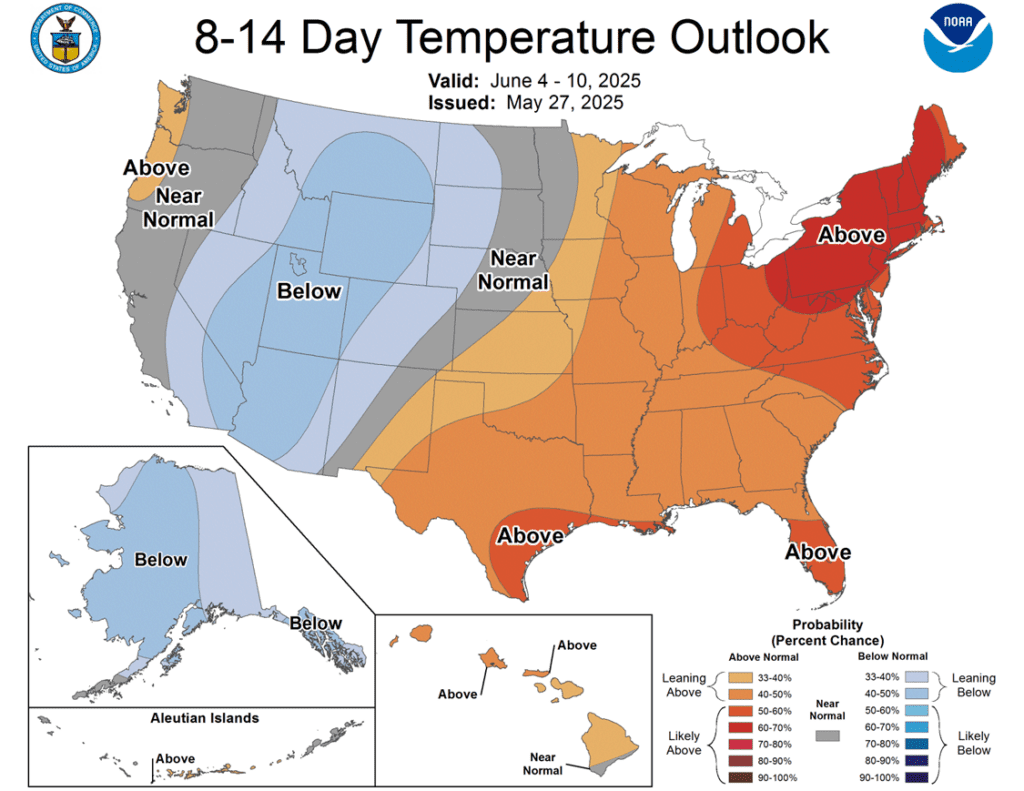
- To see updated U.S. weather outlook maps scroll down to the other charts/weather section.
Note – For the best viewing experience, some Grain Market Insider content is best viewed with your phone held horizontally.
Corn
Action Plan: Corn
Calls
2024
No New Action
2025
No New Action
2026
No New Action
Cash
2024
No New Action
2025
No New Action
2026
No New Action
Puts
2024
No New Action
2025
No New Action
2026
No New Action
2024 Crop:
- Plan A: No active targets.
- Plan B: No active targets.
- Details:
- Sales Recs: Eight sales recommendations made to date, with an average price of 494.
- Changes:
- None.
- With July corn continuing to hold support at 440, the strategy remains to hold out for potential upside volatility opportunities.
2025 Crop:
- Plan A:
- Exit all 510 December calls @ 43-5/8 cents.
- Exit half of the December 420 puts @ 43-3/4 cents.
- Exit one-quarter of the December 420 puts if December closes at 411 or lower.
- Roll-down 510 & 550 December calls if December drops to 399.
- Plan B: No active targets.
- Details:
- Sales Recs: Seven sales recommendations have been made to date, with an average price of 461.25.
- Changes:
- None.
- No adjustments needed at the moment. Positioned well for growing season volatility, with a good base of sales in place and both upside and downside targets active to begin legging out of open options positions.
2026 Crop:
- Plan A: Next cash sale at 474 vs December ‘26.
- Plan B: No active targets.
- Details:
- Sales Recs: Three sales recommendations have been made to date, with an average price of 460.
- Changes:
- None.
- The 474 target will be given this week. If it hasn’t been hit by Friday’s close, another sales recommendation may be made early next week based on the calendar and timing considerations.
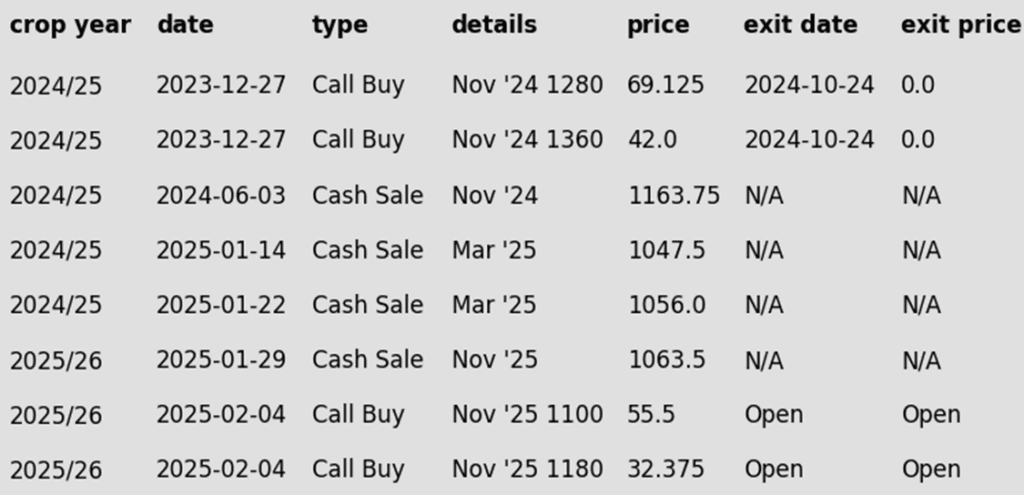
To date, Grain Market Insider has issued the following corn recommendations:
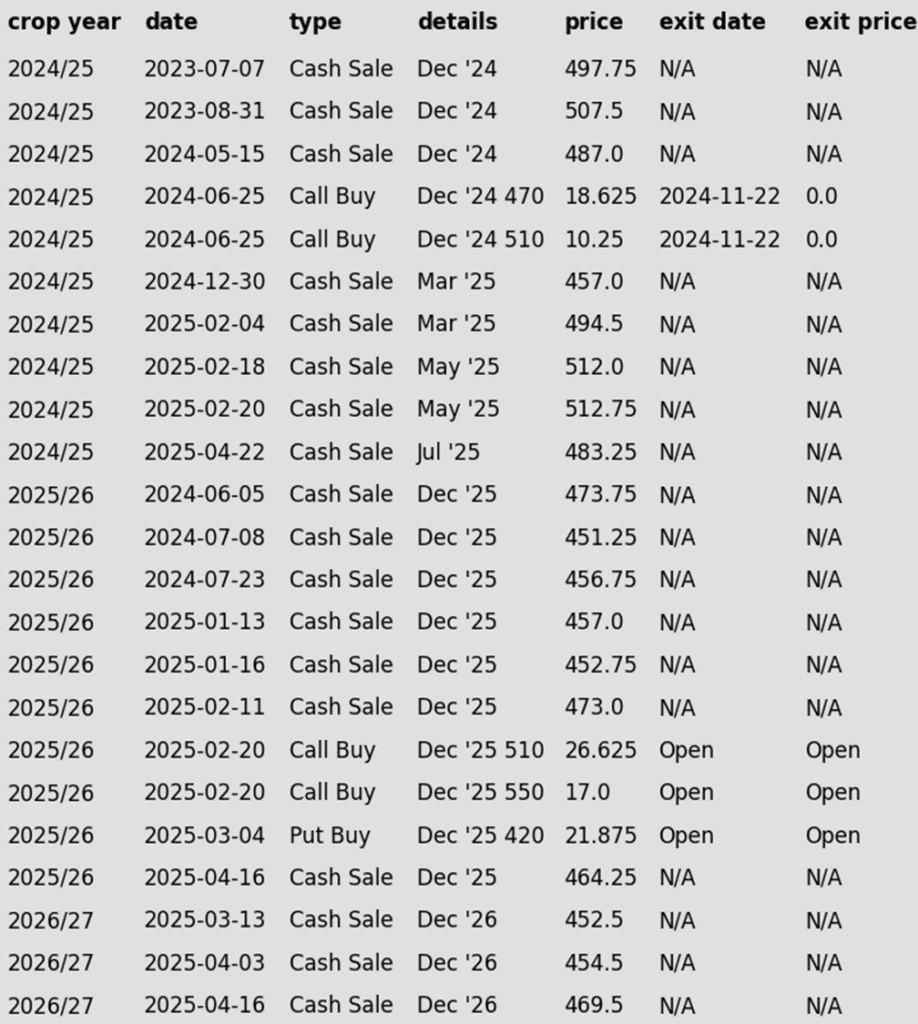
Market Notes: Corn
- Corn futures faced sharp selling pressure on Tuesday, with weakness in the July contract spilling over into the broader complex. The market was weighed down by strong planting progress, early harvest reports from Brazil, and growing concerns about waning U.S. export demand.
- Brazil has just begun its harvest of their second crop corn. The weather has been very good for most regions, and the market is anticipating a strong crop. USDA is currently projecting this crop at 130 MMT, but there are “whisper” numbers up to 140 MMT.
- Brazilian corn prices have fallen, making them competitive with U.S. exports. Reports suggest that some Asian buyers secured Brazilian supplies this week, raising the risk of U.S. export sales cancellations as demand shifts south.
- U.S. planting is nearing completion, with the USDA reporting 87% of corn acres planted as of May 25, up 5 percentage points from last week. While national progress is on track, states like Illinois and others in the Eastern Corn Belt remain behind average, largely due to excessive rainfall. Final planting dates in these regions are fast approaching in early June.
- USDA released the first initial corn crop ratings in Tuesday’s report. As of May 25, the USDA found that 68% of the crop was good/excellent. This was 5% below analysts’ expectations. These ratings were the third lowest in the past 10 years and 4% behind the 3-year average. Wet and cool temperatures limit a strong start in some areas and capped the first crop ratings.
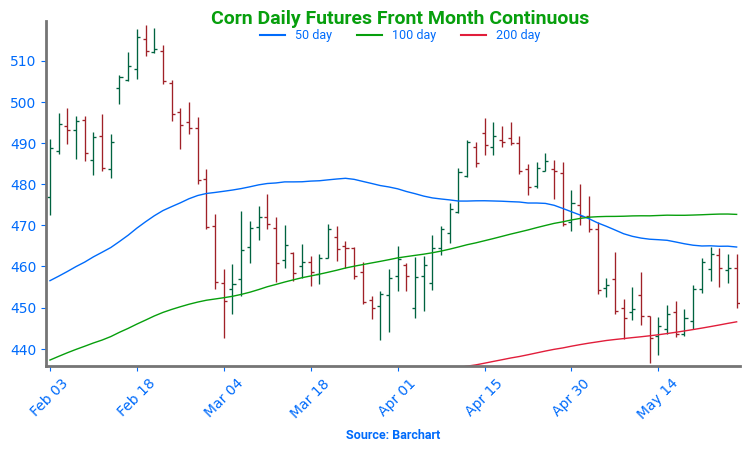
Corn Finds Support at 200-day
After bouncing off the key $4.50 level in April on a bullish WASDE and a break above the 50-day moving average, corn futures have come under renewed pressure in May. Rapid planting progress and lingering demand concerns have pushed prices back below $4.70. For now, the $4.45–$4.50 support zone and 200-day moving average have held. As planting wraps up, the market’s focus will shift quickly to summer weather. NOAA’s extended outlook calls for a warmer, drier pattern across the Western Corn Belt into June — potentially rekindling risk premium and setting the stage for weather-driven rallies. Initial resistance is expected near $4.70, with stronger resistance at the April highs around $4.90.
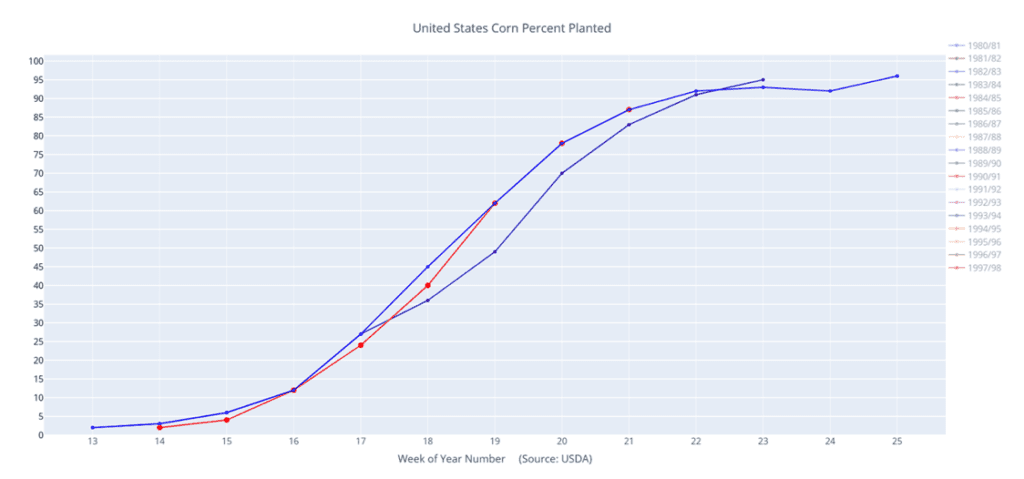
Above: Corn percent planted (red) versus the 10-year average (blue) and last year (purple).
Soybeans
Action Plan: Soybeans
Calls
2024
No New Action
2025
No New Action
2026
No New Action
Cash
2024
No New Action
2025
No New Action
2026
No New Action
Puts
2024
No New Action
2025
No New Action
2026
No New Action
2024 Crop:
- Plan A: Next cash sale at 1107 vs July.
- Plan B: No active targets.
- Details:
- Sales Recs: Three sales recommendations made to date, with an average price of 1089.
- Changes:
- None.
- Still content with the 1107 target as long as 1036 support holds. If that support level is broken, the current strategy will need to be revisited and potentially adjusted.
2025 Crop:
- Plan A:
- Next cash sales at 1114 vs November.
- Exit one-third of 1100 call options at 1085 vs November.
- Exit remaining two-thirds of 1100 November call options at 88 cents.
- Plan B:
- Make a cash sale if November closes below 1018.50 support.
- Details:
- Sales Recs: One sales recommendation made so far to date, at 1063.50.
- Changes:
- In about a week, another tranche of January put options may be recommended based on the calendar and seasonal timing considerations.
2026 Crop:
- Plan A: No active targets.
- Plan B: No active targets.
- Details:
- Sales Recs: Zero sales recommendations made so far to date.
- Changes:
- None.
- Approaching the seasonal window where first sales targets could post at any time.
To date, Grain Market Insider has issued the following soybean recommendations:
Market Notes: Soybeans
- Soybeans ended the day lower with the July contract closing just below the 100-day moving average for the first time since the beginning of the month. There has been little fresh news, but the continued quick planting pace and lower soy products were the primary pressure today.
- Yesterday’s Crop Progress report saw the soybean crop 76% planted, which compared to 66% last week and the 5-year average of 68%. 50% of the crop has emerged, and good to excellent ratings will likely come within a few weeks.
- In Argentina, the recent rains and severe flooding near Buenos Aires will likely impact the country’s total production. One prominent South American crop scout has lowered their estimate by 1.6 mmt for total production of 48.5 mmt. In Brazil, soybean production is estimated near 170 mmt.
- At this time, funds are estimated to hold a net long position in soybeans of around 10,000 contracts and are estimated to have a long position in soybean oil around 59,000 contracts. In soybean meal, however, they hold a net short position of over 100,000 contracts, which is a record short position and could trigger short covering at some point.
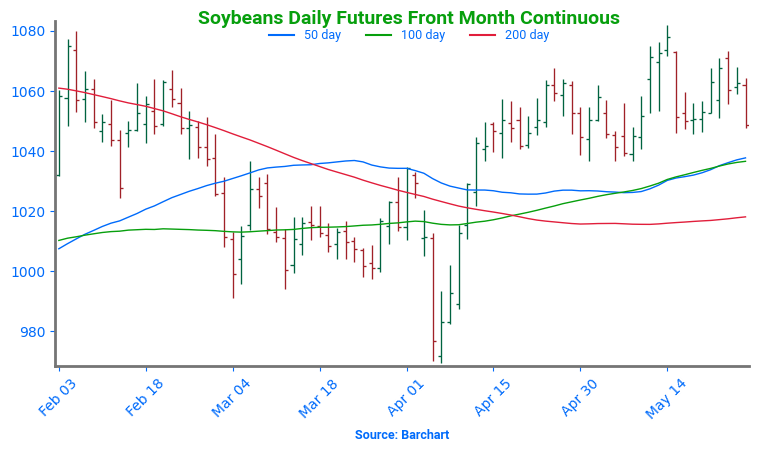
Soybean Futures Hover Near Top of Yearly Range Amid Renewed Optimism
After tumbling below the psychologically important 1000 mark in early April on tariff-related headlines, soybean futures appeared to be in freefall. The break of the March floor sparked a wave of technical selling, briefly sending prices spiraling. But the decline proved fleeting. Buyers quickly stepped in, reversing the momentum and powering futures back above 1000, reclaiming key moving averages along the way.
Of particular note was the clean break above the 200-day moving average — a barrier that had long capped upside attempts. With that ceiling now acting as solid support, bullish sentiment has taken the driver’s seat. Futures are now consolidating near the upper end of their 2024 range, setting their sights on a potential retest of the February peak around $10.80. As long as pullbacks hold the 200-day line, the path of least resistance may remain higher.
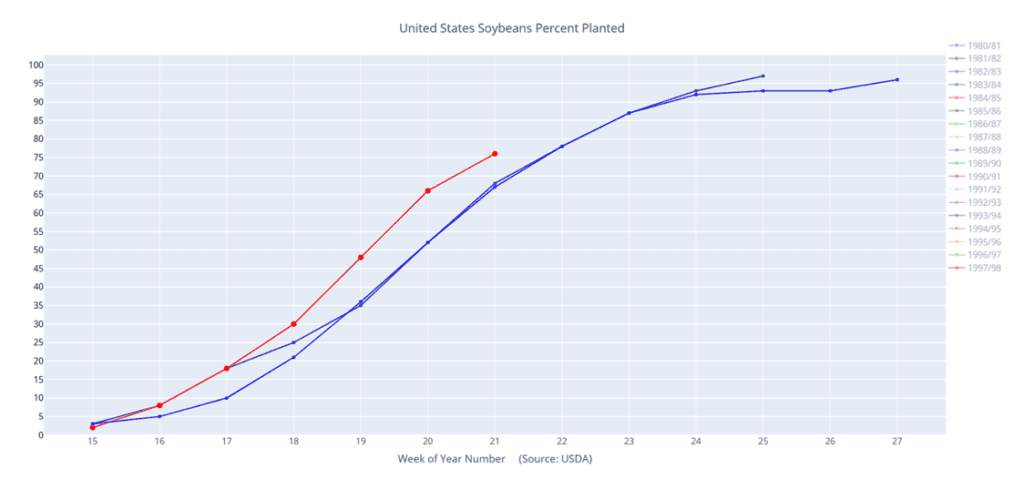
Above: Soybeans percent planted (red) versus the 10-year average (blue) and last year (purple).
Wheat
Market Notes: Wheat
- Wheat futures closed mixed after choppy trade, with Minneapolis leading to the upside following weaker-than-expected spring wheat condition ratings. In contrast, HRW wheat came under pressure as recent rains and warming temperatures are expected to benefit the crop. Technically, both Chicago and Kansas City contracts have lost momentum, with daily stochastics and RSI indicators turning lower, while Minneapolis futures trend sideways to higher.
- USDA’s Crop Progress report showed winter wheat conditions declining 2 points to 50% good/excellent, while 75% of the crop is headed—above the 70% five-year average. Spring wheat planting reached 87% (vs. 80% avg.), and 60% of the crop has emerged. However, only 45% was rated good/excellent, missing expectations and supporting Minneapolis’ futures.
- India’s wheat harvest is reportedly going well and is now expected to be about 4 mmt above last year’s crop. This could push their state reserves to 44 mmt this year, well above what is needed to meet domestic demand. This has effectively eliminated earlier anticipation that they might need to import wheat this year, which is now likely to pressure global prices. Despite this, however, the Indian government still has no plan to allow wheat exports, which were prohibited in 2022.
- According to the German association of farm cooperatives, their nation’s 2025 wheat harvest is expected to total 21.01 mmt, which would be down 0.40 mmt from their previous estimate. However, if realized this would still be a 13.6% larger crop year over year. Yield reductions from late winter frosts and drought in the spring are cited as the reasons for the decline from the prior estimate.
Action Plan: Chicago Wheat
Calls
2024
No New Action
2025
No New Action
2026
No New Action
Cash
2024
No New Action
2025
No New Action
2026
No New Action
Puts
2024
No New Action
2025
No New Action
2026
No New Action
2024 Crop:
- Plan A:
- Target 699.25 vs July for the next sale.
- Plan B: No active targets.
- Details:
- Sales Recs: Four sales recommendations made to date, with an average price of 690.
- Changes:
- None.
- While 699.25 is still a long way off, it’s tough to justify adjusting it lower at this point — historically, when volatility shows up this time of year, it can be significant.
2025 Crop:
- Plan A:
- Target 693.75 against July for the next sale.
- Plan B:
- Buy call options if July closes over 633.50 macro resistance.
- Details:
- Sales Recs: Five sales recommendations made to date, with an average price of 646.
- Changes:
- Plan B Update: A Plan B Update: A Plan B upside call buy stop has been added, with 633.50 identified as a key resistance level for the broader trend. A close above this level could indicate a shift toward a more bullish macro trend. In that scenario, buying call options would enable sales into strength while maintaining paper ownership.
- The purpose of this stop is to try to avoid recommending call option purchases unless the market clearly signals it’s warranted — and a close above 633.50 would be that signal. As long as the market remains below this level, the expectation is for a continued sideways-to-lower macro trend, where call options would provide little or no benefit.
2026 Crop:
- Plan A:
- Target 675 vs July ‘26 for the next sale.
- Plan B: No active targets.
- Details:
- Sales Recs: One sales recommendation made to date, at 624.
- Changes:
- None.
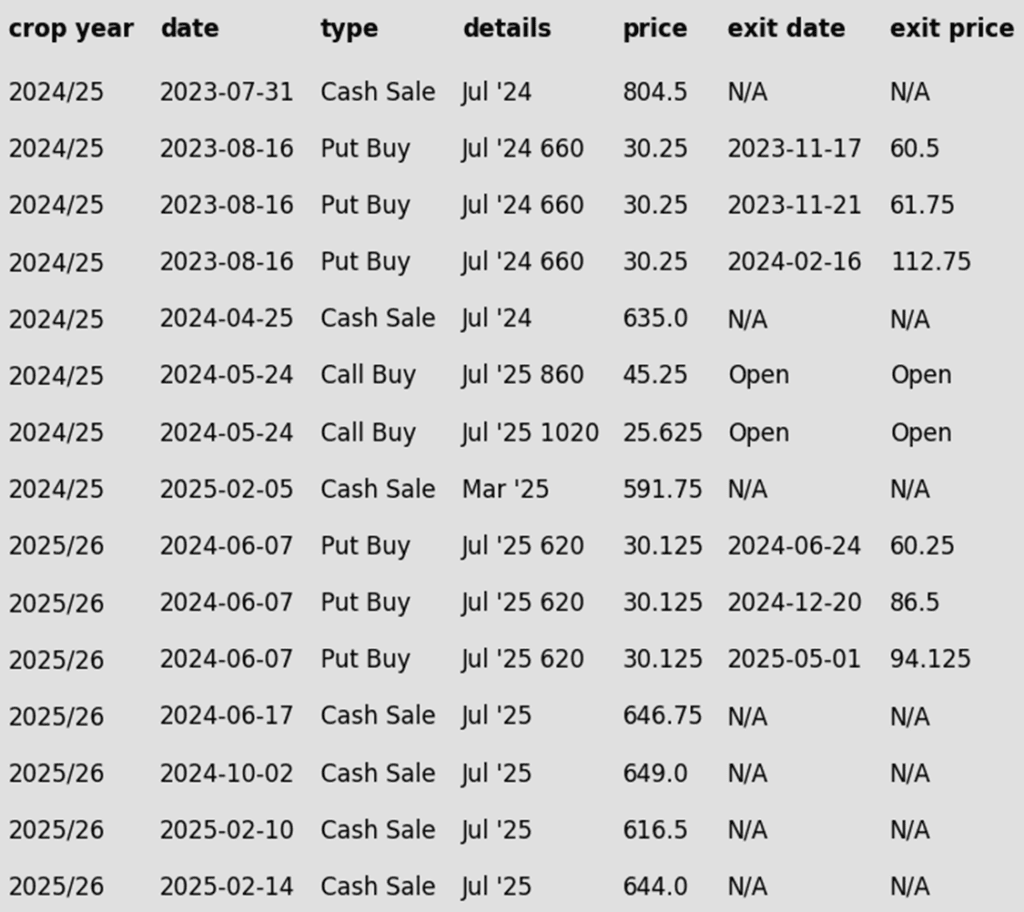
To date, Grain Market Insider has issued the following Chicago Wheat recommendations:
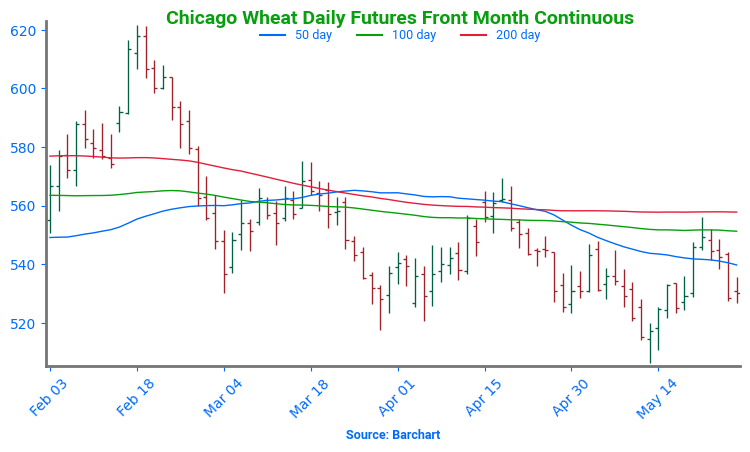
Chicago Wheat Looking for Support
After months of range-bound trading, Chicago wheat futures broke out in February, climbing to October highs just above 615. However, the rally proved short-lived, with prices quickly retreating back into their 2024 range. By mid-May, futures broke below key support near 530 and are now searching for a bottom around the 520 level. The next major technical hurdle is the 200-day moving average — a firm weekly close above this level could signal a potential trend reversal and open the door to a broader uptrend.
Action Plan: KC Wheat
Calls
2024
No New Action
2025
No New Action
2026
No New Action
Cash
2024
No New Action
2025
No New Action
2026
No New Action
Puts
2024
No New Action
2025
No New Action
2026
No New Action
2024 Crop:
- Plan A: No active targets.
- Plan B: No active targets.
- Details:
- Sales Recs: Three sales recommendations made to date, with an average price of 677.
- Changes:
- None.
2025 Crop:
- Plan A: No active targets.
- Plan B:
- Buy call options if July closes over 653 macro resistance.
- Details:
- Sales Recs: Four sales recommendations made to date, with an average price of 639.
- Changes:
- Plan B Update: A Plan B upside call buy stop has been added, with 653 identified as a key resistance level for the broader trend. A close above this level could indicate a shift toward a more bullish macro trend. In that scenario, buying call options would enable sales into strength while maintaining paper ownership.
- The purpose of this stop is to try to avoid recommending call option purchases unless the market clearly signals it’s warranted — and a close above 653 would be that signal. As long as the market remains below this level, the expectation is for a continued sideways-to-lower macro trend, where call options would provide little or no benefit.
2026 Crop:
- Plan A: No active targets.
- Plan B: No active targets.
- Details:
- Sales Recs: Zero sales recommendations made so far to date.
- Changes:
- None.
- First sales targets are expected to post after June 1.
To date, Grain Market Insider has issued the following KC recommendations:
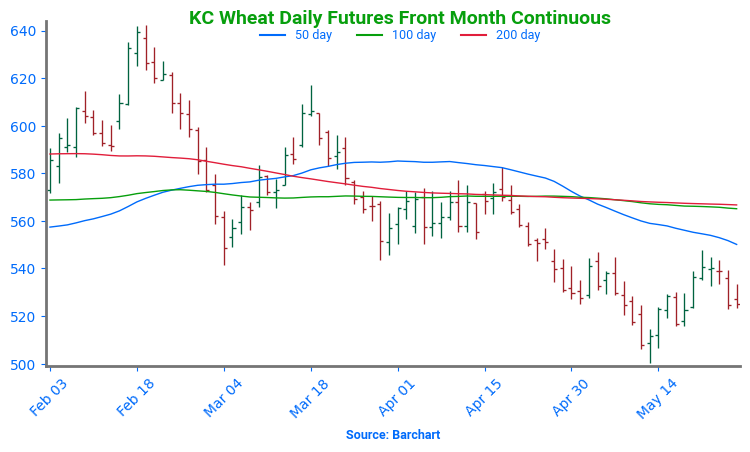
Kansas City Wheat Searching for Support
Kansas City wheat experienced sharp volatility in February, rallying early before settling flat by month’s end. Persistent weakness through March and April pushed prices toward recent lows — and the market broke below that support to start May. A recovery back above the prior 540 level would signal a potential bottom. On a rebound, the 200-day moving average stands as the first resistance, with a more formidable ceiling at the February highs near 640.
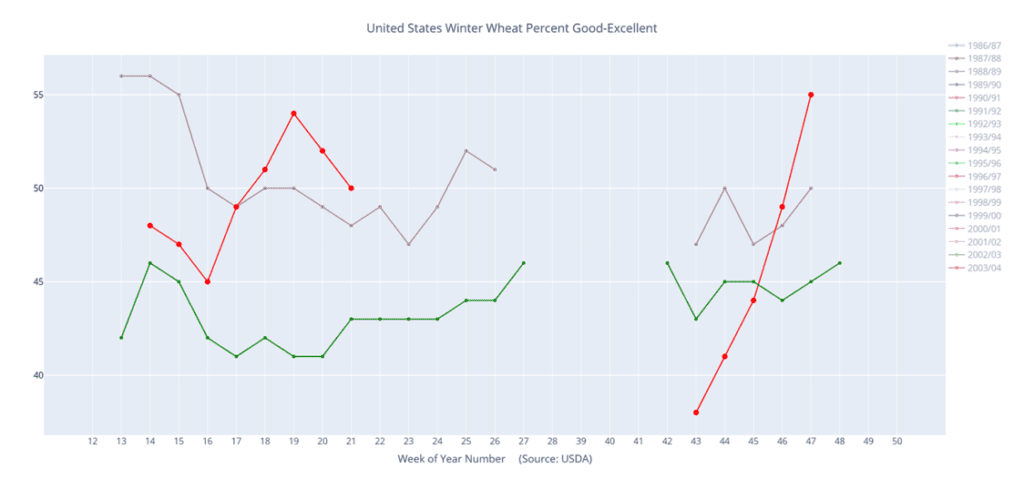
Above: Winter wheat percent planted (red) versus the 5-year average (green) and last year (purple).
Action Plan: Mpls Wheat
Calls
2024
No New Action
2025
No New Action
2026
No New Action
Cash
2024
No New Action
2025
No New Action
2026
No New Action
Puts
2024
No New Action
2025
No New Action
2026
No New Action
2024 Crop:
- Plan A: No active targets.
- Plan B: No active targets.
- Details:
- Sales Recs: Five sales recommendations made to date, with an average price of 696.
- Changes:
- None.
2025 Crop:
- Plan A: No active targets.
- Plan B:
- Buy KC call options if July KC closes over 653 macro resistance.
- Note: KC options are being used due to the strong correlation between KC and Minneapolis futures prices, as well as the greater liquidity found in the KC options market.
- Details:
- Sales Recs: Five sales recommendations made to date, with an average price of 646.
- Changes:
- Plan B Update: A Plan B upside call buy stop has been added, with KC 653 identified as a key resistance level for the broader trend. A close above this level could indicate a shift toward a more bullish macro trend. In that scenario, buying call options would enable sales into strength while maintaining paper ownership.
- The purpose of this stop is to try to avoid recommending call option purchases unless the market clearly signals it’s warranted — and a close above KC 653 would be that signal. As long as the market remains below this level, the expectation is for a continued sideways-to-lower macro trend, where call options would provide little or no benefit.
2026 Crop:
- Plan A: No active targets.
- Plan B: No active targets.
- Details:
- Changes:
- None.
- First sales targets are expected to post after July 1.
- Changes:
To date, Grain Market Insider has issued the following Minneapolis wheat recommendations:

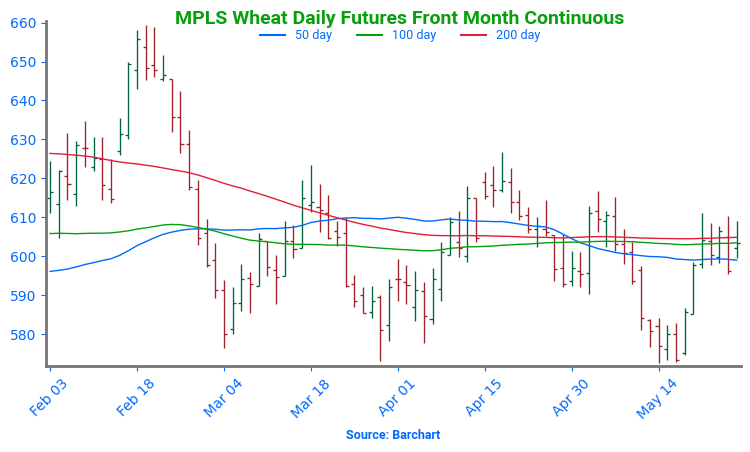
Spring Wheat Holds Recent Lows
Spring wheat futures broke out of a prolonged sideways trend in late January, sparking a wave of bullish momentum. The rally gained strength in mid-February with a decisive close above the 200-day moving average. However, late-month weakness briefly dragged futures back below key support levels.
Currently, futures are retreating toward recent lows, pressured by strong planting progress and favorable weather conditions across major spring wheat-growing regions. On a potential rebound, initial resistance is expected near the 600 level, where a confluence of moving averages could cap gains.
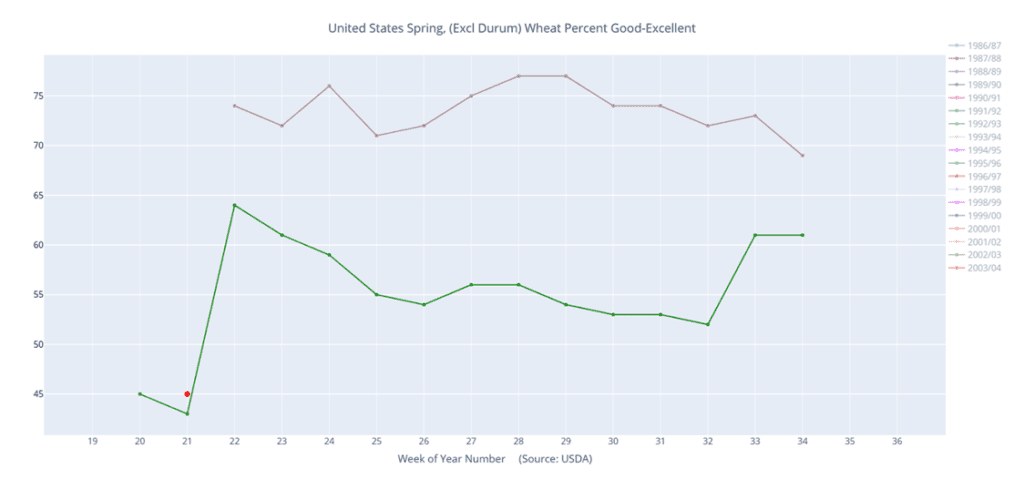
Above: Spring wheat condition percent good-excellent (red) versus the 5-year average (green) and last year (pink).
Other Charts / Weather