3-31 End of Day: Corn and Wheat Higher, Soybeans Lower Following USDA Report
All Prices as of 2:00 pm Central Time
| Corn | ||
| MAY ’25 | 457.25 | 4 |
| JUL ’25 | 463.25 | 3.25 |
| DEC ’25 | 442 | -0.5 |
| Soybeans | ||
| MAY ’25 | 1014.75 | -8.25 |
| JUL ’25 | 1028.25 | -9 |
| NOV ’25 | 1019.25 | -9.75 |
| Chicago Wheat | ||
| MAY ’25 | 537 | 8.75 |
| JUL ’25 | 550.5 | 7.75 |
| JUL ’26 | 621 | 2.75 |
| K.C. Wheat | ||
| MAY ’25 | 557 | 5.25 |
| JUL ’25 | 570 | 4.5 |
| JUL ’26 | 636.75 | 0.75 |
| Mpls Wheat | ||
| MAY ’25 | 592 | 11 |
| JUL ’25 | 606.75 | 10.25 |
| SEP ’25 | 619.75 | 9.5 |
| S&P 500 | ||
| JUN ’25 | 5644 | 21 |
| Crude Oil | ||
| MAY ’25 | 71.59 | 2.23 |
| Gold | ||
| JUN ’25 | 3155 | 40.7 |
Grain Market Highlights
- Corn: Futures ended mixed with gains centered in the front months, while a larger-than-expected planting estimate limited new crop gains.
- Soybeans: Ended lower despite a supportive planting intentions report. Soybean meal and oil also ended the day lower.
- Wheat: Led the grain complex higher Monday with spring wheat posting the largest gains. A supportive USDA report and solid export inspections provided a boost.
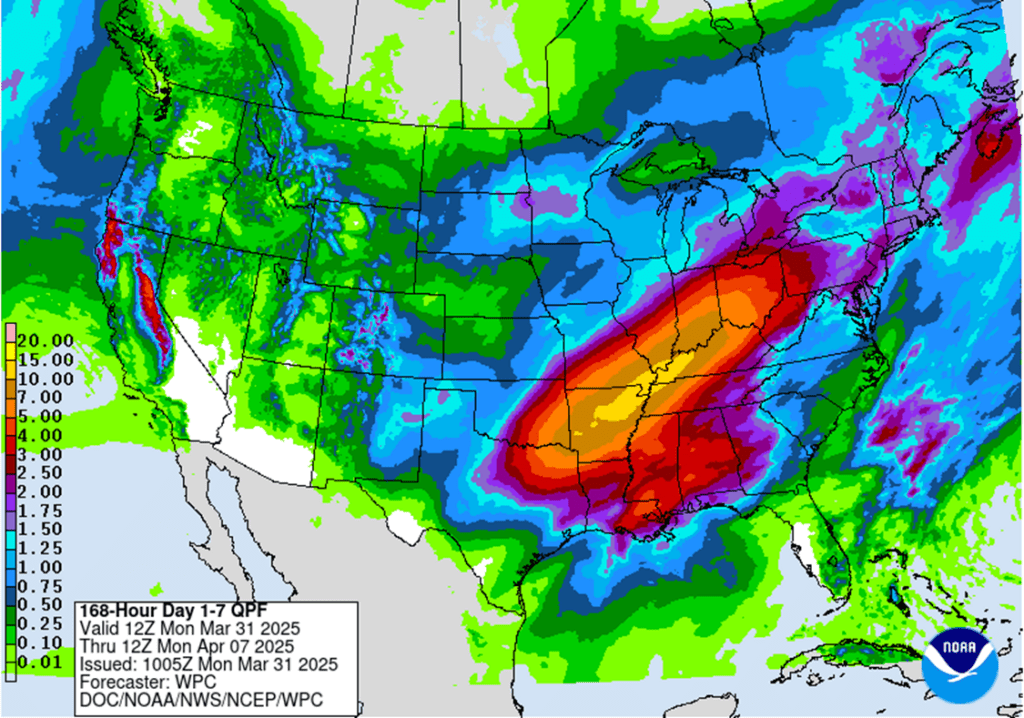
- To see the updated USDA 2025 Corn and Soybean Planted Acreage by State Maps as well as the 7-day U.S. Precipitation outlook, scroll down to the other charts/weather section.
Note – For the best viewing experience, some Grain Market Insider content is best viewed with your phone held horizontally.
Corn
Action Plan: Corn
Calls
2024
No New Action
2025
No New Action
2026
No New Action
Cash
2024
No New Action
2025
No New Action
2026
No New Action
Puts
2024
No New Action
2025
No New Action
2026
No New Action
2024 Crop:
- Plan A: No active targets.
- Plan B: No active targets.
- Details:
- No Changes Post-Report: Today’s post-report price action didn’t trigger any new price targets. The recommendation remains to sit tight and stay the course for now.
2025 Crop:
- Plan A: Exit all 510 December calls @ 43-5/8 cents. Exit half of the December 420 puts @ 43-3/4 cents.
- Plan B: No active targets.
- Details:
- No Changes Post-Report: Today’s post-report price action didn’t trigger any new price targets. The recommendation remains to sit tight and stay the course for now.
2026 Crop:
- Plan A: Next cash sale at 456 vs December ‘26.
- Plan B: No active targets.
- Details:
- Recs: One sales recommendation made so far.
- New Target: A second sale target for the 2026 crop has been activated at 456.
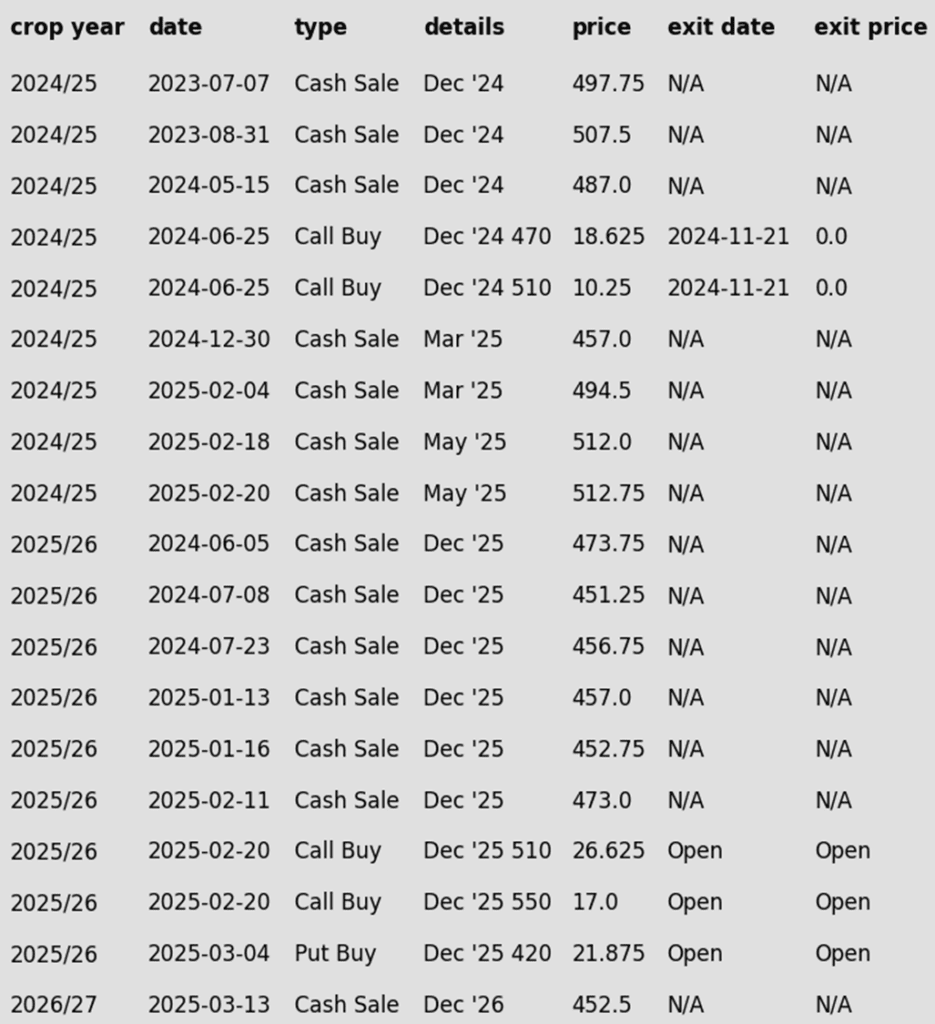
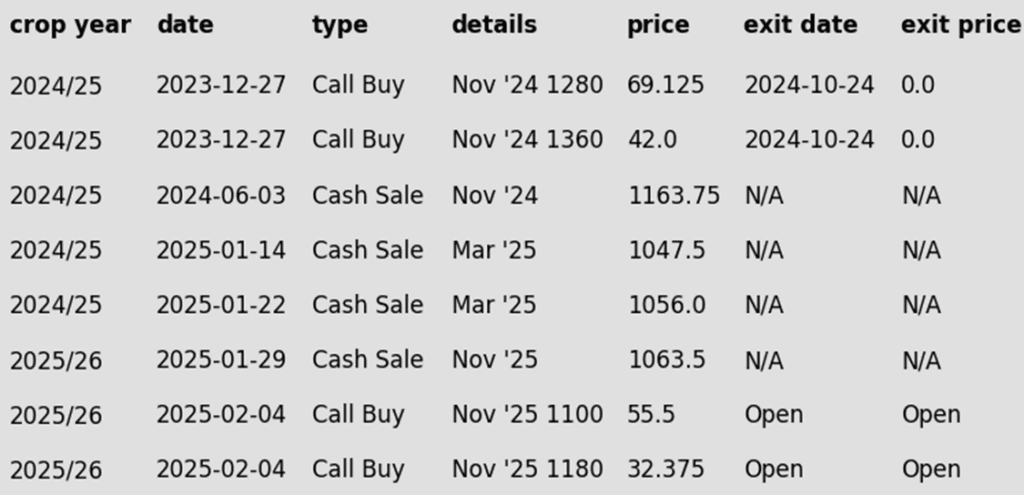
To date, Grain Market Insider has issued the following corn recommendations:
Market Notes: Corn
- The corn market ended mixed, with strong demand and a supportive Grain Stocks report lifting old crop prices, while a larger-than-expected planting estimate limited new crop gains.
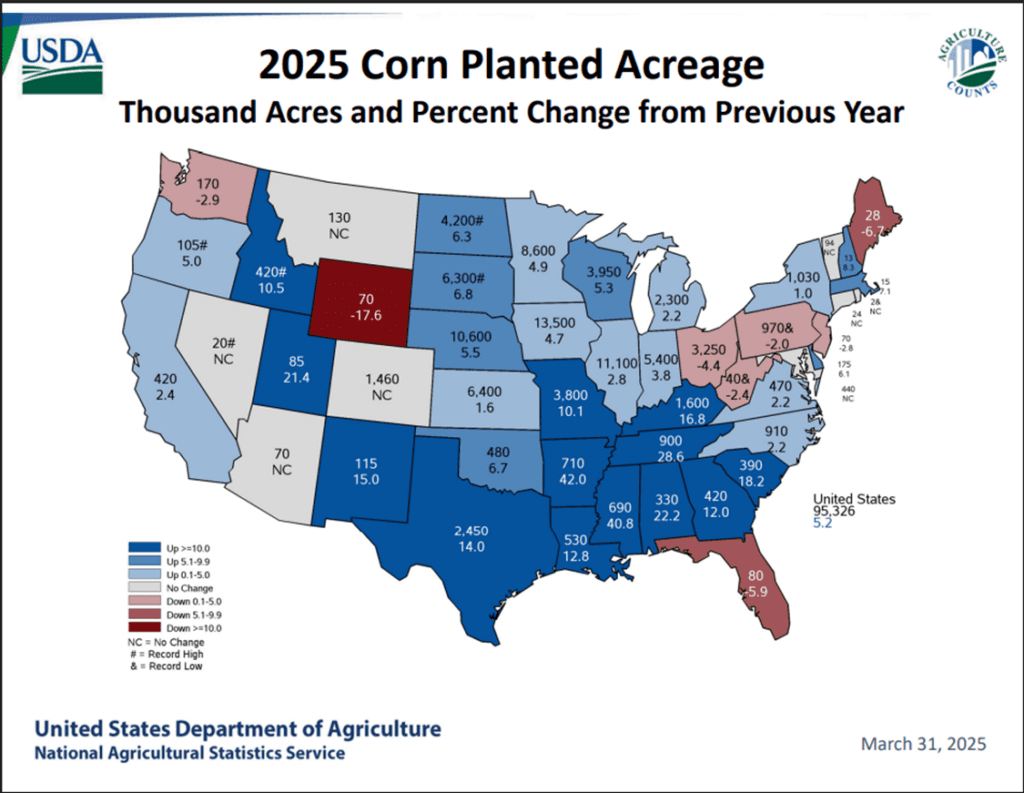
- The USDA’s Prospective Plantings Report projected 95.4 million acres of U.S. corn for the upcoming crop year — 965,000 acres above market expectations and 4.76 million acres more than last year. This marks the highest planted acreage since 2013-14, with the largest percentage increases seen in the Northwest and Southern regions, likely replacing soybean, spring wheat, and cotton acres.
- March 1 quarterly grain stocks for corn came in at 8.151 billion bushels, aligning with market expectations but 200 million bushels below last year, reflecting strong demand in the first half of the marketing year.
- The USDA released weekly export inspections on Monday morning. Export inspections remain strong at 1.614 MMT (63.6 mb) and above market expectations. Total export shipments are still trending 31% ahead of last year.
- With Monday’s USDA reports behind the market, attention now shifts to demand, South American weather, and looming tariff issues. The April 2 tariff deadline could be the most immediate factor influencing market direction.
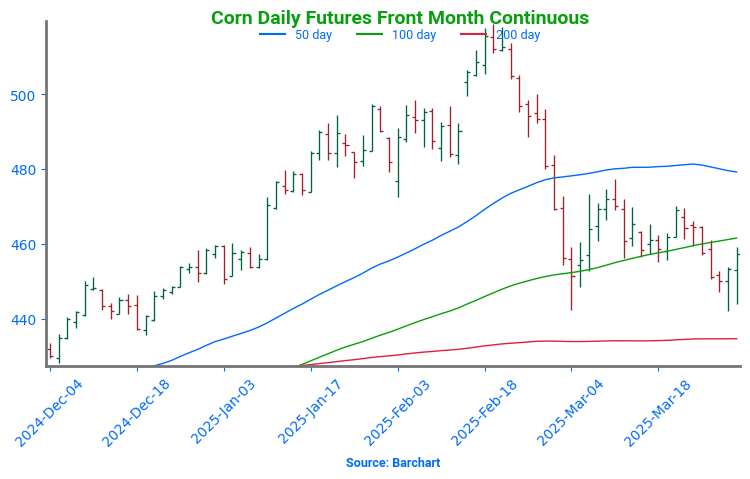
Corn Finds Its Footing After Sharp Pullback
After soaring to 16-month highs in late February, corn futures took a steep dive, retreating to test key technical levels. Prices recently found support near 450, aligning with both the 100-day moving average and a critical trendline—potentially marking a short-term low as the market pivots toward spring planting.
A rebound from this level suggests renewed strength, but hurdles remain. Initial resistance looms near the 50-day moving average, while stronger support sits deeper at the 200-day moving average. With the USDA’s March Planting Intentions report now behind us, weather developments in both South America and the U.S., volatility could return swiftly, keeping traders on high alert.
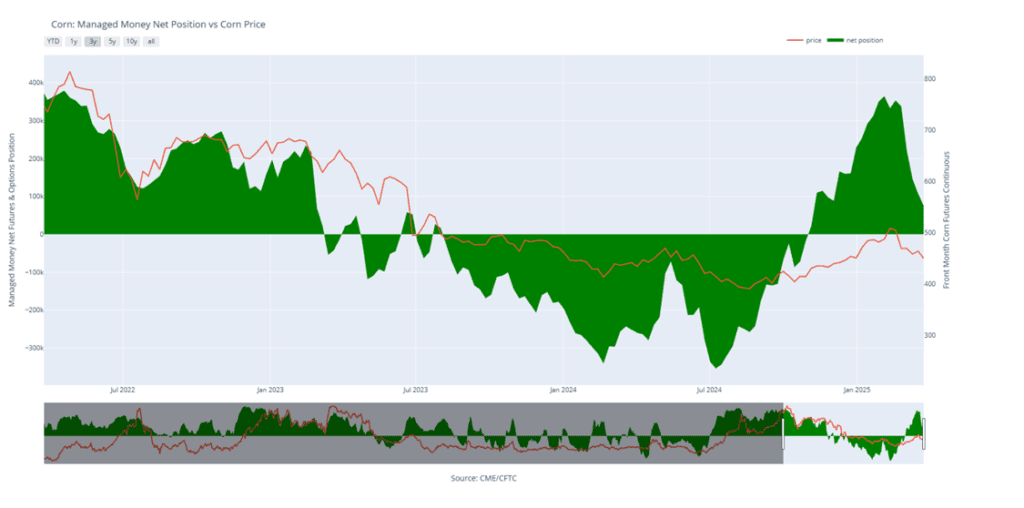
Above: Corn Managed Money Funds net position as of Tuesday, March 25. Net position in Green versus price in Red. Money Managers net sold 32,663 contracts between March 18 – March 25, bringing their total position to a net long 74,607 contracts.
Soybeans
Action Plan: Soybeans
Calls
2024
No New Action
2025
No New Action
2026
No New Action
Cash
2024
No New Action
2025
No New Action
2026
No New Action
Puts
2024
No New Action
2025
No New Action
2026
No New Action
2024 Crop:
- Plan A: Next cash sale at 1107 vs May. Buy calls with a close over 1079.75 vs May.
- Plan B: No active targets.
- Details:
- No Changes Post-Report: Today’s post-report price action didn’t trigger any changes to the current targets.
2025 Crop:
- Plan A: Next cash sales at 1093 & 1114 vs November. Exit all 1100 November call options at 88 cents.
- Plan B: No active targets.
- Details:
- New Target: Today’s post-report price action activated an additional sales target at 1093 vs November. With one sales recommendation made to date, a move to 1093 would trigger the second, and 1114 would trigger the third.
2026 Crop:
- Plan A: No active targets.
- Plan B: No active targets.
- Details:
- No Changes Post-Report: Today’s post-report price action didn’t trigger any changes. The expectation is still for targets to begin posting in a month or two.
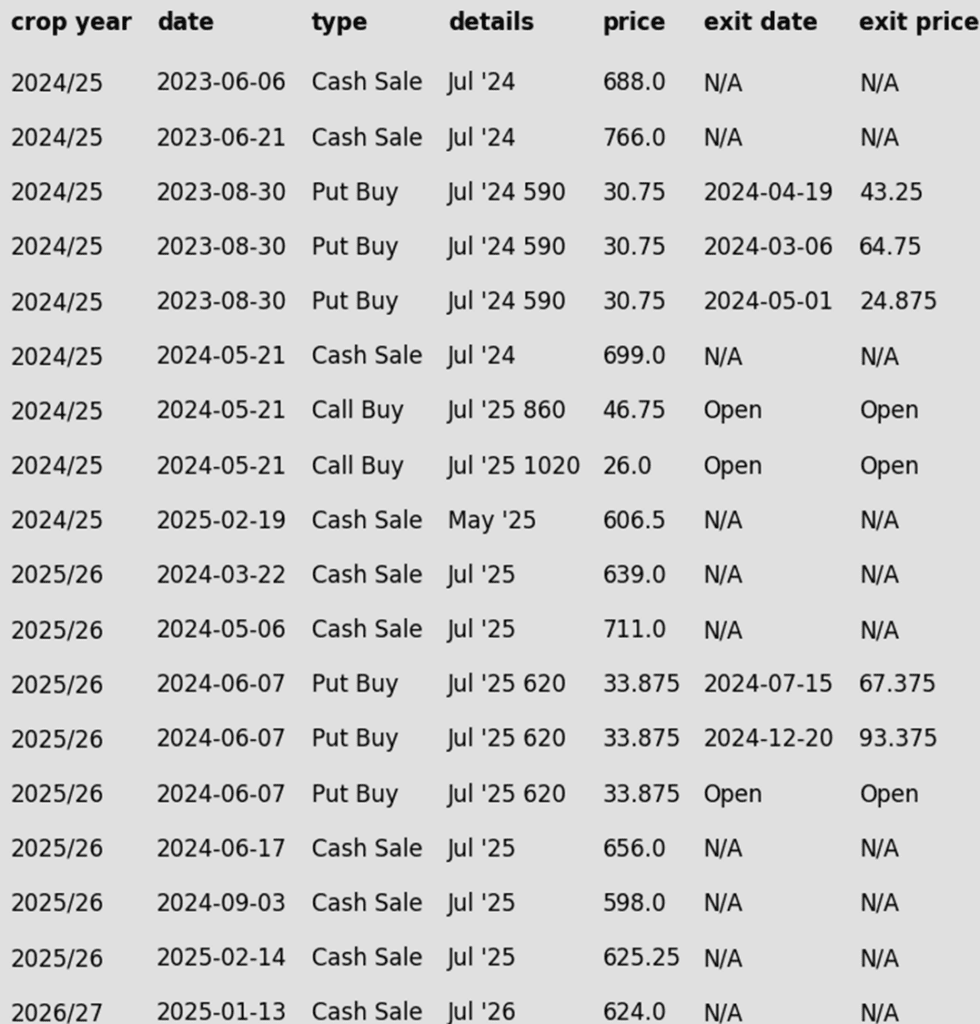
To date, Grain Market Insider has issued the following soybean recommendations:
Market Notes: Soybeans
- Soybeans were lower to end the day despite a friendly Planting Intentions report. Much of this report seemed to be priced in over the course of last week, and now trade will focus on the upcoming tariffs which are set to be released on Wednesday. The size of the Brazilian soybean crop also remains a concern. Both soybean meal and oil were also lower to end the day.
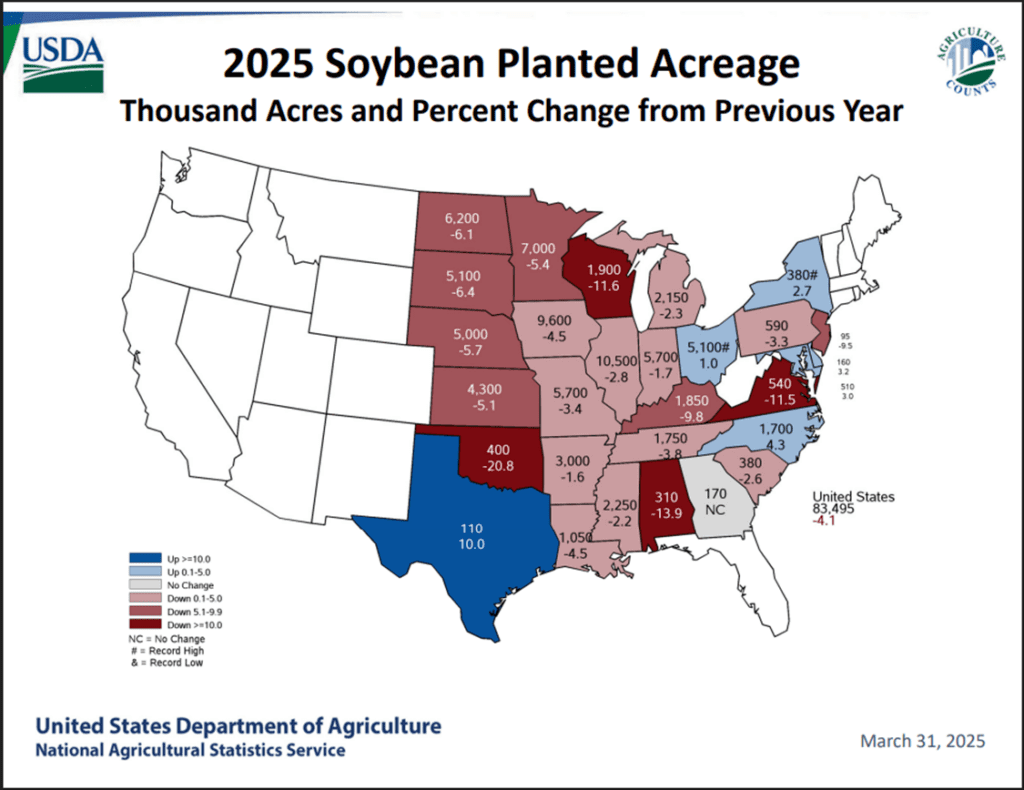
- The USDA’s Prospective Plantings report estimated 2025 soybean acreage at 83.50 million acres, slightly below the average trade estimate of 83.76 million acres and significantly lower than last year’s 87.05 million acres. Acreage adjustments remain possible ahead of planting.
- The Quarterly Grain Stocks report was largely in line with expectations, with March 1 soybean stocks at 1.910 billion bushels, slightly above the trade estimate of 1.901 billion and up from 1.845 billion a year ago.
- Friday’s CFTC report saw funds as sellers of soybeans by 20,954 contracts which increased their net short position to 42,959 contracts. They sold 17,009 contracts of bean oil and 23,037 contracts of meal.
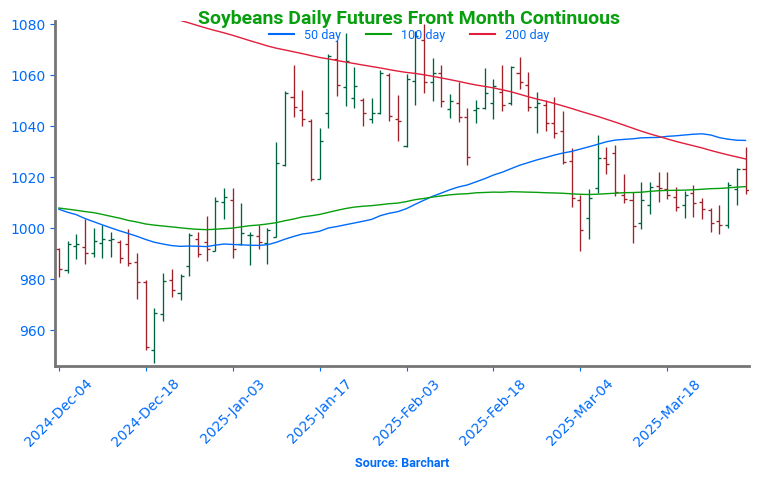
Soybeans Find Support Near 1000
Soybean futures tested the 200-day moving average in early 2025, a stubborn resistance level that has kept rallies in check for 18 months. As March unfolded, favorable weather and harvest pressure from South America triggered a sharp selloff, sending prices tumbling. Despite the decline, support held firm around the psychological 1000 level, with a stronger backing near 950. If the market continues to rebound, initial resistance sits at 1030, but the 200-day moving average remains a formidable hurdle.
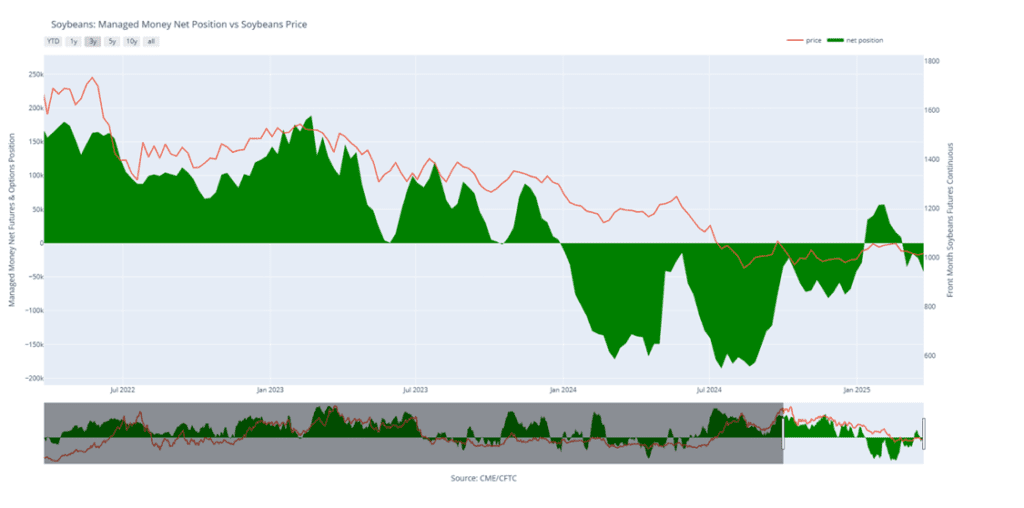
Above: Soybean Managed Money Funds net position as of Tuesday, March 25. Net position in Green versus price in Red. Money Managers net sold 20,954 contracts between March 18 – March 25, bringing their total position to a net short 42,959 contracts.
Wheat
Market Notes: Wheat
- Wheat futures closed higher, led by gains in spring wheat, as supportive USDA data, solid export inspections, and strength in Matif wheat provided a boost to the U.S. market.
- The USDA estimated March 1 wheat stocks at 1.237 billion bushels, up from 1.089 billion a year ago and slightly above trade expectations. However, the acreage report was the real driver, with all wheat acreage projected at 45.4 million acres — on the low end of estimates and down from 46.1 million acres in 2024. If realized, this would be the second smallest wheat planted area since 1919.
- In a breakdown by class, winter wheat acreage comes in at 33.3 ma, vs 33.4 ma last year. Spring wheat acres were projected at 10.0 ma, down from 10.6 ma a year ago. Finally, durum wheat acreage is estimated at 2.0 ma, compared with 2.1 ma in 2024.
- Weekly wheat inspections reached 16 mb, bringing the total 24/25 inspections figure to 635 mb, up 16% from last year; this is slightly behind the USDA’s estimated pace. They are forecasting 24/25 exports at 835 mb, up 18% from the year prior.
- According to their agriculture ministry, Ukraine has planted 551,800 hectares of spring grain is of last Friday – this is up 16% from the same time last year. Of that total, spring wheat has reached 79,800 hectares, up 17% year over year.
Action Plan: Chicago Wheat
Calls
2024
No New Action
2025
No New Action
2026
No New Action
Cash
2024
No New Action
2025
No New Action
2026
No New Action
Puts
2024
No New Action
2025
No New Action
2026
No New Action
2024 Crop:
- Plan A: Target 701 against May for the next sale.
- Plan B: No active targets.
- Details:
- No Changes Post-Report: Today’s post-report price action didn’t trigger any changes to the current 701 price target.
2025 Crop:
- Plan A: Target 705.50 against July for the next sale.
- Plan B: No active targets.
- Details:
- New Target: Today’s post-report price action prompted an adjustment to the prior 714 price target, which has been lowered to 705.50 vs July.
2026 Crop:
- Plan A: Target 704 against July ‘26 for the next sale
- Plan B: No active targets.
- Details:
- No Changes Post-Report: Today’s post-report price action didn’t trigger any changes to the current 704 price target.
To date, Grain Market Insider has issued the following Chicago Wheat recommendations:
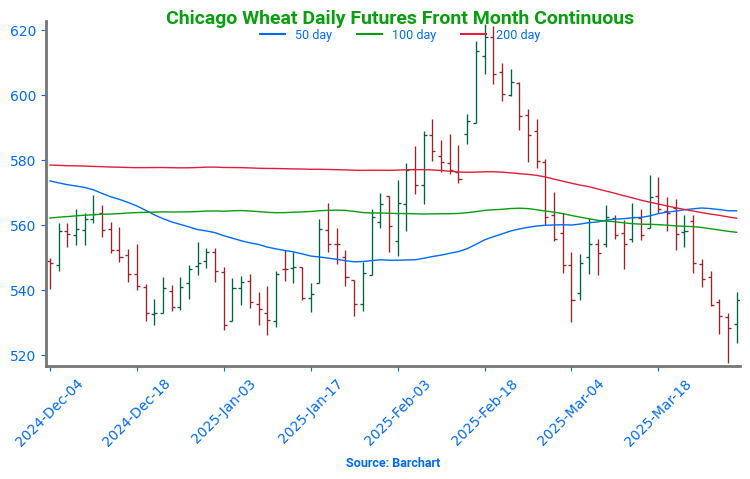
Chicago Wheat Faces Key Test After February Surge
After months of sideways grinding, Chicago wheat broke out in February, rallying to early October highs just above 615. However, that mid-month peak quickly turned into a reversal point, with futures slipping back into the previous trading range that defined late 2024. Support near 540 failed to hold late last week, but prices are attempting a rebound to start April. The next key resistance level is the 200-day moving average, which now serves as a major test. A decisive weekly close above this level could shift momentum, potentially signaling a trend reversal and renewed upside.
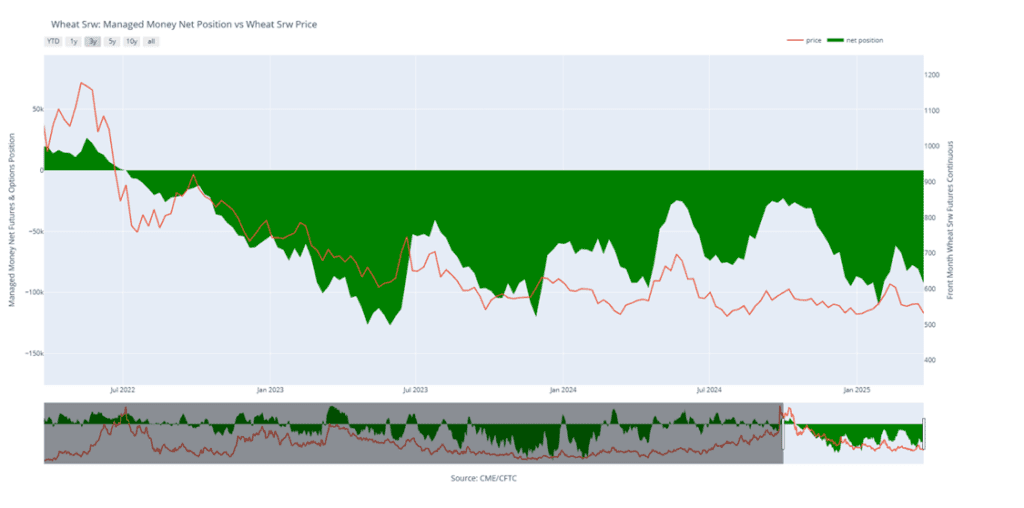
Above: Chicago Wheat Managed Money Funds’ net position as of Tuesday, March 25. Net position in Green versus price in Red. Money Managers net sold 11,919 contracts between March 18 – March 25, bringing their total position to a net short 92,587 contracts.
Action Plan: KC Wheat
Calls
2024
No New Action
2025
No New Action
2026
No New Action
Cash
2024
No New Action
2025
No New Action
2026
No New Action
Puts
2024
No New Action
2025
No New Action
2026
No New Action
2024 Crop:
- Plan A: No active targets.
- Plan B: No active targets.
- Details:
- No Changes Post-Report: Today’s post-report price action didn’t trigger any new price targets. The recommendation remains to sit tight and stay the course for now.
2025 Crop:
- Plan A: Target 677 against July for the next sale.
- Plan B: No active targets.
- Details:
- No Changes Post-Report: Today’s post-report price action didn’t trigger any changes to the current 677 price target.
2026 Crop:
- Plan A: No active targets.
- Plan B: No active targets.
- Details:
- No Changes Post-Report: Today’s post-report price action didn’t trigger any changes. The expectation is still for targets to begin posting in the May – June timeframe.
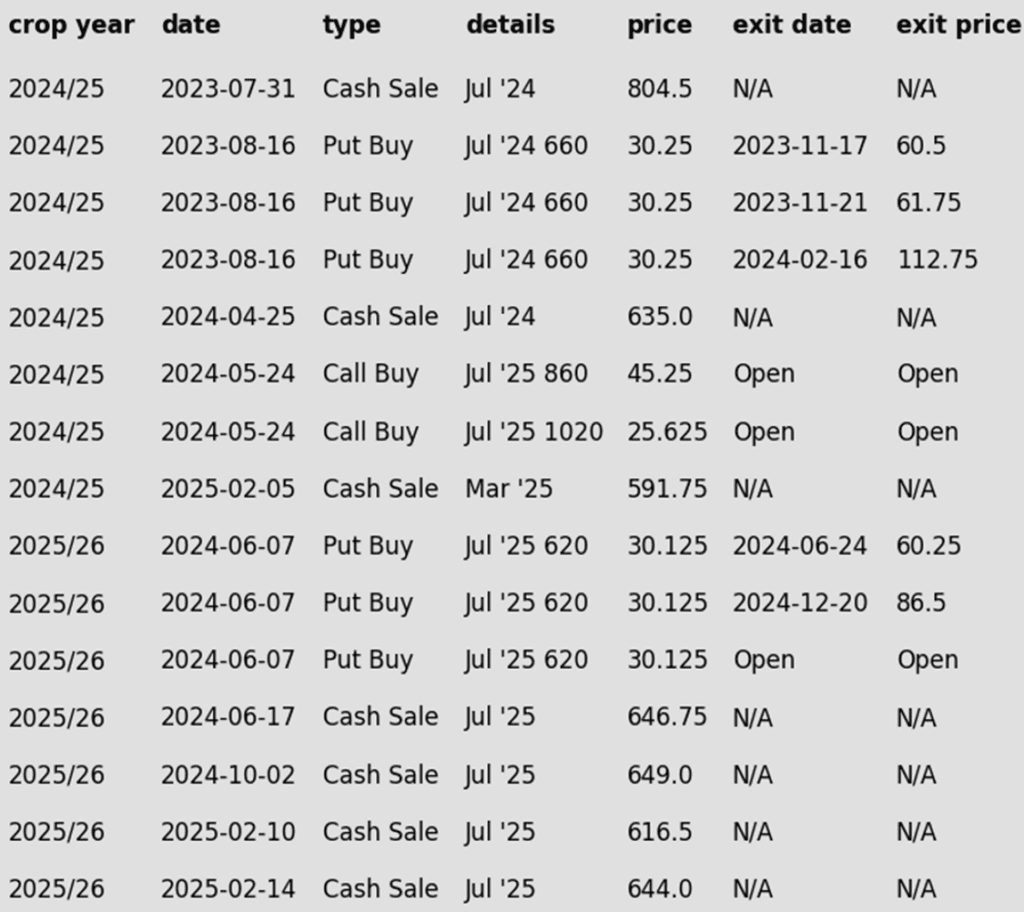
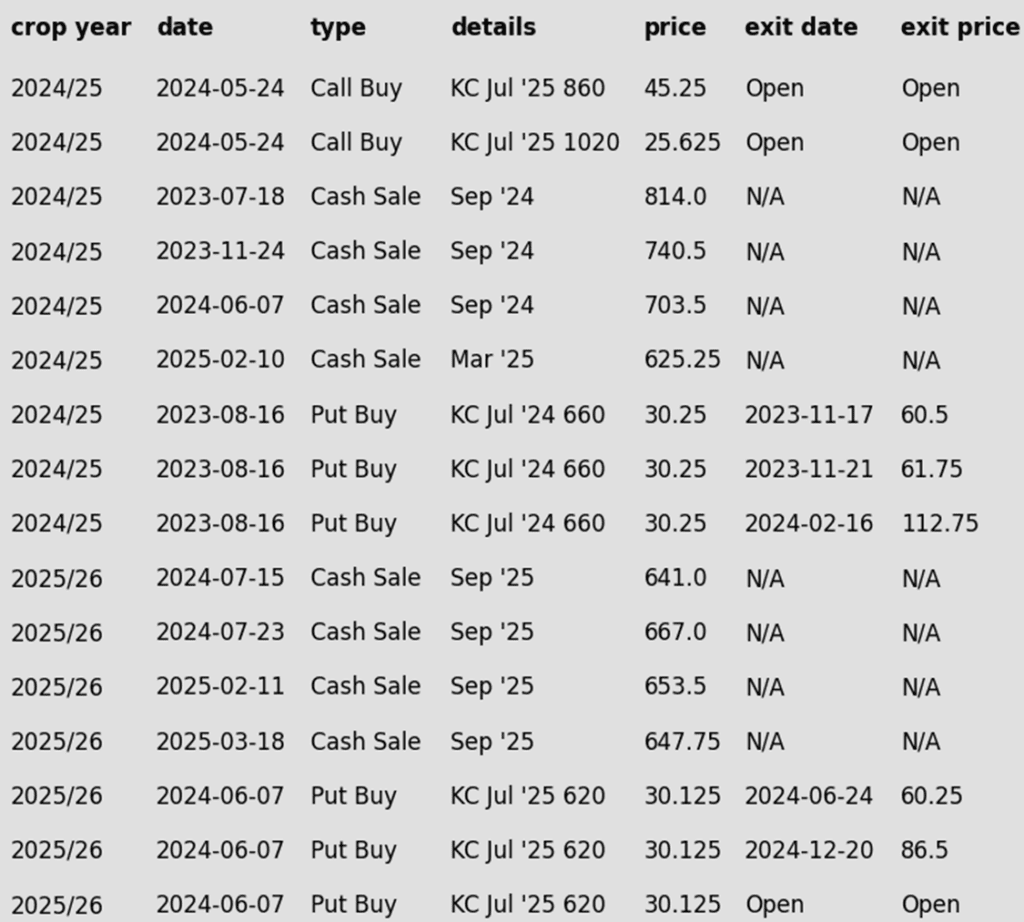
To date, Grain Market Insider has issued the following KC recommendations:
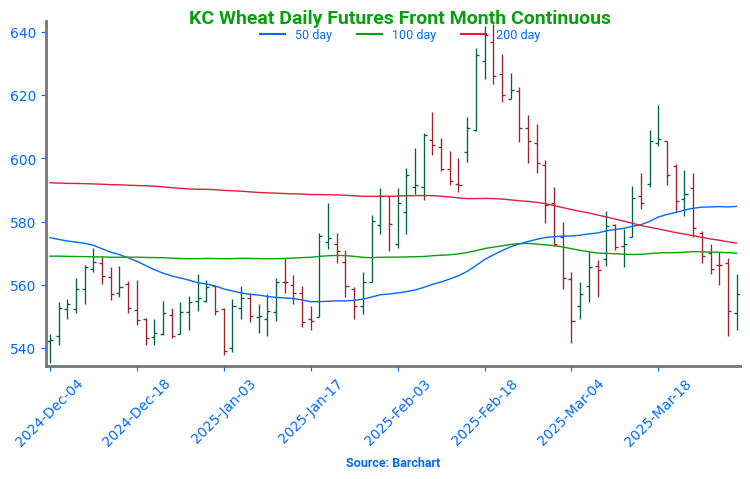
Kansas City Wheat Seeks Direction After February Whiplash
February was a wild ride for Kansas City wheat, with prices surging higher before tumbling back down, ultimately finishing the month little changed. March ended with weakness, bringing prices back near recent lows, but holding trendline support remains encouraging. On a rebound, the 200-day moving average is expected to act as initial resistance, with February highs near 640 serving as a more significant barrier.
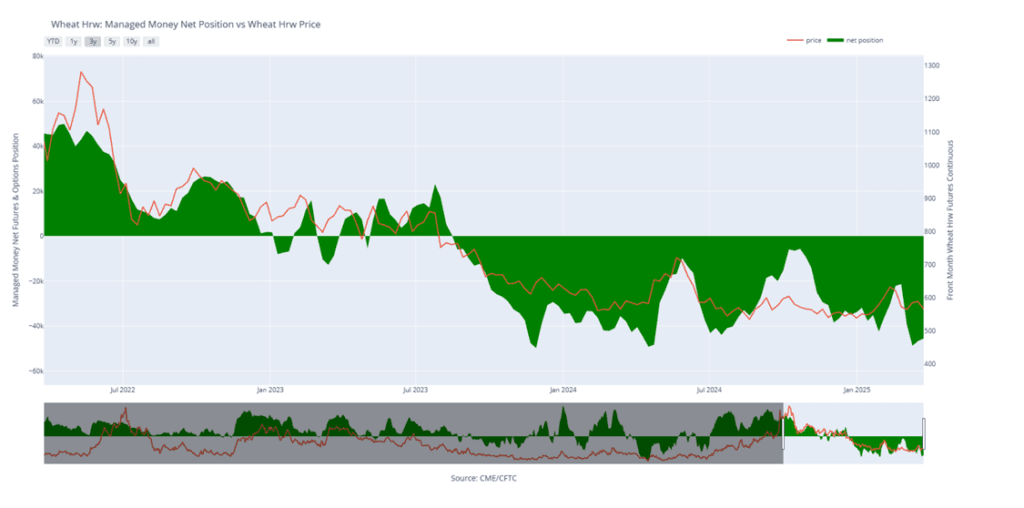
Above: KC Wheat Managed Money Funds’ net position as of Tuesday, March 25. Net position in Green versus price in Red. Money Managers net bought 1,213 contracts between March 18 – March 25, bringing their total position to a net short 45,450 contracts.
Action Plan: Mpls Wheat
Calls
2024
No New Action
2025
No New Action
2026
No New Action
Cash
2024
No New Action
2025
No New Action
2026
No New Action
Puts
2024
No New Action
2025
No New Action
2026
No New Action
2024 Crop:
- Plan A: Target 596.25 against May for the next sale.
- Plan B: No active targets.
- Details:
- New Target: Today’s post-report price action prompted an adjustment to the prior 625 price target, which has been lowered to 596.25 vs May.
2025 Crop:
- Plan A: Target 622.50 against September for the next sale.
- Plan B: No active targets.
- Details:
- New Target: Today’s post-report price action activated a new target at 622.50. There have been four sales recommendations made on the 2025 crop to date – hitting 622.50 would trigger the fifth.
2026 Crop:
- Plan A: No active targets.
- Plan B: No active targets.
- Details:
- No Changes Post-Report: Today’s post-report price action didn’t trigger any changes. The expectation is still for targets to begin posting in the June – July timeframe.
To date, Grain Market Insider has issued the following Minneapolis wheat recommendations:
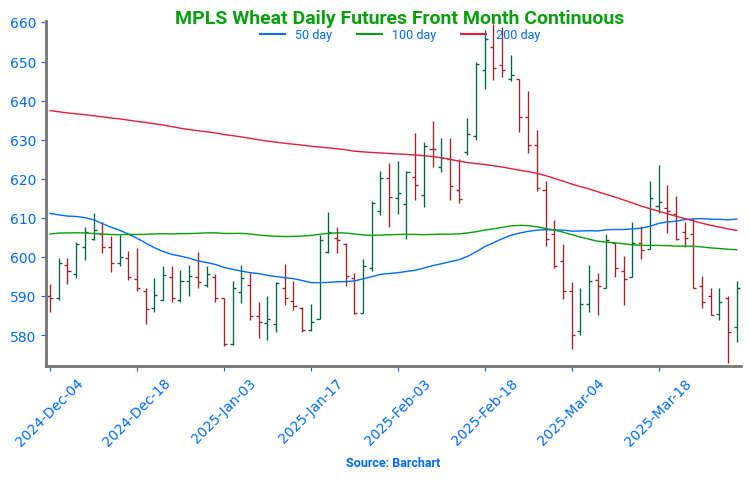
Spring Wheat Struggles to Hold Breakout Amid Volatility
Spring wheat broke out of its long-standing sideways range in late January, sparking a wave of bullish momentum. The rally gained traction in mid-February with a close above the 200-day moving average, but late-month weakness erased those gains, pulling futures back below key technical levels. Now, the 200-day moving average looms as resistance, capping any rebound attempts, while support near 580 remains critical to preventing further downside. To reignite the uptrend, futures would need a sustained move back above the 200-day, with the next upside test at February highs near 660. Until then, the market remains in search of direction amid shifting fundamentals.
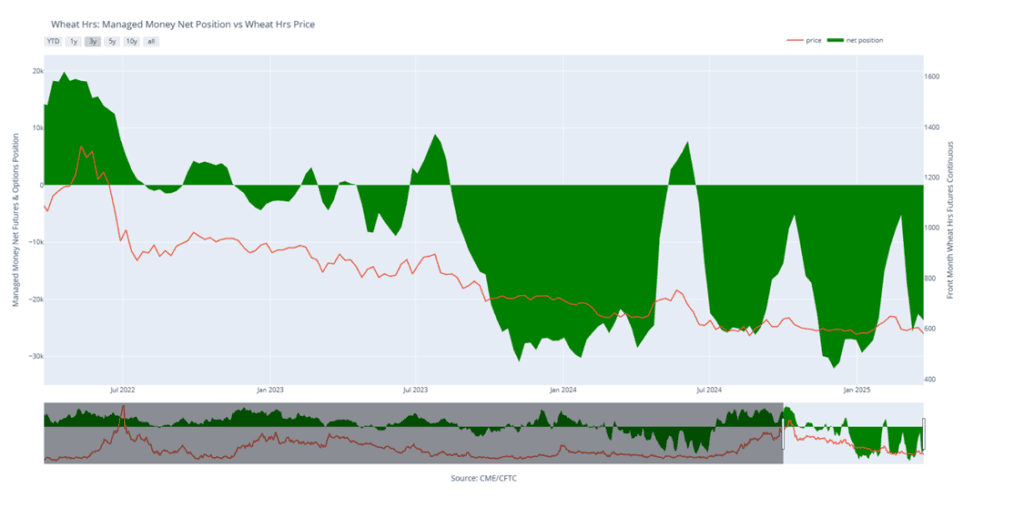
Above: Minneapolis Wheat Managed Money Funds’ net position as of Tuesday, March 25. Net position in Green versus price in Red. Money Managers net sold 1,153 contracts between March 18 – March 25, bringing their total position to a net short 23,719 contracts.
Other Charts / Weather