3-27 End of Day: Corn and Beans Continue Their Slide Ahead of Tomorrow’s USDA Report
The CME and Total Farm Marketing Offices will be Closed Friday, March 29, 2024, in Observance of Good Friday
All prices as of 2:00 pm Central Time
| Corn | ||
| MAY ’24 | 426.75 | -5.75 |
| JUL ’24 | 439.25 | -5.75 |
| DEC ’24 | 462.25 | -5.75 |
| Soybeans | ||
| MAY ’24 | 1192.5 | -6.5 |
| JUL ’24 | 1206.5 | -6 |
| NOV ’24 | 1183.5 | -7.5 |
| Chicago Wheat | ||
| MAY ’24 | 547.5 | 4 |
| JUL ’24 | 562.75 | 3.5 |
| JUL ’25 | 636 | 0.5 |
| K.C. Wheat | ||
| MAY ’24 | 578.25 | 1 |
| JUL ’24 | 574 | 0 |
| JUL ’25 | 625 | -1.25 |
| Mpls Wheat | ||
| MAY ’24 | 651 | 3.75 |
| JUL ’24 | 657.25 | 3.75 |
| SEP ’24 | 664.5 | 3 |
| S&P 500 | ||
| JUN ’24 | 5282.5 | 17.25 |
| Crude Oil | ||
| MAY ’24 | 81.44 | -0.18 |
| Gold | ||
| JUN ’24 | 2211.4 | 12.2 |
Grain Market Highlights
- After initial two-sided trading, late-day technical selling emerged, exacerbating losses, which led to the corn market’s fourth consecutive lower close. The negativity was further fueled by spillover weakness from the soybean complex and anticipation of tomorrow’s USDA report.
- May soybeans closed near the lower end of a tight 8 ½ cent range, bound by overhead trendline resistance and support just below the market where the 20 and 50-day moving averages converge around 1190. Weakness in soybean oil added pressure to soybeans and Board crush margins, which lost 3 ½ cents in the May contracts.
- A 2% drop in Malaysian palm oil and lower Chinese soybean oil pressured the bean oil market toward a 0.75 cent loss as it continues to consolidate following its recent runup. Soybean meal closed with a minor $0.80 loss as it continues to trade between its 20 and 50-day moving averages, as lower Brazilian meal export premiums remain an obstacle for US meal demand and any rally potential.
- The wheat complex closed mostly higher, led by strong performances in Chicago and Minneapolis, while Kansas City futures settled mixed, with gains in the front months outpacing the deferred ones. The complex as a whole saw steady gains throughout the day bouncing back from overnight lows. The rally came as traders likely square positions for tomorrow’s USDA Planting Intentions and Quarterly Grain Stocks report, with little other bullish news to trade.
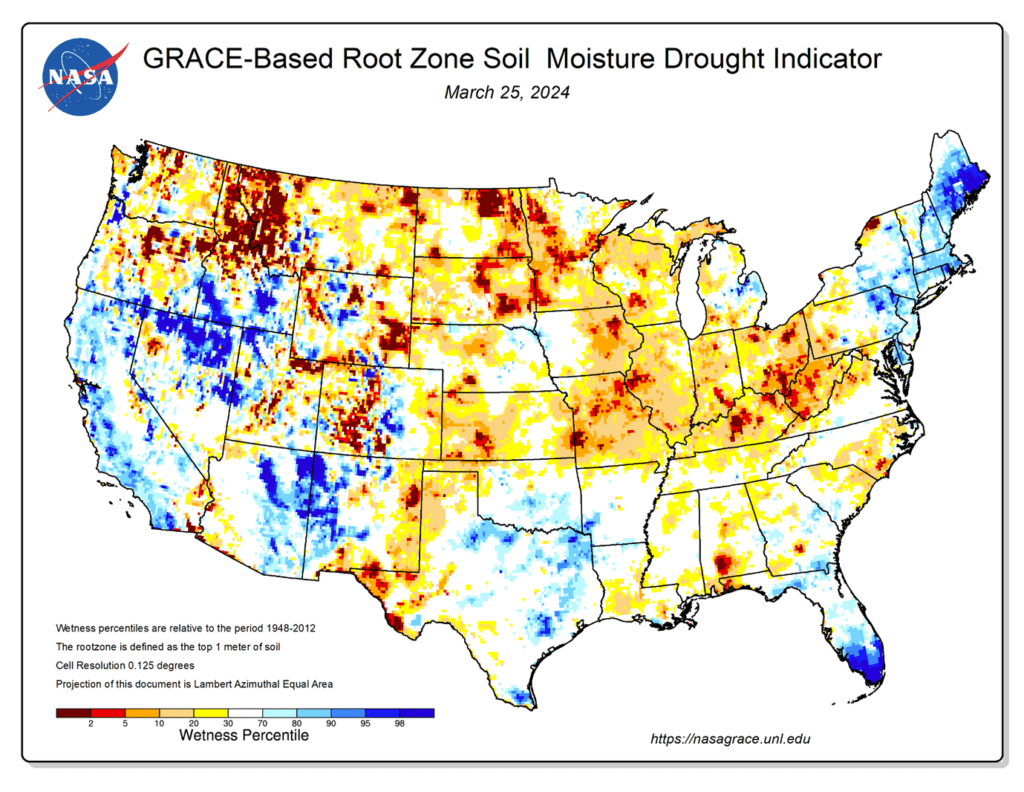
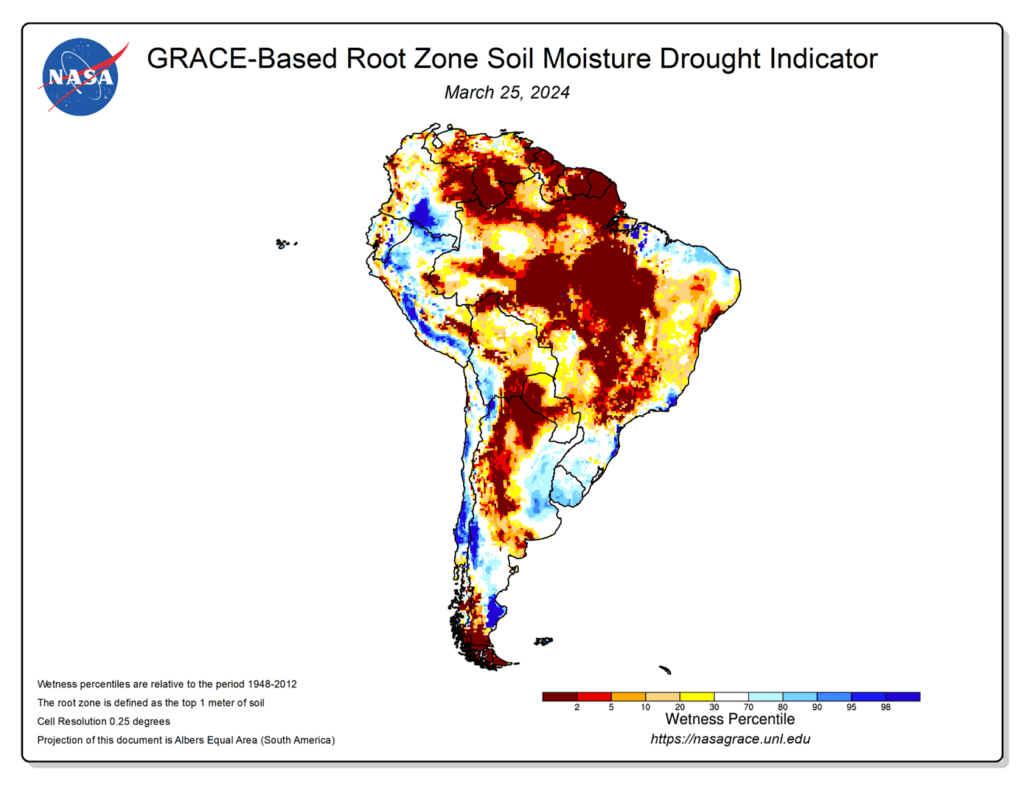
- To see the updated US 5-day precipitation forecast, GRACE-based root zone drought indicators for the US and SA, and the 1-week precipitation forecast for Brazil and N. Argentina, courtesy of the NWS, CPC, NOAA, and NASA-GRACE scroll down to the other Charts/Weather section.
Note – For the best viewing experience, some Grain Market Insider content is best viewed with your phone held horizontally.
Corn
Action Plan: Corn
Calls
2023
No New Action
2024
No New Action
2025
No New Action
Cash
2023
No New Action
2024
No New Action
2025
No New Action
Puts
2023
No New Action
2024
No New Action
2025
No New Action
Corn Action Plan Summary
From the low on February 26 to the high on March 12, May corn experienced a significant rally of nearly 40 cents. However, since then, it has consolidated within a narrow 10-cent trading range, fluctuating between 435 and 445. During this period, Managed Money has reduced its net short position by approximately 53,000 contracts, although it still holds a historically large short position of around 243,000 contracts. The size of Managed Money’s net short position, coupled with prevailing macro oversold conditions, suggests potential for further upside as we head into spring planting. While the recovery in corn prices may encounter obstacles, particularly if the March Grain Stocks and Prospective Plantings reports reveal bearish surprises, overall market conditions remain conducive to a continued price recovery into May and June.
- No new action is recommended for 2023 corn. The target range to make additional sales is 480 – 520 versus May ’24 futures. If you need to move bushels for cash or logistics reasons, consider re-owning any sold bushels with September call options.
- No new action is recommended for 2024 corn. We are targeting 520 – 560 to recommend making additional sales versus Dec ‘24 futures. For put option hedges, we are looking for 500 – 520 versus Dec ‘24 before recommending buying put options on production that cannot be forward priced prior to harvest.
- No Action is currently recommended for 2025 corn. At the beginning of the year, Dec ’25 corn futures left a gap between 502 ½ and 504 on the daily chart. Considering the tendency for markets to fill price gaps like these, we are targeting the 495 – 510 area to recommend making additional sales.
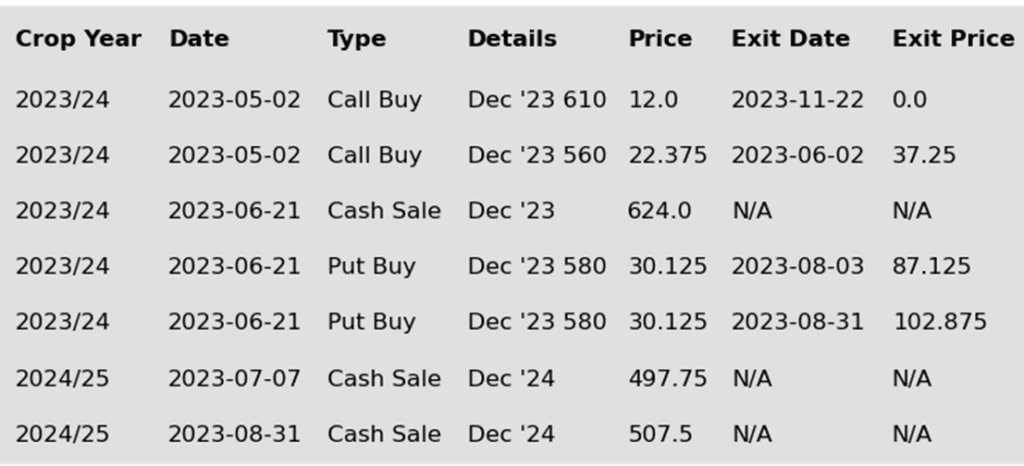
To date, Grain Market Insider has issued the following corn recommendations:
Market Notes: Corn
- The corn market saw additional long liquidation before the USDA Planting Intentions and Grain Stocks report on Thursday. May futures settled their lowest price level in three weeks.
- The correction in the corn market is tied to the market correcting from its recent over-bought technical condition as a product of the latest rally in corn.
- For Thursday’s USDA report, expectations are for 2024 corn acres to be near 91.78 million. This would be down from the 94.64 million acres planted last year. Estimated grain stocks for Thursday’s report are expected to reach 8.427 billion bushels, up 14% from last year and a 5-year high for March 1.
- The USDA will release weekly export sales on Thursday morning. Corn sales are trending ahead of pace and supporting corn prices. Expectations are for new sales to range from 800,000 – 1.3 mmt for old crop corn. Last week, export sales totaled 1.185 mmt.
- Despite the futures market weakness, cash corn basis has remained firmer as end users are “bidding up” looking for supplies in some markets.
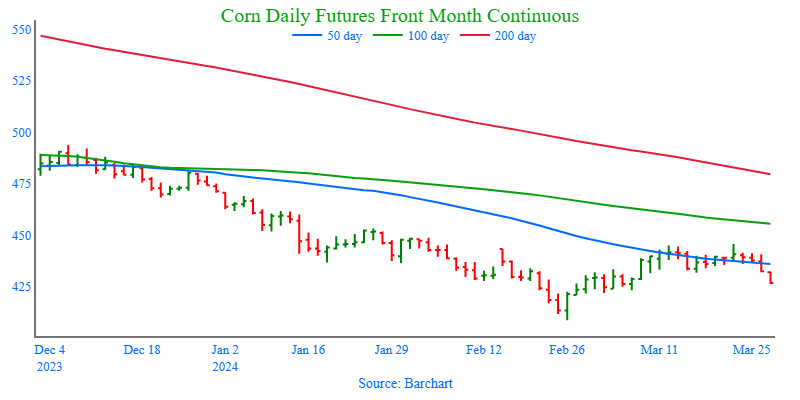
Above: Since the beginning of March, the corn market has been trading sideways, bound mostly by 445 up top and 430 down below. If prices can close above 445, they could then test the January high of 452 ¼. If they break out to the downside and close below 421, they could slide further to test 400 – 410 support.
Soybeans
Action Plan: Soybeans
Calls
2023
No New Action
2024
No New Action
2025
No New Action
Cash
2023
No New Action
2024
No New Action
2025
No New Action
Puts
2023
No New Action
2024
No New Action
2025
No New Action
Soybeans Action Plan Summary
May soybeans have rallied nearly 100 cents from the February 29 low to the March 21 high. Despite the magnitude of this current rally, the Managed Money camp has hardly covered any of their 171,999 record net short position from the week ending March 5. As of the latest week, their net short position was still at 148,339 contracts. Like corn, the continuation of this recent uptrend could rest upon what comes from the USDA in the upcoming March Grain Stocks and Prospective Plantings reports. If bearish, soybean prices could be at risk of retesting the recent lows going into April/May. However, if the reports are bullish, a squeeze could be put on Managed Money, adding more fuel to the upside price recovery.
- No new action is recommended for 2023 soybeans. We are currently targeting a rebound to the 1275 – 1325 area versus May ’24 futures to recommend making further sales. If you need to move inventory for cash or logistics reasons, consider re-owning any sold bushels with September call options.
- No new action is recommended for the 2024 crop. Considering the amount of uncertainty that lies ahead with the 2024 soybean crop, we recommended back in December buying Nov ’24 1280 and 1360 calls to give you confidence to make sales against anticipated production and to protect any sales in an extended rally. We are currently targeting the 1280 – 1320 range versus Nov ’24 futures, which is a modest retracement toward the 2022 highs, to recommend making additional sales.
- No Action is currently recommended for 2025 Soybeans. We currently aren’t considering any recommendations at this time for the 2025 crop that will be planted next year, and it may be some time before conditions are conducive to consider making any recommendations. Be patient as we monitor the markets for signs of improvement.
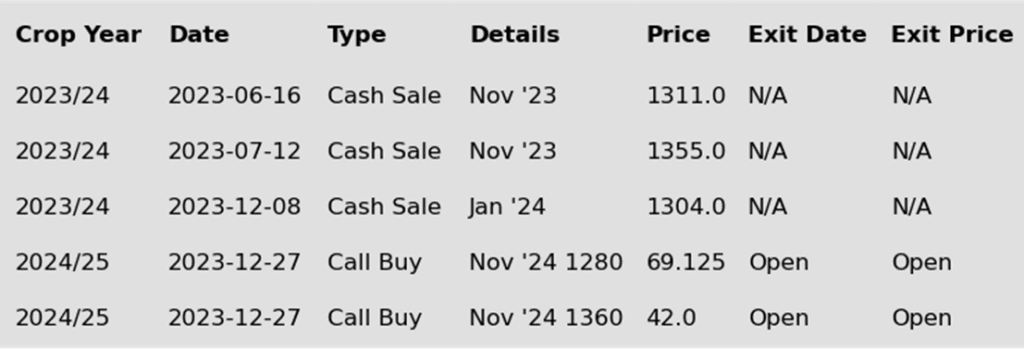
To date, Grain Market Insider has issued the following soybean recommendations:
Market Notes: Soybeans
- Soybeans finished lower for a second consecutive day, but the May contract has managed to hold above the 50-day moving average. Soybean oil lost over 2.5% and was pressured by a decline in palm oil prices while soybean meal closed only slightly lower.
- Some of the weakness in soybeans is likely due to anticipation of tomorrow’s Planting Intentions and Grain Stocks report where soybean acres are expected to increase. Soybean acres are estimated to come in at 85.35 million which would be 2 million fewer than were planted last year if realized. Soybean stocks are estimated at 1.828 billion bushels which would compare with 1.687 bb last year.
- With significant discrepancies between CONAB’s and the USDA’s estimates for Brazilian soybean production, Brazilian consultancy Agroconsult has now increased their estimates to 156.5 mmt citing an expansion of estimated planted area. This estimate is much closer to the USDA’s guess of 157 mmt and brings doubts to CONAB’s guess of 146 mmt.
- While export demand has been weak due to cheaper Brazilian soybeans, domestic demand has been firm. Cash crush margins in Illinois, have slipped around 21 cents since last week but remain profitable enough to keep processors purchasing cash beans.
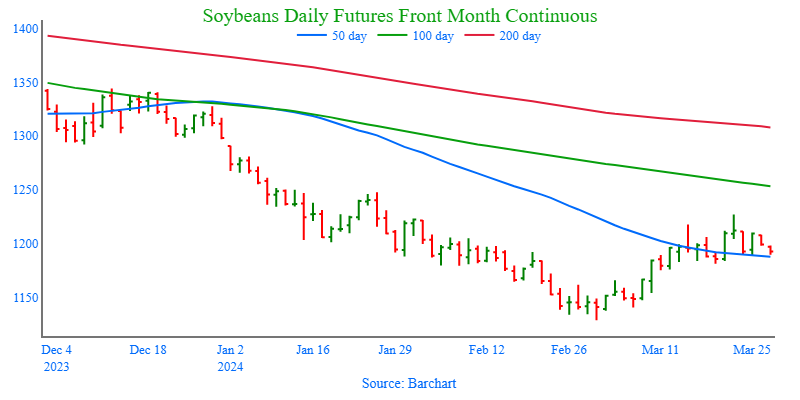
Above: Although May soybeans rejected a rally through the March 14 high of 1217 ½, they could still test the January high of 1247 ½ if downside support near 1175 continues to hold and if prices close above 1226 ¾. If not, the market runs the risk of retreating down toward the 1130 – 1140 support area.
Wheat
Market Notes: Wheat
- Wheat prices closed mostly higher, particularly in Chicago and Minneapolis futures, although Kansas City futures settled mixed. These gains occurred in the absence of significant bullish news and despite pressure from the US Dollar Index, which remained near its recent high above the 104 level. Paris milling wheat also closed mixed, with the May contract marking its third consecutive session lower, while September and December futures experienced slight gains.
- The average pre-report estimate for all wheat acreage on tomorrow’s USDA report stands at 47.7 million acres, marking a decline from last year’s 49.6 million acres. Additionally, quarterly grain stocks are expected to reach 1.053 billion bushels compared to 941 million bushels a year ago. Despite the projected decrease in acreage compared to last year, it remains possible that trendline yields and weak demand could still result in a higher carryout number for the 24/25 season.
- March wheat exports out of Russia could hit a record 5 mmt. While their FOB export values have increased to $206/mt, they remain well below the $225/mt US SRW wheat values, and may limit upside movement for US wheat.
- As of March 23, the European Commission reported that EU soft wheat exports for the season, which began on July 1, amounted to 22.8 million metric tons (mmt). This reflects a 2% decrease compared to the previous year’s figure of 23.2 mmt. Leading the list of importers was Morocco, with 3.32 mmt, followed by Nigeria and Algeria.
Action Plan: Chicago Wheat
Calls
2023
No New Action
2024
No New Action
2025
No New Action
Cash
2023
No New Action
2024
No New Action
2025
Active
Sell JUL ’25 Cash
Puts
2023
No New Action
2024
No New Action
2025
No New Action
Chicago Wheat Action Plan Summary
Since the early December runup, Chicago wheat has suffered in a lower trend while going on to make new contract lows. Although the lack of any bullish information has been disappointing, the market is in a significantly oversold condition, and managed funds continue to hold a significant net short position. Either or both could fuel a short covering rally at any time as we head into the more active part of the growing season.
- No new action is currently recommended for 2023 Chicago wheat. Any remaining 2023 soft red winter wheat should be getting priced into market strength. Grain Market Insider won’t have any “New Alerts” for 2023 Chicago wheat – either Cash, Calls, or Puts, as we have moved focus onto 2024 and 2025 Crop Year Opportunities.
- No new action is recommended for 2024 Chicago wheat. At the end of August, we recommended purchasing July ‘24 590 puts to prepare for further price erosion, and recently recommended exiting half of those puts to lock in gains and get closer to a net neutral cost on the remaining position. For now, we are targeting a market rebound back towards 675 – 715 versus May ’24 futures before recommending any additional sales. As for the open 590 put position, we are looking for prices between 475 – 500 versus July ’24 futures to before we recommend exiting half of the remaining July ’24 590 puts.
- Grain Market Insider sees a continued opportunity to sell a portion of your 2025 SRW wheat crop. In mid-February, the July ’25 Chicago wheat contract broke through the bottom of the long standing 640 – 685 trading range and traded down to the 597 ½low. Prices have rallied 50% back toward the high of that range. While a lot of time remains in which many unforeseen circumstances can unfold to move prices even higher, Grain Market Insider recommends taking advantage of this rally, and these historically good prices, to make an early sale and begin marketing your 2025 SRW crop.
To date, Grain Market Insider has issued the following Chicago wheat recommendations:
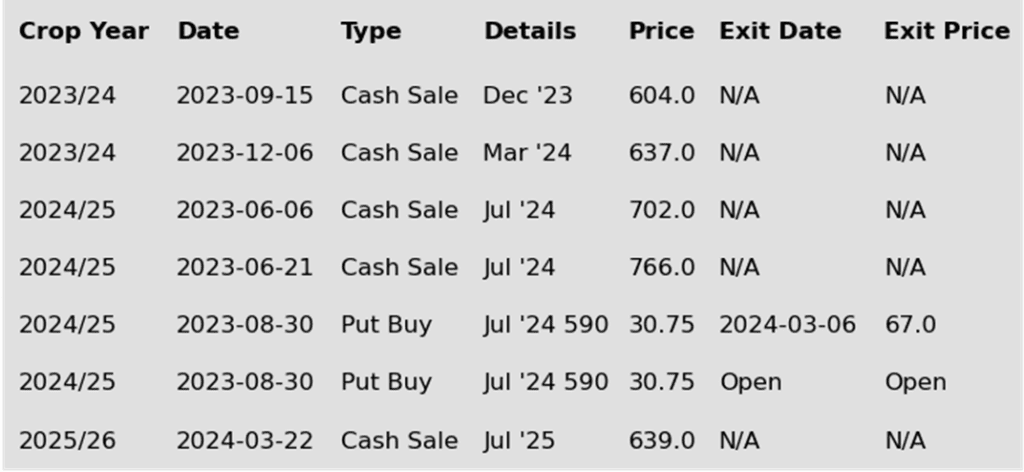
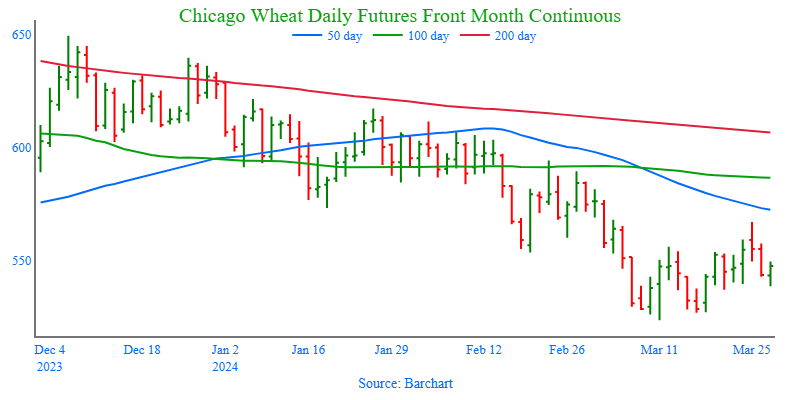
Above: Chicago wheat posted a bearish reversal on March 25, indicating there is significant resistance above the market near the 50-day moving average. Prices could still challenge the 50 and 100-day moving averages, and the 585 – 620 congestion area if they rebound and close above 567. Otherwise, if they retreat and close below 523 ½, they run the risk of trading down toward the next major support level near 488.
Action Plan: KC Wheat
Calls
2023
No New Action
2024
No New Action
2025
No New Action
Cash
2023
No New Action
2024
No New Action
2025
No New Action
Puts
2023
No New Action
2024
No New Action
2025
No New Action
KC Wheat Action Plan Summary
Since December’s brief runup, prices have continued to erode as US exports continue to suffer from lower world export prices. Although fundamentals remain weak. Managed funds continue to hold a considerable net short position, and the market is at levels not seen since spring of 2021, which combined could trigger a return to higher prices if any unforeseen risks enter the market.
- No new action is recommended for 2023 KC wheat crop. As weather becomes a more dominant market mover, we are targeting 670 – 700 versus May ’24 futures to recommend making additional sales. This area represents a modest 20% retracement back toward the 2022 highs.
- No new action is recommended for 2024 KC wheat. Back in August, Grain Market Insider recommended buying July ’24 KC wheat 660 puts to protect the downside, and recommended exiting the original position in three separate tranches as the market got further extended into oversold territory to protect any gains that were made. The current strategy is to target 625 – 650 versus July ’24 futures to recommend additional sales.
- No action is currently recommended for 2025 KC Wheat. We currently aren’t considering any recommendations at this time for the 2025 crop that will be planted next fall. It may be late spring or summer before Grain Market Insider starts considering the first sales targets.
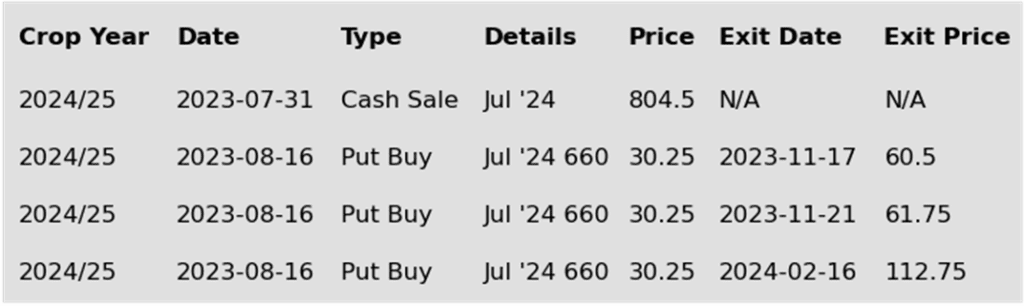
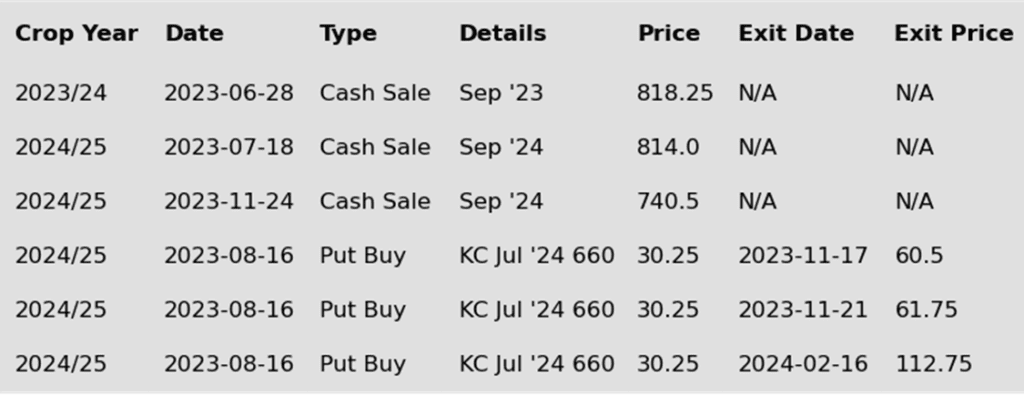
To date, Grain Market Insider has issued the following KC recommendations:
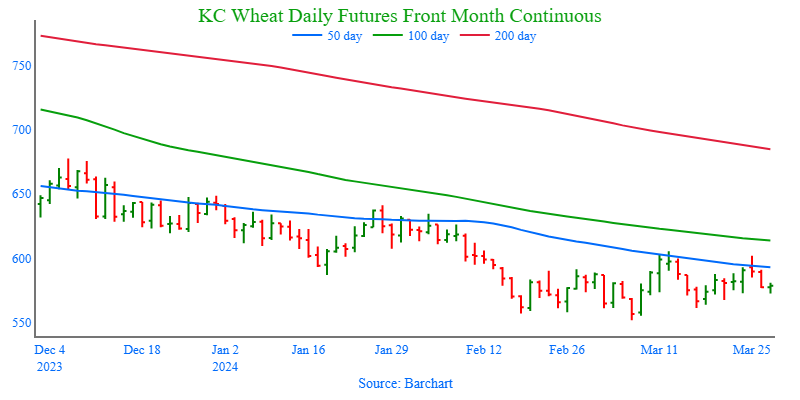
Above: The inability of the market to close above the 50-day moving average (dma) suggests considerable resistance in this area, potentially leading to a test of support near the 551 ½ low if initial support near 575 is broken. With substantial support near 551 ½, a breach below this level could lead to a test of 530. However, if prices do manage to close above the 50 dma and the March 10 high of 605 ¼, prices could continue towards the congestion range between 610 and 640.
Action Plan: Mpls Wheat
Calls
2023
No New Action
2024
No New Action
2025
No New Action
Cash
2023
No New Action
2024
No New Action
2025
No New Action
Puts
2023
No New Action
2024
No New Action
2025
No New Action
Mpls Wheat Action Plan Summary
Since last summer, Minneapolis wheat has slowly stair-stepped lower with weaker world prices and little bullish news to move markets higher. During this time, the 50-day moving average has acted as resistance, above which the market has not been able to hold for very long. Managed funds have also established and maintained a record (or near record) short position for much of the same time. Although bullish headwinds remain, the market has become very oversold, and the large fund net short position continues to leave the market susceptible to a short-covering rally at any time.
- No new action is currently recommended for 2023 Minneapolis wheat. The current strategy is to look for a modest retracement of the July high and target 675 – 700 to recommend more sales.
- No new action is recommended for 2024 Minneapolis wheat. Back in August, Grain Market Insider recommended buying July ’24 KC wheat 660 puts (due to their higher liquidity and correlation to Minneapolis), to protect the downside, and recommended exiting the original position in three separate tranches as the market got further extended into oversold territory to protect any gains that were made. The current strategy is targeting the 775 – 815 area versus Sept ’24 to recommend making additional sales. We are also targeting the 850 – 900 area to recommend buying upside calls to help protect any sales that would have been made.
- No action is currently recommended for the 2025 Minneapolis wheat crop. We are currently not considering any recommendations at this time for the 2025 crop that will be planted in the spring of next year. It may be late spring or summer before Grain Market Insider starts considering the first sales targets.
To date, Grain Market Insider has issued the following Minneapolis wheat recommendations:
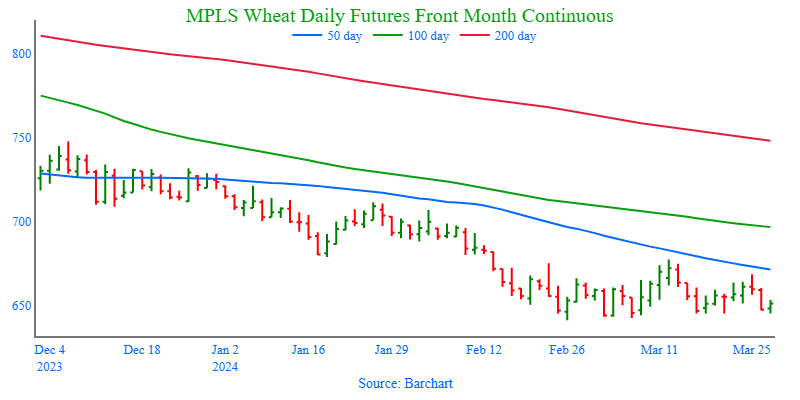
Above: Minneapolis wheat continues to trade sideways with overhead resistance near the 50-day moving average. Initial support remains below the market near the 641 low with more support near 600 if prices fall further. Up top, if the market reverses and closes above the 50-day moving average and 675 – 680 resistance, it could challenge the 700 – 710 area.
Other Charts / Weather
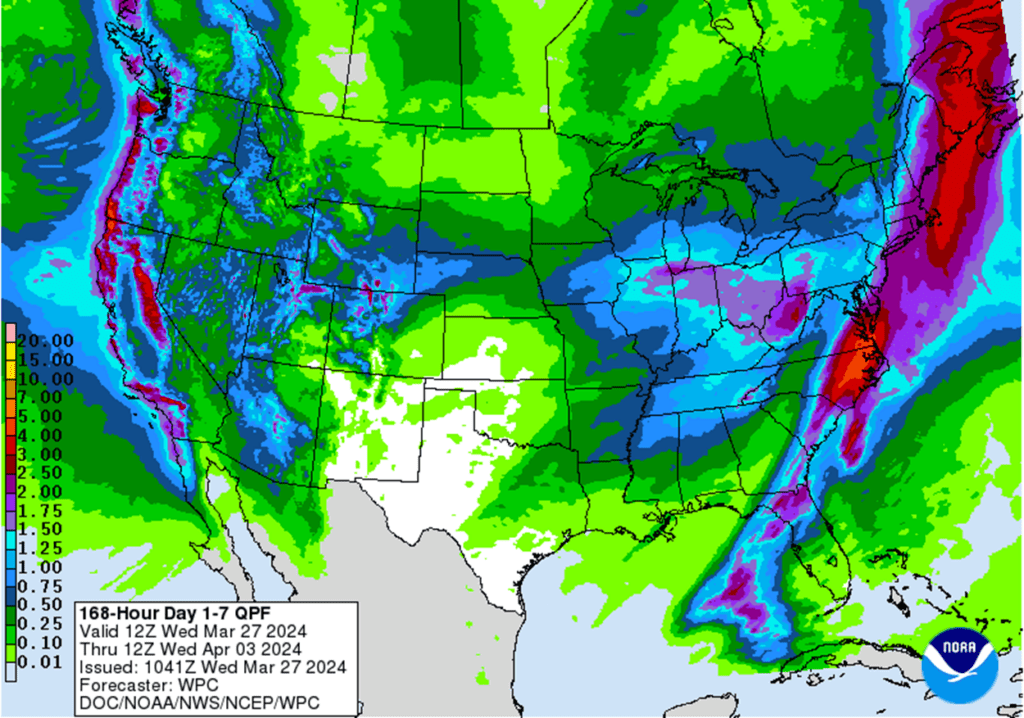
Above: US 7-day precipitation forecast courtesy of NOAA, Weather Prediction Center
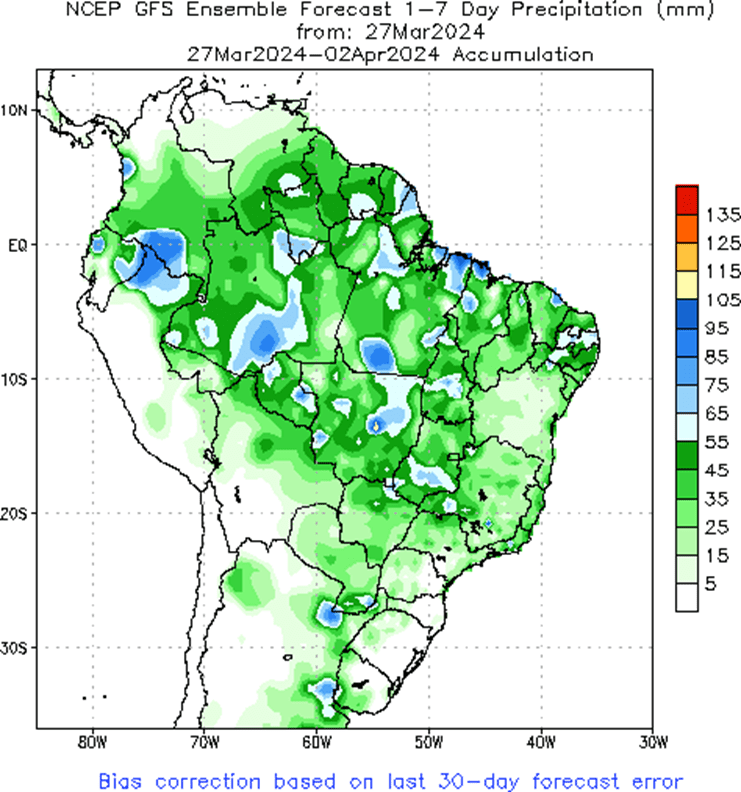
Above: Brazil and N. Argentina 1-week forecast precipitation, courtesy of the National Weather Service, Climate Prediction Center
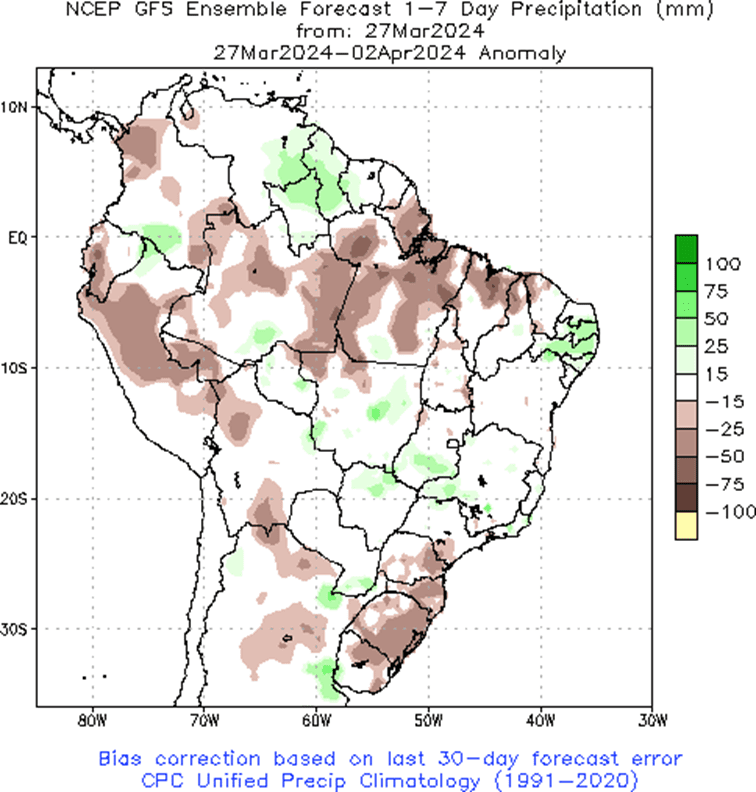
Above: Brazil and N. Argentina 1-week forecast precipitation, percent of normal, courtesy of the National Weather Service, Climate Prediction Center