12-23 Opening Update: Grains Trading Higher Again Ahead of Christmas Holiday


- Corn futures are trading higher and have broken above the 200-day moving average. March corn is up 1-1/4 cent to $4.48-1/4 while May is up 1-1/2 cents to $4.56. Good export sales have been supportive.
- Yesterday’s export inspections was very solid for corn at 1,744k tons which was up 8.7% from last week’s 1,605k and up from 1,147k a year ago at this time. Top destinations were to Mexico, Taiwan, and Colombia.
- Brazilian corn production estimates have fallen to 142.88 mmt for 25/26 according to Safras. This is a drop from 143.56 mmt previously and is due to lower yield expectations.
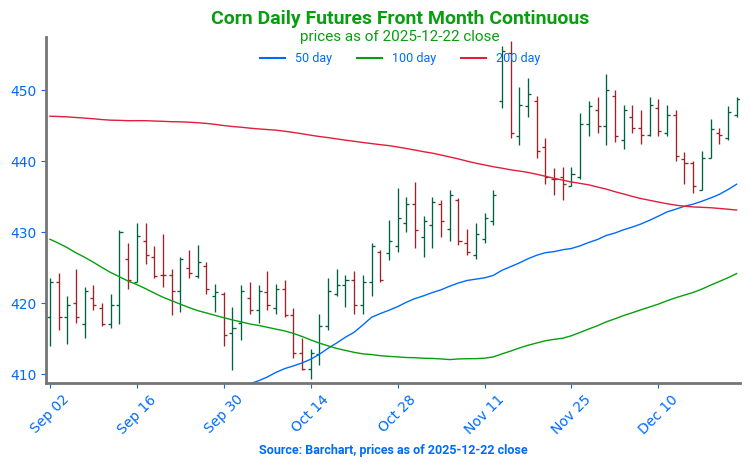
Corn Futures Find Support: Corn futures retested technical support at the 200-day moving average following contract rollover. This support level held, and prices have rallied a small amount since. Support continues to be offered at the 200-day moving average, near 433. Structural resistance can be found near 465.

- Soybean futures are higher again today with strength from Chinese purchases. January soybeans are up 1-1/2 cents to $10.54-3/4 while March is up 2 cents to $10.67. January soybean meal is leading the way higher up $1.40 to $300.00 while bean oil is down 0.07 cents to 48.48 cents.
- Yesterday’s export inspections saw soybean inspections at 870k tons which was up from 810k tons a week ago but down from 1,775k at this time a year ago. Top buyers were China, Egypt, and Taiwan.
- Bloomberg reports China has purchased about 6 mmt of soybeans, roughly half of its 12 mmt commitment. They bought another 134,000 mt on Friday. While meeting the full target by year-end appears unlikely, the current pace suggests the commitment could be completed by the end of the marketing year, or sooner.
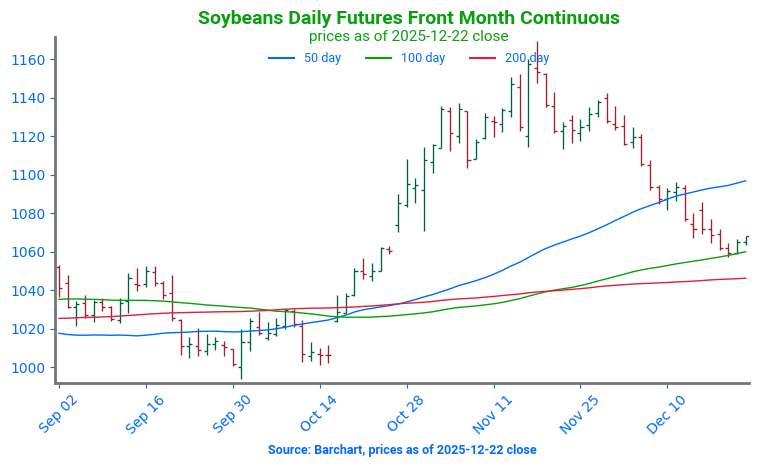
Soybeans Break Lower, Test Support: Soybean futures broke below key psychological support at 1100 and technical support by breaking below the 50-day moving average. The next point of support can be found at the 100-day moving average, near 1056. The 50-day moving average will now serve as technical resistance, near 1092.

- Wheat is mixed to start the day with March Chicago wheat down 1/4 cent to $5.15-1/4, KC up 3/4 cent to $5.22, and Minn wheat down 1/2 cent to $5.79-1/2. Traders are likely watching the escalation in the Black Sea carefully.
- Yesterday’s export inspection report saw wheat inspections at 627k tons which was up from 489k last week and up from 427k tons a year ago. Top buyers were Japan, Mexico, and South Korea.
- Over the weekend, both Russia and Ukraine bombed each others ports in the Black Sea which has brought up fresh concerns over crop exports. Last night, Russia bombed power grids in Ukraine and civilians were killed.
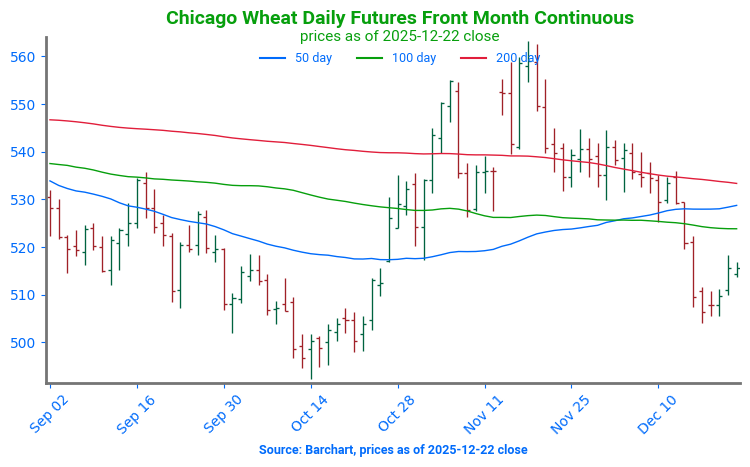
Chicago Wheat Break Lower: Wheat futures broke below a band of moving averages after spending significant time testing support at the 200-day moving average. The first point of technical support can be found at the October 14 low, near 492. Technical resistance can now be found at the 100-day moving average, near 524.
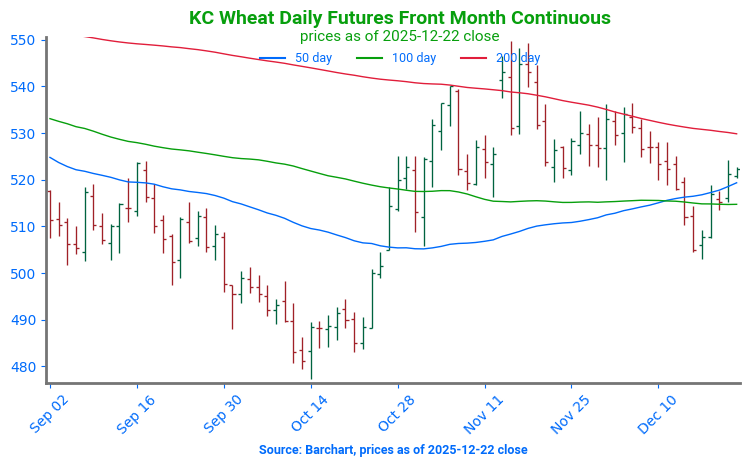
KC Wheat Consolidates: KC Wheat Breaks Support: KC wheat broke below technical support, offered by a band of moving averages, following the recent consolidation phase. The first point of technical support can be found at the October 14 low, near 477. Technical resistance can now be found at the band of moving averages, near 514.
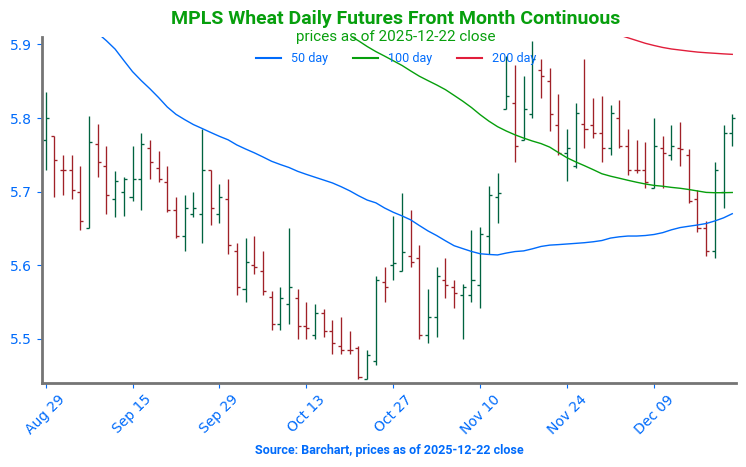
Spring Wheat Slips Lower: Spring wheat futures broke below the 50 and 100 day moving averages following the recent consolidation phase. Technical support can be found near 550. The 50-day moving average now serves as technical resistance, near 565.
Grain Market Insider is provided by Stewart-Peterson Inc., a publishing company.
Futures and options trading involve significant risk of loss and may not be suitable for everyone. Therefore, carefully consider whether such trading is suitable for you in light of your financial condition. The data contained herein is believed to be drawn from reliable sources but cannot be guaranteed. This material has been prepared by a sales or trading employee or agent of Total Farm Marketing by Stewart-Peterson and is, or is in the nature of, a solicitation. Any decisions you may make to buy, sell or hold a futures or options position on such research are entirely your own and not in any way deemed to be endorsed by or attributed to Stewart-Peterson Inc. Reproduction of this information without prior written permission is prohibited. Hypothetical performance results have many inherent limitations. No representation is being made that any account will or is likely to achieve profits or losses similar to those shown. The data contained herein is believed to be drawn from reliable sources but cannot be guaranteed. Reproduction and distribution of this information without prior written permission is prohibited. This material has been prepared by a sales or trading employee or agent of Total Farm Marketing and is, or is in the nature of, a solicitation. Any decisions you may make to buy, sell or hold a position on such research are entirely your own and not in any way deemed to be endorsed by or attributed to Total Farm Marketing.
Stewart-Peterson Inc., Stewart-Peterson Group Inc., and SP Risk Services LLC are each part of the family of companies within Total Farm Marketing (TFM). Stewart-Peterson Inc. is a publishing company. Stewart-Peterson Group Inc. is registered with the Commodity Futures Trading Commission (CFTC) as an introducing broker and is a member of National Futures Association. SP Risk Services LLC is an insurance agency. A customer may have relationships with any or all three companies.