10-29 Opening Update: Grains Slide as Profit Taking and Farmer Selling Pressure Markets


- Corn futures are trading slightly lower this morning after failing to break through technical resistance during yesterday’s session. December futures are down 3/4 cent to 431-1/4. March futures are 1-1/2 cents lower to 444-1/2.
- The U.S. and Japan finalized and signed a trade agreement on Tuesday. Over the past five years, Japan has imported an average of $14.3 billion in U.S. agricultural products, with corn accounting for roughly 18% of that total.
- December corn futures have gained 17 cents since October 14. Producer selling will likely continue to pressure any additional rallies.
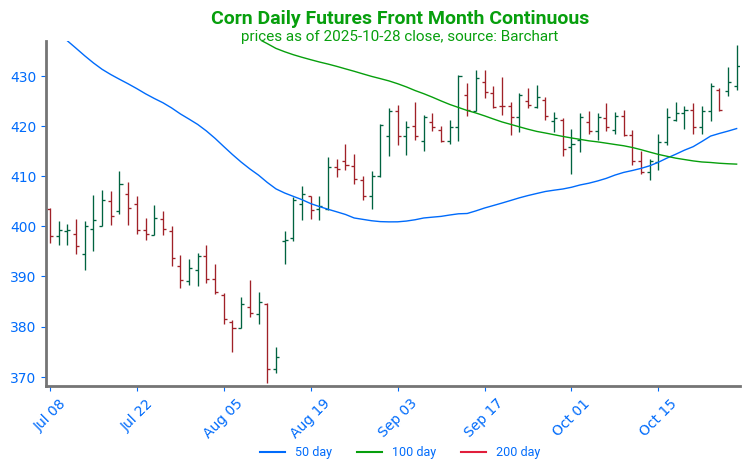
Corn Futures Test Resistance: Corn futures rebounded from the 410 level, a key area of structural support. Prices have since broken through resistance at the upper end of their short-term trading range near 424. However, prices were unable to break structural resistance near 430. The 430 level continues to serve as an area of strong technical resistance.

- Soybean futures have slipped lower following their impressive rally since Monday. November futures are down 6 cents to 1072-1/4. January futures are down 6-1/4 cents to 1089.
- President Trump and Chinese President Xi are scheduled to meet this Thursday to discuss a potential trade deal. Treasury Secretary Bessent indicated that China is expected to resume ‘substantial’ purchases of U.S. soybeans, with the planned 100% tariff for November 1 reportedly withdrawn.
- According to StoneX analyst Arlan Suderman, China may need between 5 and 10 million metric tons of soybeans to cover a supply gap before new-crop Brazilian beans become available early next year.
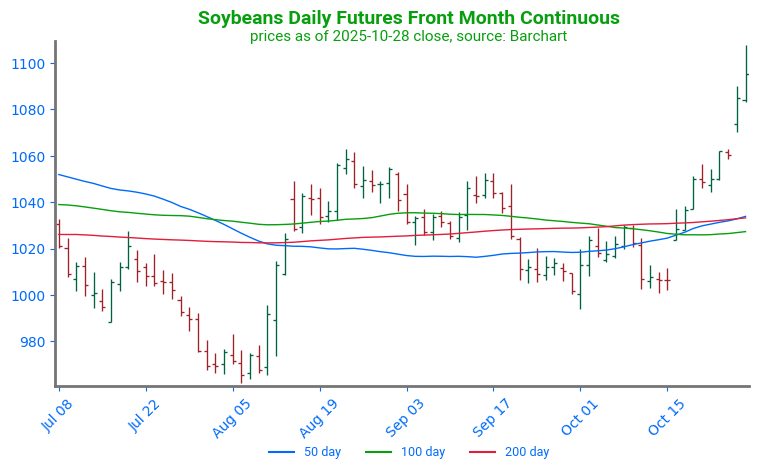
Soybeans Break Higher: Soybean futures have continued to move higher as the market takes an optimistic stance regarding trade tensions with China. Soybean prices gapped higher and closed near the upper end of their trading range from the past year. Strong psychological resistance should be expected as they approach 1100, with support at the gap, near 1063.

- Wheat has followed corn and soybeans lower this morning. December Chicago wheat is down 1-1/2 cents to 527-1/2, KC is down 3/4 cent to 519-1/4, and Minn is down 1 cent to 561.
- Speculative traders were estimated to have purchased around 5,500 Chicago wheat contracts Monday, reducing their net short position to below 90,000 contracts. Open interest fell by roughly 6,000 contracts, indicating potential short covering.
- Argentina and Australia will soon be harvesting record wheat crops. The Argentina crop is estimated near 23 mmt compared to the USDA estimate of 19.5. The Australian crop is estimated at 38 mmt compared to USDA’s estimate of 34.5.
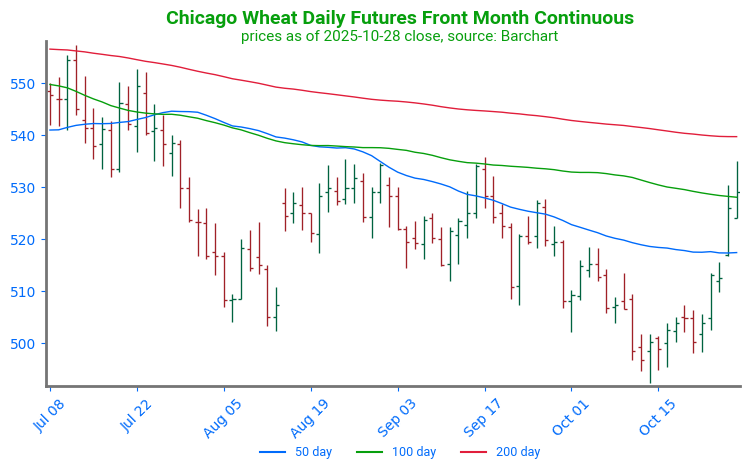
Chicago Wheat Breaks Higher: Wheat futures broke through key technical resistance at the 50-day moving average in a strong fashion. Prices tested resistance at the 100-day moving average, but were unable to close above it. Support lies below at the 50-day moving average, near 517. The 100-day moving average continues to serve as resistance, near 528.
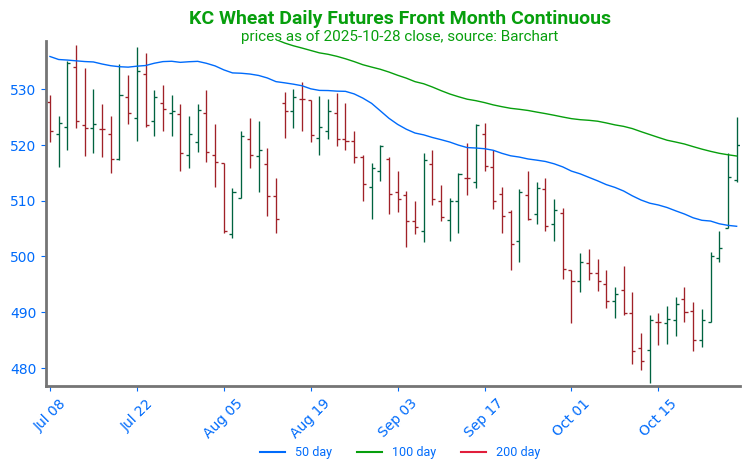
KC Wheat Continues Higher, Approaches Resistance: KC wheat has trended higher following a strong daily reversal on October 14. Prices have since managed to break through technical resistance at the 50-day moving average but were unsuccessful at breaking through the 100-day. The 50-day moving average will now serve as technical support, near 505. The 100-day moving average serves as technical resistance, near 518.
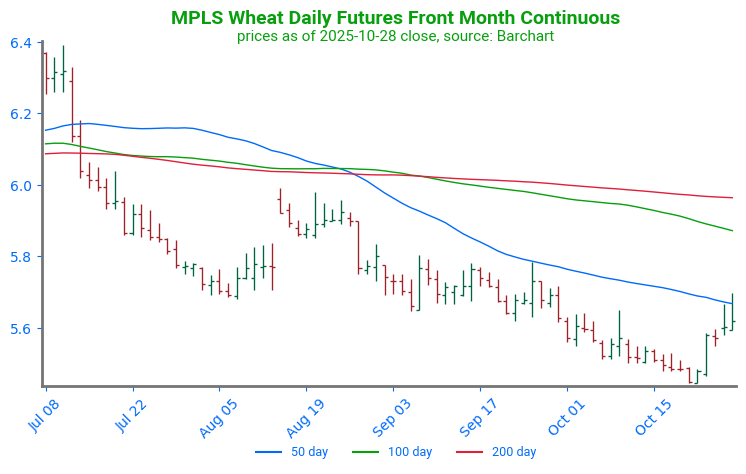
Spring Wheat Builds Momentum, Tests Resistance: Spring wheat futures found support near 545 and reversed higher with enough momentum to begin retesting resistance at the 50-day moving average, near 567. A second point of resistance can be found at the 100-day moving average, near 587. Support lies below at 545.
Grain Market Insider is provided by Stewart-Peterson Inc., a publishing company.
Futures and options trading involve significant risk of loss and may not be suitable for everyone. Therefore, carefully consider whether such trading is suitable for you in light of your financial condition. The data contained herein is believed to be drawn from reliable sources but cannot be guaranteed. This material has been prepared by a sales or trading employee or agent of Total Farm Marketing by Stewart-Peterson and is, or is in the nature of, a solicitation. Any decisions you may make to buy, sell or hold a futures or options position on such research are entirely your own and not in any way deemed to be endorsed by or attributed to Stewart-Peterson Inc. Reproduction of this information without prior written permission is prohibited. Hypothetical performance results have many inherent limitations. No representation is being made that any account will or is likely to achieve profits or losses similar to those shown. The data contained herein is believed to be drawn from reliable sources but cannot be guaranteed. Reproduction and distribution of this information without prior written permission is prohibited. This material has been prepared by a sales or trading employee or agent of Total Farm Marketing and is, or is in the nature of, a solicitation. Any decisions you may make to buy, sell or hold a position on such research are entirely your own and not in any way deemed to be endorsed by or attributed to Total Farm Marketing.
Stewart-Peterson Inc., Stewart-Peterson Group Inc., and SP Risk Services LLC are each part of the family of companies within Total Farm Marketing (TFM). Stewart-Peterson Inc. is a publishing company. Stewart-Peterson Group Inc. is registered with the Commodity Futures Trading Commission (CFTC) as an introducing broker and is a member of National Futures Association. SP Risk Services LLC is an insurance agency. A customer may have relationships with any or all three companies.