10-14 Opening Update: Grain Markets All Lower


- Corn futures are trading unchanged to slightly lower this morning. December corn futures are down 1/4 cent to 410-1/2 and March futures are down 3/4 cent to 426-1/2.
- Dalian corn futures hit new contract lows, pressured by expanding U.S. harvest and expectations that the final 30% of the U.S. harvest could strain storage and weigh on futures and basis.
- The absence of key U.S. reports (October WASDE, export sales, CFTC) added to bearish sentiment; Brazil corn futures also declined on a stronger real. Trade estimates U.S. corn harvest at ~44% complete, with yields slightly below USDA’s 186.7 bpa; weaker feed demand could boost carryout toward 2.464 billion bu.
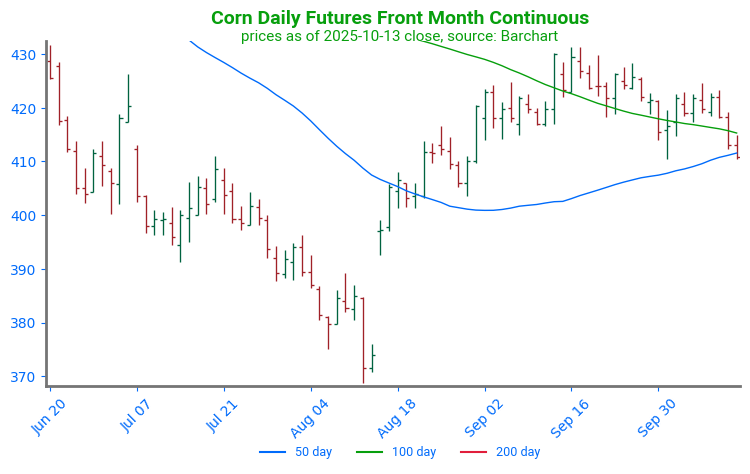
Corn Futures Seek Support: Corn futures have trended sideways to lower over the past month, pressured by harvest selling and the bearish September Grain Stocks report. The market is currently probing lower in search of strong technical support.

- Soybean futures are lower this morning with November futures down 4-1/4 cents to 1003-1/2 and January futures down 4-1/4 cents to 1021.
- The Nov/Jan spread widened to -18 as Dalian soy complex futures fell, pressured by lower crude oil and a lack of key U.S. reports, adding to bearish sentiment.
- China’s new tariffs on U.S.-operated vessels increase the cost of U.S. soybeans, while U.S. harvest progress is estimated near 60% and some expect final yields below USDA’s 53.0 bpa. Trade sees potential for U.S. soybean exports to fall 435 million bu short of USDA’s 1.685 billion bu estimate.
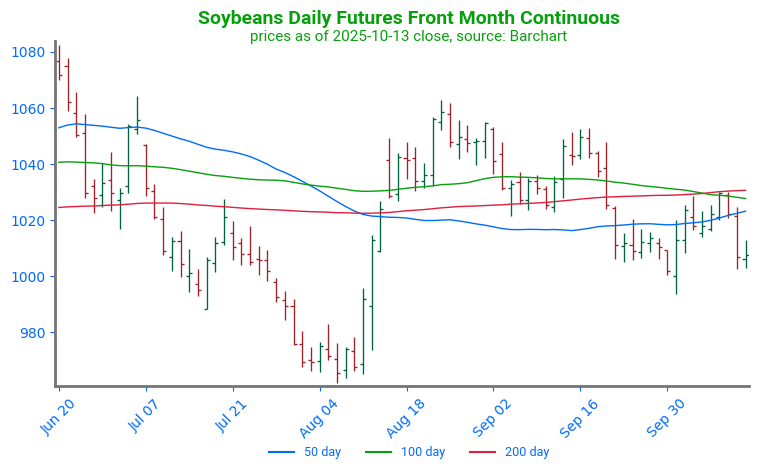
Soybean Fail to Break Resistance: Soybean futures have pressed lower following concerns of worsening trade relations between the U.S. and China. Following this news, soybean futures fell away from a zone of strong technical resistance. The first point of technical support lies at the psychological level of 1000, with a secondary point of trend support near 974.

- Wheat futures are all lower this morning. December Chicago wheat futures are down 3-3/4 cents to 493. December KC wheat is down 3-1/2 cents to 477-3/4, and December MPLS wheat is down 1-1/4 to 5.5025.
- The absence of the USDA October WASDE, export sales, and CFTC reports is bearish, with some expecting the missing data would have included upward revisions to Argentina, Russia, and Canada crops.
- Russia’s 2026 wheat acres are expected to be down 6%, and its current export pace is lagging USDA’s 45.0 mmt estimate, implying an active Oct-Jan export window is needed to meet the goal. Trade estimates U.S. winter wheat plantings at 66% complete.
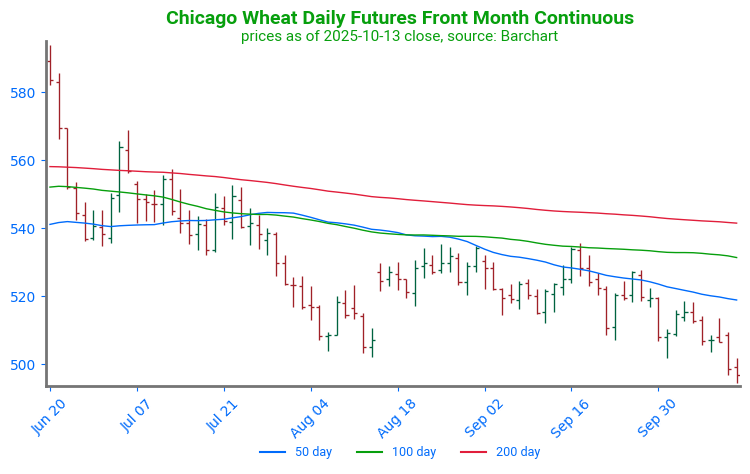
Chicago Wheat Breaks Below Support: Wheat futures have fallen below the technical support level of 502 driven by the strength in the U.S. dollar. The first point of technical support is near 475, a relative low established in June of 2020. The first point of technical resistance is near 519 at the 50-day moving average.
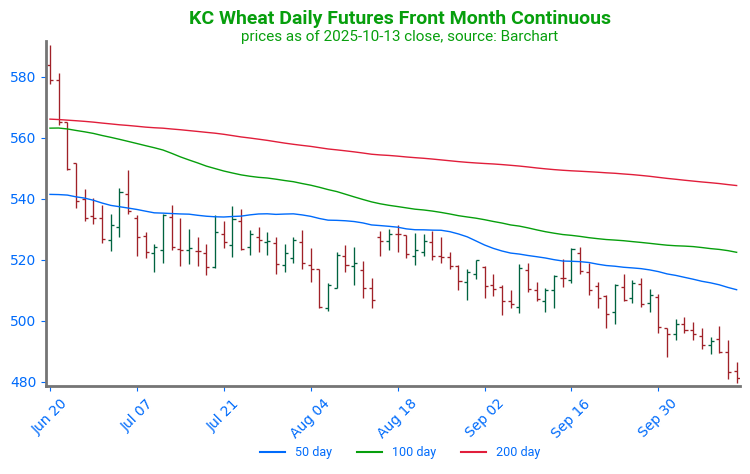
KC Wheat Fails to Find Support, Makes New Lows: KC wheat has trended lower following contract rollover on August 14. The market has since returned to price levels not seen since the fall of 2020. The first point of technical support can be found near 465, a consolidation range from September of 2020. The first point of technical resistance is near 510, at the 50-day moving average.
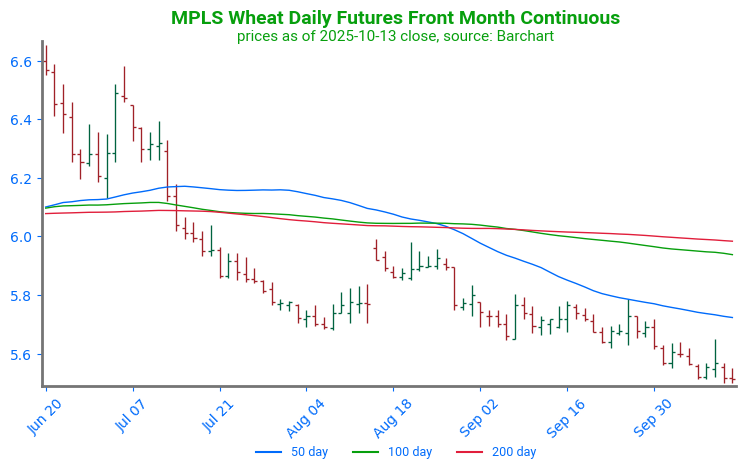
Spring Wheat Presses Lower: Spring wheat futures have failed to find solid support, trading at the lowest price since December 2020. The first point of strong resistance sits near 574 at the 50-day moving average. A second point can be found through a cluster of moving averages near 600. Technical support can be found near 540, the bottom of a consolidation range from December of 2020.
Grain Market Insider is provided by Stewart-Peterson Inc., a publishing company.
Futures and options trading involve significant risk of loss and may not be suitable for everyone. Therefore, carefully consider whether such trading is suitable for you in light of your financial condition. The data contained herein is believed to be drawn from reliable sources but cannot be guaranteed. This material has been prepared by a sales or trading employee or agent of Total Farm Marketing by Stewart-Peterson and is, or is in the nature of, a solicitation. Any decisions you may make to buy, sell or hold a futures or options position on such research are entirely your own and not in any way deemed to be endorsed by or attributed to Stewart-Peterson Inc. Reproduction of this information without prior written permission is prohibited. Hypothetical performance results have many inherent limitations. No representation is being made that any account will or is likely to achieve profits or losses similar to those shown. The data contained herein is believed to be drawn from reliable sources but cannot be guaranteed. Reproduction and distribution of this information without prior written permission is prohibited. This material has been prepared by a sales or trading employee or agent of Total Farm Marketing and is, or is in the nature of, a solicitation. Any decisions you may make to buy, sell or hold a position on such research are entirely your own and not in any way deemed to be endorsed by or attributed to Total Farm Marketing.
Stewart-Peterson Inc., Stewart-Peterson Group Inc., and SP Risk Services LLC are each part of the family of companies within Total Farm Marketing (TFM). Stewart-Peterson Inc. is a publishing company. Stewart-Peterson Group Inc. is registered with the Commodity Futures Trading Commission (CFTC) as an introducing broker and is a member of National Futures Association. SP Risk Services LLC is an insurance agency. A customer may have relationships with any or all three companies.