10-13 Opening Update: Corn and Soybeans Quietly Higher, Wheat Mixed


- Corn futures are trading slightly higher this morning. December corn futures are up 3-4 cent to 413-7/4 and March futures are up 1/4 cent to 429-1/4.
- The lack of USDA data continues to weigh on the market as traders take a defensive stance. Private analysts currently estimate U.S. corn yield slightly lower than the USDA’s 186.7, but expect feed and residual usage to decline 200 million bushels. If realized, this would increase ending stocks to 2,464 million bushels.
- The U.S. Dollar is trading higher this morning after failing to break through overhead resistance on Friday. Additional strength in the U.S. dollar will erode U.S. grains’ competitiveness in the global marketplace.
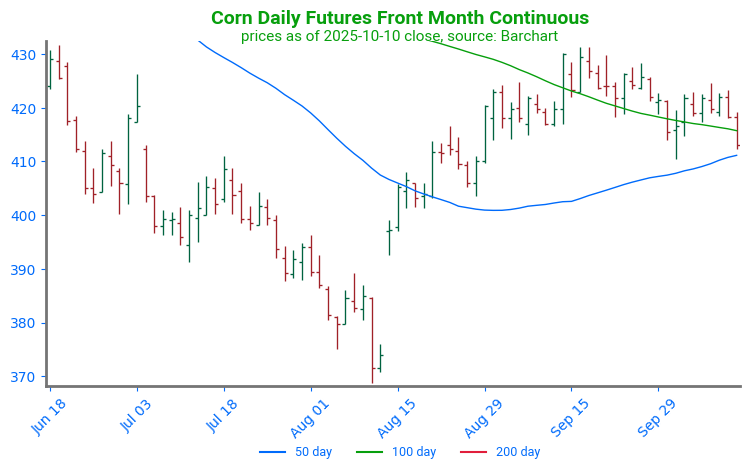
Corn Futures Hang Near Support: Corn futures have trended sideways to lower over the past month, pressured by harvest selling and the bearish September Grain Stocks report. The market appears to be consolidating around the 100-day moving average, with upside resistance near the September highs at 431 and support at the 50-day moving average around 410.

- Soybean futures have started the week higher with November futures up 1-1/2 cents to 1008-1/4 and January futures up 2 cents to 1025-1/4.
- November soybean futures are trading at their lowest level since early October as renewed U.S. – China trade tensions have driven the market lower.
- On Friday, President Trump threatened to impose 100% tariffs on Chinese goods, though the White House later indicated a willingness to reopen negotiations. Uncertainty remains over whether President Trump and Chinese President Xi Jinping will meet for discussions at the upcoming APEC summit.
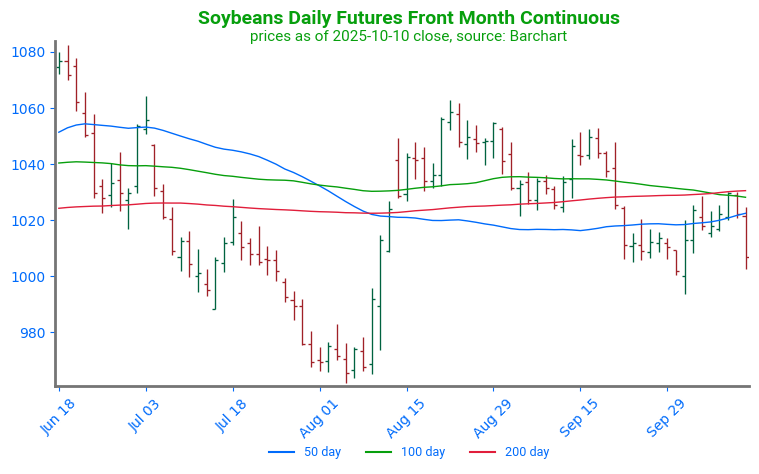
Soybean Futures Bounce at Support: Soybean futures moved lower in rapid fashion, breaking through structural support as well as a cluster of three major moving averages. Trendline support lies near 970.

- Wheat futures have started the day mixed. December Chicago wheat futures are down 2-1/2 cents to 496. December KC wheat is down 1-1/2 cents to 481-1/2, and December MPLS wheat is unchanged at 5.52.
- Private analysts expect that if the October WASDE report had been released, USDA would have raised Argentina, Russia, and Canada’s wheat production estimates.
- SovEcon has raised its estimate for Russia’s 2025 wheat production, increasing it by 600,000 MT to 87.8 MMT. This compares to the USDA’s most recent forecast of 85 MMT. Additionally, Russia’s agriculture ministry reduced the wheat export tax by 35% to 318.6 rubles per metric ton through October 21 in an effort to boost export demand.
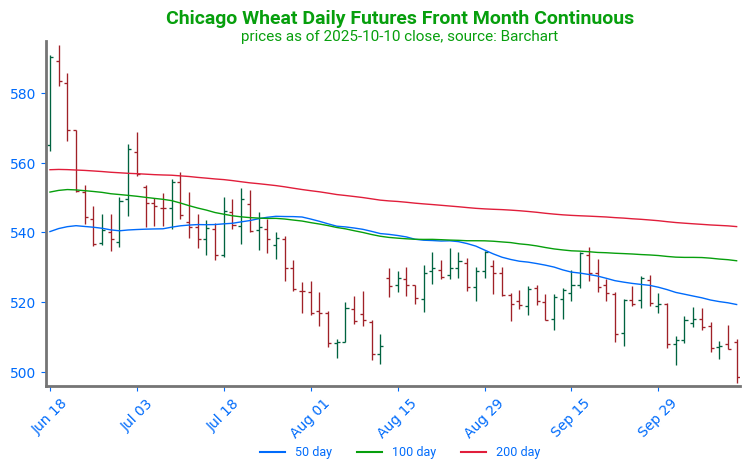
Chicago Wheat Consolidates: Wheat futures have been consolidating following their retest of the mid-August low. The first point of technical resistance can be found near 521 at the 50-day moving average, and a secondary point near 532 at the 100-day moving average. Support can be found at 502, a multi-year low.
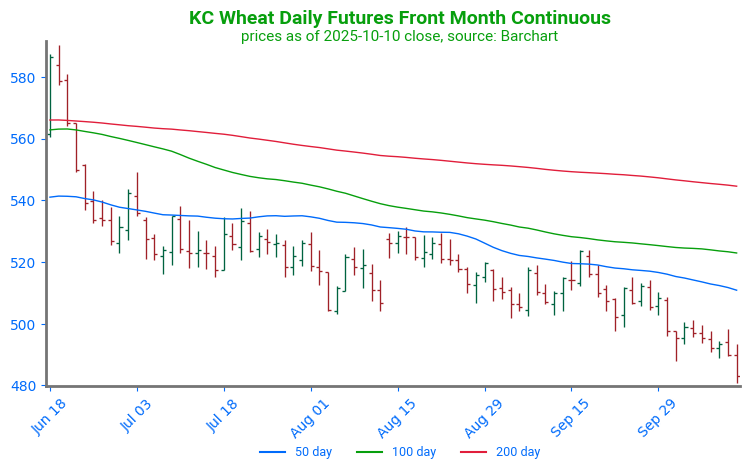
KC Wheat Fails to Find Support, Makes New Lows: KC wheat has trended lower following contract rollover on August 14. The market has since returned to price levels not seen since the fall of 2020. The first point of technical support can be found near 488, a multi-year low. The first point of technical resistance is near 513, at the 50-day moving average.
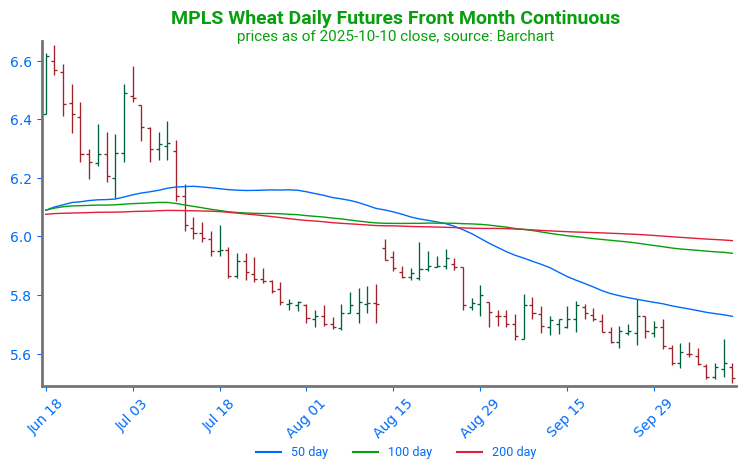
Spring Wheat Consolidates Below Support: Spring wheat futures have failed to find solid support, trading at the lowest price since December 2020. The first point of strong resistance sits near 574 at the 50-day moving average. A second point can be found through a cluster of moving averages near 600. Technical support can be found at 555, a multi-year low.
Grain Market Insider is provided by Stewart-Peterson Inc., a publishing company.
Futures and options trading involve significant risk of loss and may not be suitable for everyone. Therefore, carefully consider whether such trading is suitable for you in light of your financial condition. The data contained herein is believed to be drawn from reliable sources but cannot be guaranteed. This material has been prepared by a sales or trading employee or agent of Total Farm Marketing by Stewart-Peterson and is, or is in the nature of, a solicitation. Any decisions you may make to buy, sell or hold a futures or options position on such research are entirely your own and not in any way deemed to be endorsed by or attributed to Stewart-Peterson Inc. Reproduction of this information without prior written permission is prohibited. Hypothetical performance results have many inherent limitations. No representation is being made that any account will or is likely to achieve profits or losses similar to those shown. The data contained herein is believed to be drawn from reliable sources but cannot be guaranteed. Reproduction and distribution of this information without prior written permission is prohibited. This material has been prepared by a sales or trading employee or agent of Total Farm Marketing and is, or is in the nature of, a solicitation. Any decisions you may make to buy, sell or hold a position on such research are entirely your own and not in any way deemed to be endorsed by or attributed to Total Farm Marketing.
Stewart-Peterson Inc., Stewart-Peterson Group Inc., and SP Risk Services LLC are each part of the family of companies within Total Farm Marketing (TFM). Stewart-Peterson Inc. is a publishing company. Stewart-Peterson Group Inc. is registered with the Commodity Futures Trading Commission (CFTC) as an introducing broker and is a member of National Futures Association. SP Risk Services LLC is an insurance agency. A customer may have relationships with any or all three companies.