10-09 Opening Update: Corn, Soybeans Slip, Wheat Rises


- Corn futures are trading lower this morning. December corn futures are down 1-1/4 cents to 420-3/4 and March futures are down 1-1/2 cents to 436-1/4.
- Corn spreads are showing renewed strength on the front end, with the Dec–Mar spread narrowing to its tightest level since July. The move may reflect strong demand, producer holding, or tighter nearby supplies supporting the front months.
- The U.S. Dollar is trading at a two month high. Continued strength in the dollar will act as a headwind for U.S. grain exports.
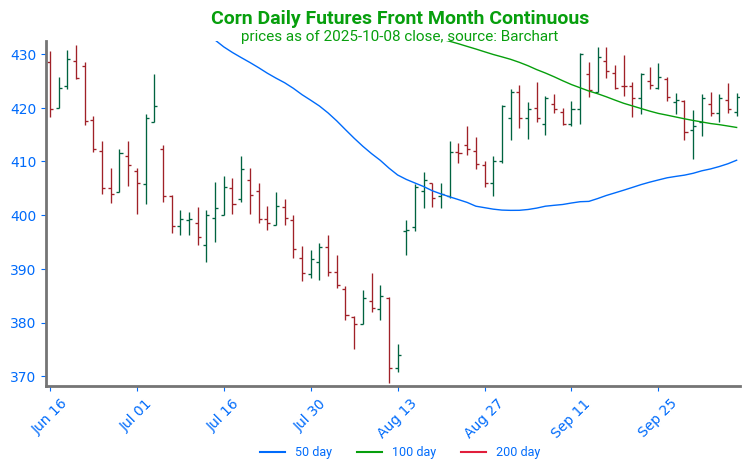
Corn Futures Hang Near Support: Corn futures have trended sideways to lower over the past month, pressured by harvest selling and the bearish September Grain Stocks report. The market appears to be consolidating around the 100-day moving average, with upside resistance near the September highs at 431 and support at the 50-day moving average around 410.

- Soybean futures have started the day lower with November futures down 4-3/4 cents to 1024-3/4 and January futures down 4-3/4 cents to 1039-1/2.
- A key hurdle for U.S. soybean markets and potential trade progress with China is the planned implementation of port fees on Chinese vessels entering U.S. ports, set to begin October 14. Analysts warn the new fees could hinder ongoing trade negotiations between the two countries.
- Private analysts surveyed by Reuters expect the USDA to lower its soybean yield estimate once the agency resumes releasing data.
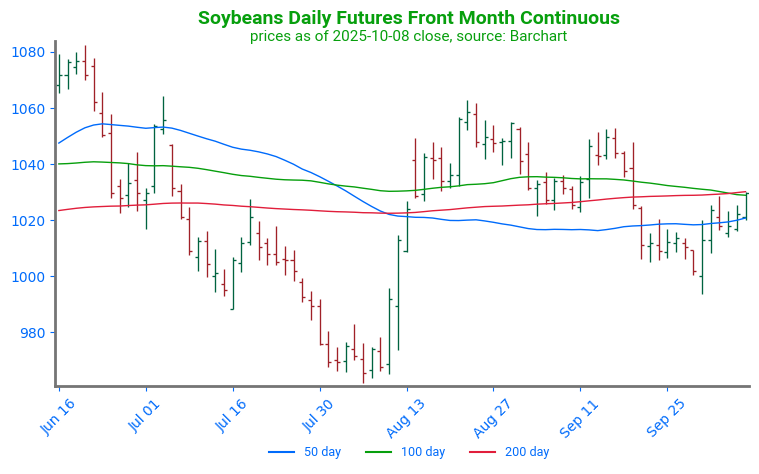
Soybean Futures Bounce at Support: Soybean futures moved lower in rapid fashion, breaking through structural support as well as a cluster of three major moving averages. Trendline support lies near 970.

- Wheat has started the day higher. December Chicago wheat futures are up 2-1/4 cents to 509-1/2. December KC wheat is up 2-1/4 cents to 495-1/2, and December MPLS wheat is up 4 cents to 5.59.
- Traders will not receive the scheduled monthly WASDE report due to the government shutdown, though private analysts continue to release estimates. A Bloomberg survey pegs 2025/26 U.S. wheat ending stocks at 880 mb, up from 844 mb in September, while global carryout is estimated at 265.9 mmt versus 264.1 mmt in the last USDA report.
- SovEcon raised its forecast for Ukraine’s 2025 wheat crop by 1.5 mmt to 22.9 mmt, citing higher yields. The group also lifted its 2025/26 wheat export estimate to 16.8 mmt.
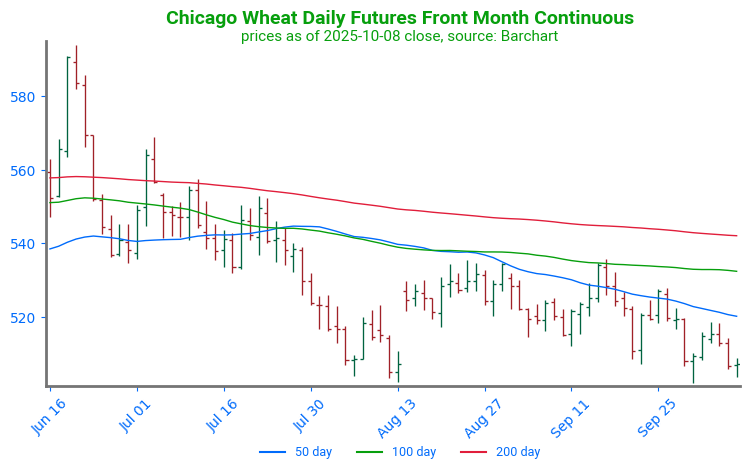
Chicago Wheat Consolidates: Wheat futures have been consolidating following their retest of the mid-August low. The first point of technical resistance can be found near 521 at the 50-day moving average, and a secondary point near 532 at the 100-day moving average. Support can be found at 502, a multi-year low.
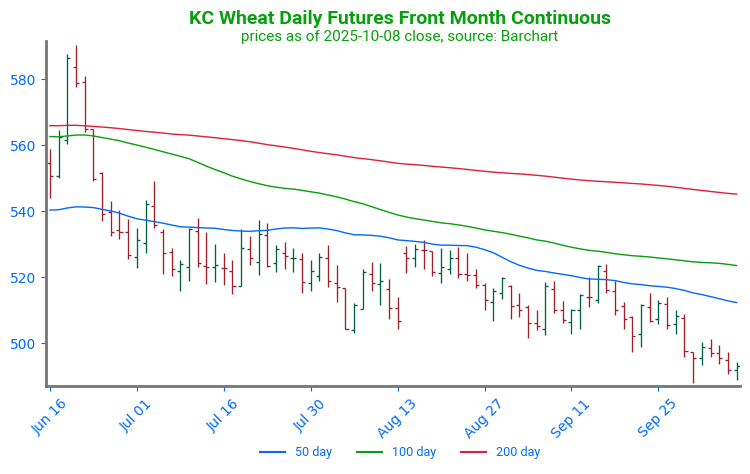
KC Wheat Fails to Find Support, Makes New Lows: KC wheat has trended lower following contract rollover on August 14. The market has since returned to price levels not seen since the fall of 2020. The first point of technical support can be found near 488, a multi-year low. The first point of technical resistance is near 513, at the 50-day moving average.
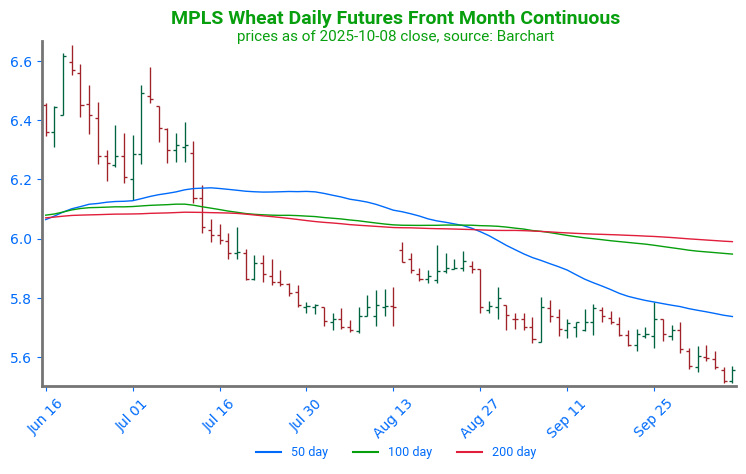
Spring Wheat Consolidates Below Support: Spring wheat futures have failed to find solid support, trading at the lowest price since December 2020. The first point of strong resistance sits near 574 at the 50-day moving average. A second point can be found through a cluster of moving averages near 600. Technical support can be found at 555, a multi-year low.
Grain Market Insider is provided by Stewart-Peterson Inc., a publishing company.
Futures and options trading involve significant risk of loss and may not be suitable for everyone. Therefore, carefully consider whether such trading is suitable for you in light of your financial condition. The data contained herein is believed to be drawn from reliable sources but cannot be guaranteed. This material has been prepared by a sales or trading employee or agent of Total Farm Marketing by Stewart-Peterson and is, or is in the nature of, a solicitation. Any decisions you may make to buy, sell or hold a futures or options position on such research are entirely your own and not in any way deemed to be endorsed by or attributed to Stewart-Peterson Inc. Reproduction of this information without prior written permission is prohibited. Hypothetical performance results have many inherent limitations. No representation is being made that any account will or is likely to achieve profits or losses similar to those shown. The data contained herein is believed to be drawn from reliable sources but cannot be guaranteed. Reproduction and distribution of this information without prior written permission is prohibited. This material has been prepared by a sales or trading employee or agent of Total Farm Marketing and is, or is in the nature of, a solicitation. Any decisions you may make to buy, sell or hold a position on such research are entirely your own and not in any way deemed to be endorsed by or attributed to Total Farm Marketing.
Stewart-Peterson Inc., Stewart-Peterson Group Inc., and SP Risk Services LLC are each part of the family of companies within Total Farm Marketing (TFM). Stewart-Peterson Inc. is a publishing company. Stewart-Peterson Group Inc. is registered with the Commodity Futures Trading Commission (CFTC) as an introducing broker and is a member of National Futures Association. SP Risk Services LLC is an insurance agency. A customer may have relationships with any or all three companies.